Town of Henrietta Airbnb Market Analysis 2026: Short Term Rental Data & Vacation Rental Statistics in New York, United States
Is Airbnb profitable in Town of Henrietta in 2026? Explore comprehensive Airbnb analytics for Town of Henrietta, New York, United States to uncover income potential. This 2026 STR market report for Town of Henrietta, based on AirROI data from February 2025 to January 2026, reveals key trends in the niche market of 67 active listings.
Whether you're considering an Airbnb investment in Town of Henrietta, optimizing your existing vacation rental, or exploring rental arbitrage opportunities, understanding the Town of Henrietta Airbnb data is crucial. Leveraging the low regulation environment is key to maximizing your short term rental income potential. Let's dive into the specifics.
Key Town of Henrietta Airbnb Performance Metrics Overview
Monthly Airbnb Revenue Variations & Income Potential in Town of Henrietta (2026)
Understanding the monthly revenue variations for Airbnb listings in Town of Henrietta is key to maximizing your short term rental income potential. Seasonality significantly impacts earnings. Our analysis, based on data from the past 12 months, shows that the peak revenue month for STRs in Town of Henrietta is typically August, while March often presents the lowest earnings, highlighting opportunities for strategic pricing adjustments during shoulder and low seasons. Explore the typical Airbnb income in Town of Henrietta across different performance tiers:
- Best-in-class properties (Top 10%) achieve $4,425+ monthly, often utilizing dynamic pricing and superior guest experiences.
- Strong performing properties (Top 25%) earn $3,324 or more, indicating effective management and desirable locations/amenities.
- Typical properties (Median) generate around $1,851 per month, representing the average market performance.
- Entry-level properties (Bottom 25%) see earnings around $809, often with potential for optimization.
Average Monthly Airbnb Earnings Trend in Town of Henrietta
Town of Henrietta Airbnb Occupancy Rate Trends (2026)
Maximize your bookings by understanding the Town of Henrietta STR occupancy trends. Seasonal demand shifts significantly influence how often properties are booked. Typically, Augustsees the highest demand (peak season occupancy), while January experiences the lowest (low season). Effective strategies, like adjusting minimum stays or offering promotions, can boost occupancy during slower periods. Here's how different property tiers perform in Town of Henrietta:
- Best-in-class properties (Top 10%) achieve 87%+ occupancy, indicating high desirability and potentially optimized availability.
- Strong performing properties (Top 25%) maintain 69% or higher occupancy, suggesting good market fit and guest satisfaction.
- Typical properties (Median) have an occupancy rate around 50%.
- Entry-level properties (Bottom 25%) average 29% occupancy, potentially facing higher vacancy.
Average Monthly Occupancy Rate Trend in Town of Henrietta
Average Daily Rate (ADR) Airbnb Trends in Town of Henrietta (2026)
Effective short term rental pricing strategy in Town of Henrietta involves understanding monthly ADR fluctuations. The Average Daily Rate (ADR) for Airbnb in Town of Henrietta typically peaks in December and dips lowest during March. Leveraging Airbnb dynamic pricing tools or strategies based on this seasonality can significantly boost revenue. Here's a look at the typical nightly rates achieved:
- Best-in-class properties (Top 10%) command rates of $253+ per night, often due to premium features or locations.
- Strong performing properties (Top 25%) achieve nightly rates of $195 or more.
- Typical properties (Median) charge around $145 per night.
- Entry-level properties (Bottom 25%) earn around $65 per night.
Average Daily Rate (ADR) Trend by Month in Town of Henrietta
Get Live Town of Henrietta Market Intelligence 👇

Explore Real-time Analytics
Airbnb Seasonality Analysis & Trends in Town of Henrietta (2026)
Peak Season (August, July, November)
- Revenue averages $2,729 per month
- Occupancy rates average 60.0%
- Daily rates average $151
Shoulder Season
- Revenue averages $2,204 per month
- Occupancy maintains around 47.7%
- Daily rates hold near $146
Low Season (January, March, April)
- Revenue drops to average $1,621 per month
- Occupancy decreases to average 42.9%
- Daily rates adjust to average $136
Seasonality Insights for Town of Henrietta
- The Airbnb seasonality in Town of Henrietta shows moderate seasonality with distinct peak and low periods. While the sections above show seasonal averages, it's also insightful to look at the extremes:
- During the high season, the absolute peak month showcases Town of Henrietta's highest earning potential, with monthly revenues capable of climbing to $2,873, occupancy reaching a high of 63.1%, and ADRs peaking at $154.
- Conversely, the slowest single month of the year, typically falling within the low season, marks the market's lowest point. In this month, revenue might dip to $1,536, occupancy could drop to 33.5%, and ADRs may adjust down to $128.
- Understanding both the seasonal averages and these monthly peaks and troughs in revenue, occupancy, and ADR is crucial for maximizing your Airbnb profit potential in Town of Henrietta.
Seasonal Strategies for Maximizing Profit
- Peak Season: Maximize revenue through premium pricing and potentially longer minimum stays. Ensure high availability.
- Low Season: Offer competitive pricing, special promotions (e.g., extended stay discounts), and flexible cancellation policies. Target off-season travelers like remote workers or budget-conscious guests.
- Shoulder Seasons: Implement dynamic pricing that balances peak and low rates. Target weekend travelers or specific events. Offer slightly more flexible terms than peak season.
- Regularly analyze your own performance against these Town of Henrietta seasonality benchmarks and adjust your pricing and availability strategy accordingly.
Best Areas for Airbnb Investment in Town of Henrietta (2026)
Exploring the top neighborhoods for short-term rentals in Town of Henrietta? This section highlights key areas, outlining why they are attractive for hosts and guests, along with notable local attractions. Consider these locations based on your target guest profile and investment strategy.
| Neighborhood / Area | Why Host Here? (Target Guests & Appeal) | Key Attractions & Landmarks |
|---|---|---|
| Pittsford | Charming village with a historic downtown, beautiful parks, and access to the Erie Canal. Attracts both tourists and locals for outdoor activities and dining. | Pittsford Village, Erie Canal Path, Mendon Ponds Park, Pittsford Plaza, Mendon Town Park |
| Rochester's East End | Vibrant area known for its nightlife, cultural events, and proximity to downtown Rochester attractions. Great for young visitors and professionals. | Eastman Theatre, Rochester Contemporary Art Center, Multiple bars and nightclubs, High Falls, Rochester City Market |
| Irondequoit | Suburban area with scenic views of Lake Ontario and parks. Attractive for families and tourists seeking a relaxed environment with access to nature. | Irondequoit Bay, Seabreeze Amusement Park, Durand Eastman Park, Roberts Wesleyan College, Lake Ontario |
| Henrietta | Central location with a mix of suburban comfort and proximity to shopping areas. Great for travelers looking for convenience to area attractions. | Marketplace Mall, Veterans Memorial Park, Rochester Institute of Technology, The Henrietta Pavilion, Local dining options |
| Fairport | Quaint village atmosphere with access to the Erie Canal, parks, and local shops. Ideal for those looking for a small-town experience. | Fairport Canal Days, Packett's Landing, Fairport Village Landing, Lehigh Valley Trail, Local artisan shops |
| Greece | Lakeside community known for parks and recreational activities. Appeals to families and outdoor enthusiasts looking to explore the area. | Greece Canal Park, Cobb's Hill Park, Lake Ontario, Seneca Park Zoo, Greece Ridge Center Mall |
| Webster | Family-friendly suburb known for its schools and community events. Attracts visitors looking for a quiet stay close to urban amenities. | Webster Park, Lake Road Estates, Webster Farmers Market, Greystone Nature Preserve, Local restaurants |
| Chili | Suburban area with a tight-knit community feel. Good for people looking for a quieter stay while still being close to Rochester attractions. | Chili Public Library, Black Creek Park, Local community events, Chili Center, Nearby shopping areas |
Understanding Airbnb License Requirements & STR Laws in Town of Henrietta (2026)
While Town of Henrietta, New York, United States currently shows low STR regulations, specific Airbnb license requirements might still exist or change. Always verify the latest short term rental regulations and Airbnb license requirements directly with local government authorities for Town of Henrietta to ensure full compliance before hosting.
(Source: AirROI data, 2026, finding no licensed listings among those analyzed)
Top Performing Airbnb Properties in Town of Henrietta (2026)
Benchmark your potential! Explore examples of top-performing Airbnb properties in Town of Henriettabased on Trailing Twelve Month (TTM) revenue. Analyze their characteristics, revenue, occupancy rate, and ADR to understand what drives success in this market.
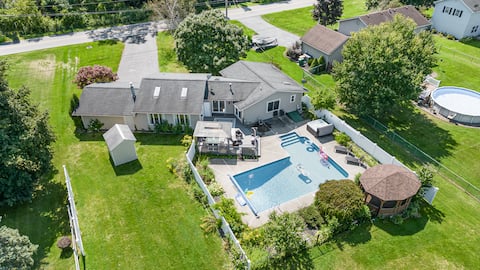
Relaxing Private Pool& Hot Tub House near RIT Inn
Entire Place • 3 bedrooms

4 bed ranch w/pool in Henrietta
Entire Place • 4 bedrooms
Pet and family friendly home in Henrietta
Entire Place • 4 bedrooms

Fully Remodeled 2BR Waterfront Home Next to RIT
Entire Place • 2 bedrooms
Entire Modern House in Pittsford
Entire Place • 3 bedrooms

Cozy 5 bedroom Home mins from RIT
Entire Place • 5 bedrooms
Note: Performance varies based on location, size, amenities, seasonality, and management quality. Data reflects the past 12 months.
Top Performing Airbnb Hosts in Town of Henrietta (2026)
Learn from the best! This table showcases top-performing Airbnb hosts in Town of Henrietta based on the number of properties managed and estimated total revenue over the past year. Analyze their scale and performance metrics.
| Host Name | Properties | Grossing Revenue | Stay Reviews | Avg Rating |
|---|---|---|---|---|
| Beatriz | 2 | $91,306 | 312 | 4.99/5.0 |
| Shirley | 2 | $72,548 | 144 | 4.97/5.0 |
| Jing.Cong | 2 | $65,360 | 208 | 4.70/5.0 |
| Amy | 1 | $57,782 | 51 | 4.86/5.0 |
| Brian And Lisa | 8 | $57,678 | 258 | 4.88/5.0 |
| Desirée | 2 | $54,914 | 627 | 4.95/5.0 |
| Cheryl | 2 | $51,162 | 126 | 4.92/5.0 |
| Michael | 1 | $49,183 | 42 | 4.81/5.0 |
| Nicole | 1 | $48,878 | 153 | 4.95/5.0 |
| Ha | 2 | $48,706 | 176 | 4.67/5.0 |
Analyzing the strategies of top hosts, such as their property selection, pricing, and guest communication, can offer valuable lessons for optimizing your own Airbnb operations in Town of Henrietta.
Dive Deeper: Advanced Town of Henrietta STR Market Data (2026)
Ready to unlock more insights? AirROI provides access to advanced metrics and comprehensive Airbnb data for Town of Henrietta. Explore detailed analytics beyond this report to refine your investment strategy, optimize pricing, and maximize your vacation rental profits.
Explore Advanced MetricsTown of Henrietta Short-Term Rental Market Composition (2026): Property & Room Types
Room Type Distribution
Property Type Distribution
Market Composition Insights for Town of Henrietta
- The Town of Henrietta Airbnb market composition is heavily skewed towards Entire Home/Apt listings, which make up 61.2% of the 67 active rentals. This indicates strong guest preference for privacy and space.
- However, a notable 38.8% share for Private Rooms suggests opportunities for budget-conscious travelers or hosts renting out spare rooms.
- Looking at the property type distribution in Town of Henrietta, House properties are the most common (89.6%), reflecting the local real estate landscape.
- Houses represent a significant 89.6% portion, catering likely to families or larger groups.
- Smaller segments like apartment/condo, others, outdoor/unique (combined 10.5%) offer potential for unique stay experiences.
Town of Henrietta Airbnb Room Capacity Analysis (2026): Bedroom Distribution
Distribution of Listings by Number of Bedrooms
Room Capacity Insights for Town of Henrietta
- The dominant room capacity in Town of Henrietta is 3 bedrooms listings, making up 31.3% of the market. This suggests a strong demand for properties suitable for families or small groups.
- Together, 3 bedrooms and 4 bedrooms properties represent 44.7% of the active Airbnb listings in Town of Henrietta, indicating a high concentration in these sizes.
- A significant 46.2% of listings offer 3+ bedrooms, catering to larger groups and families seeking more space in Town of Henrietta.
Town of Henrietta Vacation Rental Guest Capacity Trends (2026)
Distribution of Listings by Guest Capacity
Guest Capacity Insights for Town of Henrietta
- The most common guest capacity trend in Town of Henrietta vacation rentals is listings accommodating 6 guests (23.9%). This suggests the primary traveler segment is likely larger groups.
- Properties designed for 6 guests and 8+ guests dominate the Town of Henrietta STR market, accounting for 41.8% of listings.
- 44.8% of properties accommodate 6+ guests, serving the market segment for larger families or group travel in Town of Henrietta.
- On average, properties in Town of Henrietta are equipped to host 3.7 guests.
Town of Henrietta Airbnb Booking Patterns (2026): Available vs. Booked Days
Available Days Distribution
Booked Days Distribution
Booking Pattern Insights for Town of Henrietta
- The most common availability pattern in Town of Henrietta falls within the 271-366 days range, representing 32.8% of listings. This suggests many properties have significant open periods on their calendars.
- Approximately 64.1% of listings show high availability (181+ days open annually), indicating potential for increased bookings or specific owner usage patterns.
- For booked days, the 181-270 days range is most frequent in Town of Henrietta (34.3%), reflecting common guest stay durations or potential owner blocking patterns.
- A notable 37.3% of properties secure long booking periods (181+ days booked per year), highlighting successful long-term rental strategies or significant owner usage.
Town of Henrietta Airbnb Minimum Stay Requirements Analysis
Distribution of Listings by Minimum Night Requirement
1 Night
20 listings
29.9% of total
2 Nights
12 listings
17.9% of total
3 Nights
14 listings
20.9% of total
4-6 Nights
1 listings
1.5% of total
7-29 Nights
3 listings
4.5% of total
30+ Nights
17 listings
25.4% of total
Key Insights
- The most prevalent minimum stay requirement in Town of Henrietta is 1 Night, adopted by 29.9% of listings. This highlights the market's preference for shorter, flexible bookings.
- A significant segment (25.4%) caters to monthly stays (30+ nights) in Town of Henrietta, pointing to opportunities in the extended-stay market.
Recommendations
- Align with the market by considering a 1 Night minimum stay, as 29.9% of Town of Henrietta hosts use this setting.
- If feasible, allowing 1-night stays, especially midweek or during low season, could capture last-minute bookings, as only 29.9% currently do.
- Explore offering discounts for stays of 30+ nights to attract the 25.4% of the market seeking extended stays.
- Adjust minimum nights based on seasonality – potentially shorter during low season and longer during peak demand periods in Town of Henrietta.
Town of Henrietta Airbnb Cancellation Policy Trends Analysis (2026)
Flexible
24 listings
35.8% of total
Moderate
20 listings
29.9% of total
Firm
16 listings
23.9% of total
Strict
7 listings
10.4% of total
Cancellation Policy Insights for Town of Henrietta
- The prevailing Airbnb cancellation policy trend in Town of Henrietta is Flexible, used by 35.8% of listings.
- There's a relatively balanced mix between guest-friendly (65.7%) and stricter (34.3%) policies, offering choices for different guest needs.
Recommendations for Hosts
- Consider adopting a Flexible policy to align with the 35.8% market standard in Town of Henrietta.
- Using a Strict policy might deter some guests, as only 10.4% of listings use it. Evaluate if potential revenue protection outweighs possible lower booking rates.
- Regularly review your cancellation policy against competitors and market demand shifts in Town of Henrietta.
Town of Henrietta STR Booking Lead Time Analysis (2026)
Average Booking Lead Time by Month
Booking Lead Time Insights for Town of Henrietta
- The overall average booking lead time for vacation rentals in Town of Henrietta is 44 days.
- Guests book furthest in advance for stays during May (average 89 days), likely coinciding with peak travel demand or local events.
- The shortest booking windows occur for stays in February (average 22 days), indicating more last-minute travel plans during this time.
- Seasonally, Spring (55 days avg.) sees the longest lead times, while Winter (33 days avg.) has the shortest, reflecting typical travel planning cycles.
Recommendations for Hosts
- Use the overall average lead time (44 days) as a baseline for your pricing and availability strategy in Town of Henrietta.
- For May stays, consider implementing length-of-stay discounts or slightly higher rates for bookings made less than 89 days out to capitalize on advance planning.
- Target marketing efforts for the Spring season well in advance (at least 55 days) to capture early planners.
- Monitor your own booking lead times against these Town of Henrietta averages to identify opportunities for dynamic pricing adjustments.
Popular & Essential Airbnb Amenities in Town of Henrietta (2026)
Amenity Prevalence
Amenity Insights for Town of Henrietta
- Essential amenities in Town of Henrietta that guests expect include: Smoke alarm, Free parking on premises, Wifi, Carbon monoxide alarm, TV, Heating. Lacking these (any) could significantly impact bookings.
- Popular amenities like Coffee maker, Kitchen, Hot water are common but not universal. Offering these can provide a competitive edge.
Recommendations for Hosts
- Ensure your listing includes all essential amenities for Town of Henrietta: Smoke alarm, Free parking on premises, Wifi, Carbon monoxide alarm, TV, Heating.
- Prioritize adding missing essentials: Carbon monoxide alarm, TV, Heating.
- Consider adding popular differentiators like Coffee maker or Kitchen to increase appeal.
- Highlight unique or less common amenities you offer (e.g., hot tub, dedicated workspace, EV charger) in your listing description and photos.
- Regularly check competitor amenities in Town of Henrietta to stay competitive.
Town of Henrietta Airbnb Guest Demographics & Profile Analysis (2026)
Guest Profile Summary for Town of Henrietta
- The typical guest profile for Airbnb in Town of Henrietta consists of primarily domestic travelers (94%), often arriving from nearby Rochester, typically belonging to the Post-2000s (Gen Z/Alpha) group (50%), primarily speaking English or Spanish.
- Domestic travelers account for 93.8% of guests.
- Key international markets include United States (93.8%) and Canada (1.9%).
- Top languages spoken are English (68%) followed by Spanish (9.8%).
- A significant demographic segment is the Post-2000s (Gen Z/Alpha) group, representing 50% of guests.
Recommendations for Hosts
- Target domestic marketing efforts towards travelers from Rochester and New York.
- Tailor amenities and listing descriptions to appeal to the dominant Post-2000s (Gen Z/Alpha) demographic (e.g., highlight fast WiFi, smart home features, local guides).
- Highlight unique local experiences or amenities relevant to the primary guest profile.
- Consider seasonal promotions aligned with peak travel times for key origin markets.
Nearby Short-Term Rental Market Comparison
How does the Town of Henrietta Airbnb market stack up against its neighbors? Compare key performance metrics like average monthly revenue, ADR, and occupancy rates in surrounding areas to understand the broader regional STR landscape.
| Market | Active Properties | Monthly Revenue | Daily Rate | Avg. Occupancy |
|---|---|---|---|---|
| Town of Torrey | 34 | $5,535 | $437.35 | 50% |
| Rushville | 16 | $5,126 | $656.66 | 41% |
| Town of Mansfield | 61 | $4,782 | $517.31 | 32% |
| Town of Otisco | 22 | $4,749 | $417.83 | 43% |
| Town of Porter | 22 | $4,724 | $331.03 | 54% |
| Town of Canandaigua | 79 | $4,714 | $488.12 | 42% |
| Town of Fayette | 59 | $4,659 | $407.20 | 42% |
| Town of Skaneateles | 68 | $4,507 | $498.14 | 42% |
| Town of Varick | 34 | $4,385 | $447.56 | 43% |
| Town of Catharine | 12 | $4,308 | $488.11 | 40% |