Town of Ellicottville Airbnb Market Analysis 2026: Short Term Rental Data & Vacation Rental Statistics in New York, United States
Is Airbnb profitable in Town of Ellicottville in 2026? Explore comprehensive Airbnb analytics for Town of Ellicottville, New York, United States to uncover income potential. This 2026 STR market report for Town of Ellicottville, based on AirROI data from February 2025 to January 2026, reveals key trends in the market of 217 active listings.
Whether you're considering an Airbnb investment in Town of Ellicottville, optimizing your existing vacation rental, or exploring rental arbitrage opportunities, understanding the Town of Ellicottville Airbnb data is crucial. Leveraging the low regulation environment is key to maximizing your short term rental income potential. Let's dive into the specifics.
Key Town of Ellicottville Airbnb Performance Metrics Overview
Monthly Airbnb Revenue Variations & Income Potential in Town of Ellicottville (2026)
Understanding the monthly revenue variations for Airbnb listings in Town of Ellicottville is key to maximizing your short term rental income potential. Seasonality significantly impacts earnings. Our analysis, based on data from the past 12 months, shows that the peak revenue month for STRs in Town of Ellicottville is typically February, while April often presents the lowest earnings, highlighting opportunities for strategic pricing adjustments during shoulder and low seasons. Explore the typical Airbnb income in Town of Ellicottville across different performance tiers:
- Best-in-class properties (Top 10%) achieve $8,166+ monthly, often utilizing dynamic pricing and superior guest experiences.
- Strong performing properties (Top 25%) earn $5,049 or more, indicating effective management and desirable locations/amenities.
- Typical properties (Median) generate around $2,727 per month, representing the average market performance.
- Entry-level properties (Bottom 25%) see earnings around $1,408, often with potential for optimization.
Average Monthly Airbnb Earnings Trend in Town of Ellicottville
Town of Ellicottville Airbnb Occupancy Rate Trends (2026)
Maximize your bookings by understanding the Town of Ellicottville STR occupancy trends. Seasonal demand shifts significantly influence how often properties are booked. Typically, Februarysees the highest demand (peak season occupancy), while April experiences the lowest (low season). Effective strategies, like adjusting minimum stays or offering promotions, can boost occupancy during slower periods. Here's how different property tiers perform in Town of Ellicottville:
- Best-in-class properties (Top 10%) achieve 63%+ occupancy, indicating high desirability and potentially optimized availability.
- Strong performing properties (Top 25%) maintain 43% or higher occupancy, suggesting good market fit and guest satisfaction.
- Typical properties (Median) have an occupancy rate around 26%.
- Entry-level properties (Bottom 25%) average 15% occupancy, potentially facing higher vacancy.
Average Monthly Occupancy Rate Trend in Town of Ellicottville
Average Daily Rate (ADR) Airbnb Trends in Town of Ellicottville (2026)
Effective short term rental pricing strategy in Town of Ellicottville involves understanding monthly ADR fluctuations. The Average Daily Rate (ADR) for Airbnb in Town of Ellicottville typically peaks in January and dips lowest during April. Leveraging Airbnb dynamic pricing tools or strategies based on this seasonality can significantly boost revenue. Here's a look at the typical nightly rates achieved:
- Best-in-class properties (Top 10%) command rates of $714+ per night, often due to premium features or locations.
- Strong performing properties (Top 25%) achieve nightly rates of $508 or more.
- Typical properties (Median) charge around $317 per night.
- Entry-level properties (Bottom 25%) earn around $227 per night.
Average Daily Rate (ADR) Trend by Month in Town of Ellicottville
Get Live Town of Ellicottville Market Intelligence 👇

Explore Real-time Analytics
Airbnb Seasonality Analysis & Trends in Town of Ellicottville (2026)
Peak Season (February, January, December)
- Revenue averages $5,955 per month
- Occupancy rates average 41.4%
- Daily rates average $453
Shoulder Season
- Revenue averages $3,384 per month
- Occupancy maintains around 30.2%
- Daily rates hold near $384
Low Season (April, May, September)
- Revenue drops to average $2,544 per month
- Occupancy decreases to average 25.6%
- Daily rates adjust to average $357
Seasonality Insights for Town of Ellicottville
- The Airbnb seasonality in Town of Ellicottville shows highly seasonal trends requiring careful strategy. While the sections above show seasonal averages, it's also insightful to look at the extremes:
- During the high season, the absolute peak month showcases Town of Ellicottville's highest earning potential, with monthly revenues capable of climbing to $7,118, occupancy reaching a high of 56.1%, and ADRs peaking at $471.
- Conversely, the slowest single month of the year, typically falling within the low season, marks the market's lowest point. In this month, revenue might dip to $2,410, occupancy could drop to 25.2%, and ADRs may adjust down to $342.
- Understanding both the seasonal averages and these monthly peaks and troughs in revenue, occupancy, and ADR is crucial for maximizing your Airbnb profit potential in Town of Ellicottville.
Seasonal Strategies for Maximizing Profit
- Peak Season: Maximize revenue through premium pricing and potentially longer minimum stays. Ensure high availability.
- Low Season: Offer competitive pricing, special promotions (e.g., extended stay discounts), and flexible cancellation policies. Target off-season travelers like remote workers or budget-conscious guests.
- Shoulder Seasons: Implement dynamic pricing that balances peak and low rates. Target weekend travelers or specific events. Offer slightly more flexible terms than peak season.
- Regularly analyze your own performance against these Town of Ellicottville seasonality benchmarks and adjust your pricing and availability strategy accordingly.
Best Areas for Airbnb Investment in Town of Ellicottville (2026)
Exploring the top neighborhoods for short-term rentals in Town of Ellicottville? This section highlights key areas, outlining why they are attractive for hosts and guests, along with notable local attractions. Consider these locations based on your target guest profile and investment strategy.
| Neighborhood / Area | Why Host Here? (Target Guests & Appeal) | Key Attractions & Landmarks |
|---|---|---|
| Holiday Valley Resort | A popular ski resort known for its slopes and year-round outdoor activities. Ideal for tourists seeking winter sports and summer hikes, making it a prime year-round destination. | Holiday Valley Ski Resort, Sky High Aerial Park, Allegany State Park, Ellicottville Brewing Company, Ellicottville Village Main Street |
| Ellicottville Village | Charming village center filled with shops, restaurants, and local culture. Perfect for visitors looking to explore local attractions and attend community events throughout the year. | Ellicottville Depot Museum, NYS Route 242, The Ellicottville Chamber of Commerce, Local boutiques and art galleries, Food festivals and local events |
| Yukon Adventure Park | An adventure park located in proximity to Ellicottville, offering outdoor fun activities. Attracts adventure seekers and families looking for fun-filled experiences during their stay. | Ziplines, Obstacle courses, Mountain biking trails, Family-friendly activities |
| Coyote Cafe | A trendy place for dining and nightlife in Ellicottville, attracting young adults and families looking for a fun night out and delicious food. | Live music, Outdoor dining, Local craft beers |
| Great Valley | A tranquil area with nature and outdoor activities, appealing to those who love the outdoors and want a peaceful getaway from the busier tourist spots. | Hiking trails, Biking routes, Peaceful natural environments |
| Ellicottville Resort | Offers luxurious accommodations and amenities, attracting those looking for a high-end experience when visiting the area for skiing, hiking, or relaxing retreats. | Spa services, Golf courses, Fine dining, Winter sports |
| Noble Winery | A local winery that's popular for wine tasting tours, appealing to tourists seeking local flavors and a relaxing atmosphere, perfect for romantic getaways. | Wine tastings, Vineyard tours, Scenic views |
| Allegany State Park | A large park nearby offering a wealth of outdoor activities such as hiking, camping, and wildlife watching. Excellent for nature lovers and outdoor enthusiasts. | Hiking trails, Camping sites, Wildlife observation, Fishing spots |
Understanding Airbnb License Requirements & STR Laws in Town of Ellicottville (2026)
While Town of Ellicottville, New York, United States currently shows low STR regulations, specific Airbnb license requirements might still exist or change. Always verify the latest short term rental regulations and Airbnb license requirements directly with local government authorities for Town of Ellicottville to ensure full compliance before hosting.
(Source: AirROI data, 2026, finding no licensed listings among those analyzed)
Top Performing Airbnb Properties in Town of Ellicottville (2026)
Benchmark your potential! Explore examples of top-performing Airbnb properties in Town of Ellicottvillebased on Trailing Twelve Month (TTM) revenue. Analyze their characteristics, revenue, occupancy rate, and ADR to understand what drives success in this market.
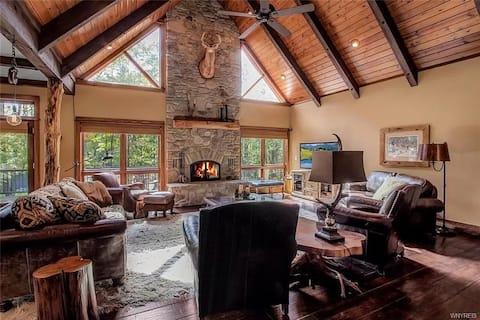
Luxe Chalet! H/tub & A+ Location!
Entire Place • 6 bedrooms
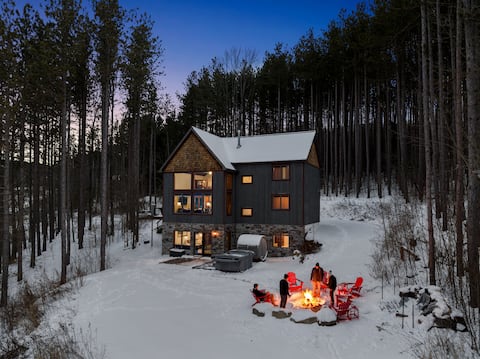
New & Stunning Chalet! Hot Tub, Sauna, Ski Views!
Entire Place • 6 bedrooms
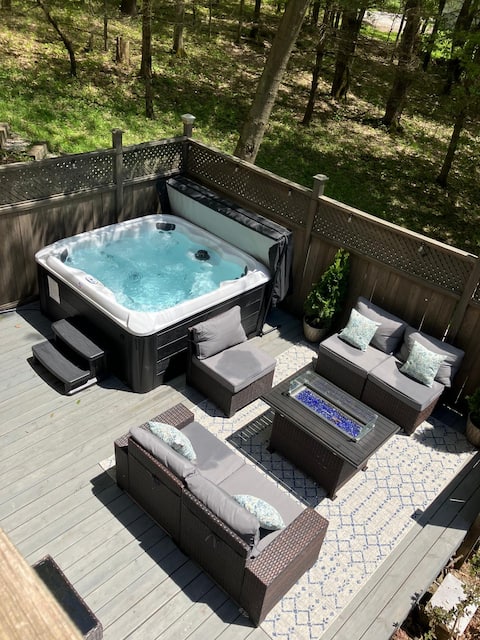
Secluded Getaway | Hot Tub, Sauna, Fire Pit, Gym
Entire Place • 6 bedrooms

Chalet w/ Hot Tub & Sauna Near Holiday Valley
Entire Place • 5 bedrooms

Private Cozy Hideaway w/Hot Tub - Hike from Cabin!
Entire Place • 4 bedrooms

Magnificent Chalet, Sweeping Views and Hot Tub
Entire Place • 4 bedrooms
Note: Performance varies based on location, size, amenities, seasonality, and management quality. Data reflects the past 12 months.
Top Performing Airbnb Hosts in Town of Ellicottville (2026)
Learn from the best! This table showcases top-performing Airbnb hosts in Town of Ellicottville based on the number of properties managed and estimated total revenue over the past year. Analyze their scale and performance metrics.
| Host Name | Properties | Grossing Revenue | Stay Reviews | Avg Rating |
|---|---|---|---|---|
| Dean | 3 | $429,185 | 246 | 4.96/5.0 |
| Michelle | 5 | $365,460 | 181 | 4.93/5.0 |
| EVL Rentals | 5 | $284,656 | 899 | 4.92/5.0 |
| Joseph | 11 | $267,642 | 123 | 4.95/5.0 |
| EVL Rentals | 2 | $258,348 | 131 | 4.99/5.0 |
| Dawn | 14 | $227,140 | 97 | 4.88/5.0 |
| Molly | 4 | $155,751 | 335 | 4.92/5.0 |
| EVL Rentals | 4 | $138,322 | 254 | 4.95/5.0 |
| Elizabeth | 1 | $135,373 | 69 | 4.97/5.0 |
| Anthony V | 4 | $128,502 | 56 | 4.84/5.0 |
Analyzing the strategies of top hosts, such as their property selection, pricing, and guest communication, can offer valuable lessons for optimizing your own Airbnb operations in Town of Ellicottville.
Dive Deeper: Advanced Town of Ellicottville STR Market Data (2026)
Ready to unlock more insights? AirROI provides access to advanced metrics and comprehensive Airbnb data for Town of Ellicottville. Explore detailed analytics beyond this report to refine your investment strategy, optimize pricing, and maximize your vacation rental profits.
Explore Advanced MetricsTown of Ellicottville Short-Term Rental Market Composition (2026): Property & Room Types
Room Type Distribution
Property Type Distribution
Market Composition Insights for Town of Ellicottville
- The Town of Ellicottville Airbnb market composition is heavily skewed towards Entire Home/Apt listings, which make up 96.3% of the 217 active rentals. This indicates strong guest preference for privacy and space.
- Looking at the property type distribution in Town of Ellicottville, House properties are the most common (68.7%), reflecting the local real estate landscape.
- Houses represent a significant 68.7% portion, catering likely to families or larger groups.
- Smaller segments like others, hotel/boutique (combined 6.9%) offer potential for unique stay experiences.
Town of Ellicottville Airbnb Room Capacity Analysis (2026): Bedroom Distribution
Distribution of Listings by Number of Bedrooms
Room Capacity Insights for Town of Ellicottville
- The dominant room capacity in Town of Ellicottville is 3 bedrooms listings, making up 25.3% of the market. This suggests a strong demand for properties suitable for families or small groups.
- Together, 3 bedrooms and 1 bedroom properties represent 47.9% of the active Airbnb listings in Town of Ellicottville, indicating a high concentration in these sizes.
- A significant 61.3% of listings offer 3+ bedrooms, catering to larger groups and families seeking more space in Town of Ellicottville.
Town of Ellicottville Vacation Rental Guest Capacity Trends (2026)
Distribution of Listings by Guest Capacity
Guest Capacity Insights for Town of Ellicottville
- The most common guest capacity trend in Town of Ellicottville vacation rentals is listings accommodating 8+ guests (58.5%). This suggests the primary traveler segment is likely larger groups.
- Properties designed for 8+ guests and 4 guests dominate the Town of Ellicottville STR market, accounting for 75.1% of listings.
- 71.8% of properties accommodate 6+ guests, serving the market segment for larger families or group travel in Town of Ellicottville.
- On average, properties in Town of Ellicottville are equipped to host 6.5 guests.
Town of Ellicottville Airbnb Booking Patterns (2026): Available vs. Booked Days
Available Days Distribution
Booked Days Distribution
Booking Pattern Insights for Town of Ellicottville
- The most common availability pattern in Town of Ellicottville falls within the 271-366 days range, representing 64.5% of listings. This suggests many properties have significant open periods on their calendars.
- Approximately 93.5% of listings show high availability (181+ days open annually), indicating potential for increased bookings or specific owner usage patterns.
- For booked days, the 31-90 days range is most frequent in Town of Ellicottville (50.7%), reflecting common guest stay durations or potential owner blocking patterns.
- A notable 7.9% of properties secure long booking periods (181+ days booked per year), highlighting successful long-term rental strategies or significant owner usage.
Town of Ellicottville Airbnb Minimum Stay Requirements Analysis
Distribution of Listings by Minimum Night Requirement
1 Night
61 listings
28.1% of total
2 Nights
93 listings
42.9% of total
3 Nights
1 listings
0.5% of total
4-6 Nights
2 listings
0.9% of total
7-29 Nights
2 listings
0.9% of total
30+ Nights
58 listings
26.7% of total
Key Insights
- The most prevalent minimum stay requirement in Town of Ellicottville is 2 Nights, adopted by 42.9% of listings. This highlights the market's preference for shorter, flexible bookings.
- A strong majority (71.0%) of the Town of Ellicottville Airbnb data shows acceptance of very short stays (1-2 nights), indicating a dynamic, high-turnover market.
- A significant segment (26.7%) caters to monthly stays (30+ nights) in Town of Ellicottville, pointing to opportunities in the extended-stay market.
Recommendations
- Align with the market by considering a 2 Nights minimum stay, as 42.9% of Town of Ellicottville hosts use this setting.
- If feasible, allowing 1-night stays, especially midweek or during low season, could capture last-minute bookings, as only 28.1% currently do.
- Explore offering discounts for stays of 30+ nights to attract the 26.7% of the market seeking extended stays.
- Adjust minimum nights based on seasonality – potentially shorter during low season and longer during peak demand periods in Town of Ellicottville.
Town of Ellicottville Airbnb Cancellation Policy Trends Analysis (2026)
Limited
5 listings
2.3% of total
Super Strict 30 Days
4 listings
1.9% of total
Super Strict 60 Days
3 listings
1.4% of total
Flexible
18 listings
8.3% of total
Moderate
35 listings
16.2% of total
Firm
117 listings
54.2% of total
Strict
34 listings
15.7% of total
Cancellation Policy Insights for Town of Ellicottville
- The prevailing Airbnb cancellation policy trend in Town of Ellicottville is Firm, used by 54.2% of listings.
- A majority (69.9%) of hosts in Town of Ellicottville utilize Firm or Strict policies, indicating a market where hosts prioritize booking security.
Recommendations for Hosts
- Consider adopting a Firm policy to align with the 54.2% market standard in Town of Ellicottville.
- Regularly review your cancellation policy against competitors and market demand shifts in Town of Ellicottville.
Town of Ellicottville STR Booking Lead Time Analysis (2026)
Average Booking Lead Time by Month
Booking Lead Time Insights for Town of Ellicottville
- The overall average booking lead time for vacation rentals in Town of Ellicottville is 65 days.
- Guests book furthest in advance for stays during October (average 82 days), likely coinciding with peak travel demand or local events.
- The shortest booking windows occur for stays in March (average 46 days), indicating more last-minute travel plans during this time.
- Seasonally, Winter (71 days avg.) sees the longest lead times, while Spring (56 days avg.) has the shortest, reflecting typical travel planning cycles.
Recommendations for Hosts
- Use the overall average lead time (65 days) as a baseline for your pricing and availability strategy in Town of Ellicottville.
- For October stays, consider implementing length-of-stay discounts or slightly higher rates for bookings made less than 82 days out to capitalize on advance planning.
- Target marketing efforts for the Winter season well in advance (at least 71 days) to capture early planners.
- Monitor your own booking lead times against these Town of Ellicottville averages to identify opportunities for dynamic pricing adjustments.
Popular & Essential Airbnb Amenities in Town of Ellicottville (2026)
Amenity Prevalence
Amenity Insights for Town of Ellicottville
- Essential amenities in Town of Ellicottville that guests expect include: Heating, Wifi. Lacking these (any) could significantly impact bookings.
- Popular amenities like Smoke alarm, Free parking on premises, TV are common but not universal. Offering these can provide a competitive edge.
Recommendations for Hosts
- Ensure your listing includes all essential amenities for Town of Ellicottville: Heating, Wifi.
- Prioritize adding missing essentials: Heating, Wifi.
- Consider adding popular differentiators like Smoke alarm or Free parking on premises to increase appeal.
- Highlight unique or less common amenities you offer (e.g., hot tub, dedicated workspace, EV charger) in your listing description and photos.
- Regularly check competitor amenities in Town of Ellicottville to stay competitive.
Town of Ellicottville Airbnb Guest Demographics & Profile Analysis (2026)
Guest Profile Summary for Town of Ellicottville
- The typical guest profile for Airbnb in Town of Ellicottville consists of primarily domestic travelers (92%), often arriving from nearby Buffalo, typically belonging to the Post-2000s (Gen Z/Alpha) group (50%), primarily speaking English or Spanish.
- Domestic travelers account for 91.9% of guests.
- Key international markets include United States (91.9%) and Canada (6.5%).
- Top languages spoken are English (81.8%) followed by Spanish (5.8%).
- A significant demographic segment is the Post-2000s (Gen Z/Alpha) group, representing 50% of guests.
Recommendations for Hosts
- Target domestic marketing efforts towards travelers from Buffalo and Rochester.
- Tailor amenities and listing descriptions to appeal to the dominant Post-2000s (Gen Z/Alpha) demographic (e.g., highlight fast WiFi, smart home features, local guides).
- Highlight unique local experiences or amenities relevant to the primary guest profile.
- Consider seasonal promotions aligned with peak travel times for key origin markets.
Nearby Short-Term Rental Market Comparison
How does the Town of Ellicottville Airbnb market stack up against its neighbors? Compare key performance metrics like average monthly revenue, ADR, and occupancy rates in surrounding areas to understand the broader regional STR landscape.
| Market | Active Properties | Monthly Revenue | Daily Rate | Avg. Occupancy |
|---|---|---|---|---|
| Rushville | 16 | $5,126 | $656.66 | 41% |
| Town of Mansfield | 61 | $4,782 | $517.31 | 32% |
| Town of Porter | 22 | $4,724 | $331.03 | 54% |
| Town of Canandaigua | 79 | $4,714 | $488.12 | 42% |
| Eldred Township | 11 | $4,386 | $482.25 | 38% |
| Town of Pulteney | 66 | $4,252 | $428.50 | 43% |
| Town of Elma | 11 | $3,973 | $445.95 | 44% |
| Pine Creek Township | 10 | $3,889 | $230.94 | 57% |
| Naples | 27 | $3,676 | $464.76 | 40% |
| Town of West Seneca | 19 | $3,674 | $277.29 | 47% |