Town of Davenport Airbnb Market Analysis 2026: Short Term Rental Data & Vacation Rental Statistics in New York, United States
Is Airbnb profitable in Town of Davenport in 2026? Explore comprehensive Airbnb analytics for Town of Davenport, New York, United States to uncover income potential. This 2026 STR market report for Town of Davenport, based on AirROI data from February 2025 to January 2026, reveals key trends in the niche market of 41 active listings.
Whether you're considering an Airbnb investment in Town of Davenport, optimizing your existing vacation rental, or exploring rental arbitrage opportunities, understanding the Town of Davenport Airbnb data is crucial. Leveraging the low regulation environment is key to maximizing your short term rental income potential. Let's dive into the specifics.
Key Town of Davenport Airbnb Performance Metrics Overview
Monthly Airbnb Revenue Variations & Income Potential in Town of Davenport (2026)
Understanding the monthly revenue variations for Airbnb listings in Town of Davenport is key to maximizing your short term rental income potential. Seasonality significantly impacts earnings. Our analysis, based on data from the past 12 months, shows that the peak revenue month for STRs in Town of Davenport is typically July, while February often presents the lowest earnings, highlighting opportunities for strategic pricing adjustments during shoulder and low seasons. Explore the typical Airbnb income in Town of Davenport across different performance tiers:
- Best-in-class properties (Top 10%) achieve $8,613+ monthly, often utilizing dynamic pricing and superior guest experiences.
- Strong performing properties (Top 25%) earn $5,254 or more, indicating effective management and desirable locations/amenities.
- Typical properties (Median) generate around $2,792 per month, representing the average market performance.
- Entry-level properties (Bottom 25%) see earnings around $948, often with potential for optimization.
Average Monthly Airbnb Earnings Trend in Town of Davenport
Town of Davenport Airbnb Occupancy Rate Trends (2026)
Maximize your bookings by understanding the Town of Davenport STR occupancy trends. Seasonal demand shifts significantly influence how often properties are booked. Typically, Julysees the highest demand (peak season occupancy), while February experiences the lowest (low season). Effective strategies, like adjusting minimum stays or offering promotions, can boost occupancy during slower periods. Here's how different property tiers perform in Town of Davenport:
- Best-in-class properties (Top 10%) achieve 85%+ occupancy, indicating high desirability and potentially optimized availability.
- Strong performing properties (Top 25%) maintain 59% or higher occupancy, suggesting good market fit and guest satisfaction.
- Typical properties (Median) have an occupancy rate around 35%.
- Entry-level properties (Bottom 25%) average 16% occupancy, potentially facing higher vacancy.
Average Monthly Occupancy Rate Trend in Town of Davenport
Average Daily Rate (ADR) Airbnb Trends in Town of Davenport (2026)
Effective short term rental pricing strategy in Town of Davenport involves understanding monthly ADR fluctuations. The Average Daily Rate (ADR) for Airbnb in Town of Davenport typically peaks in June and dips lowest during January. Leveraging Airbnb dynamic pricing tools or strategies based on this seasonality can significantly boost revenue. Here's a look at the typical nightly rates achieved:
- Best-in-class properties (Top 10%) command rates of $498+ per night, often due to premium features or locations.
- Strong performing properties (Top 25%) achieve nightly rates of $343 or more.
- Typical properties (Median) charge around $230 per night.
- Entry-level properties (Bottom 25%) earn around $114 per night.
Average Daily Rate (ADR) Trend by Month in Town of Davenport
Get Live Town of Davenport Market Intelligence 👇

Explore Real-time Analytics
Airbnb Seasonality Analysis & Trends in Town of Davenport (2026)
Peak Season (July, June, August)
- Revenue averages $5,840 per month
- Occupancy rates average 54.3%
- Daily rates average $281
Shoulder Season
- Revenue averages $3,777 per month
- Occupancy maintains around 38.9%
- Daily rates hold near $258
Low Season (February, March, October)
- Revenue drops to average $2,438 per month
- Occupancy decreases to average 29.3%
- Daily rates adjust to average $260
Seasonality Insights for Town of Davenport
- The Airbnb seasonality in Town of Davenport shows highly seasonal trends requiring careful strategy. While the sections above show seasonal averages, it's also insightful to look at the extremes:
- During the high season, the absolute peak month showcases Town of Davenport's highest earning potential, with monthly revenues capable of climbing to $6,535, occupancy reaching a high of 58.3%, and ADRs peaking at $284.
- Conversely, the slowest single month of the year, typically falling within the low season, marks the market's lowest point. In this month, revenue might dip to $1,793, occupancy could drop to 23.4%, and ADRs may adjust down to $249.
- Understanding both the seasonal averages and these monthly peaks and troughs in revenue, occupancy, and ADR is crucial for maximizing your Airbnb profit potential in Town of Davenport.
Seasonal Strategies for Maximizing Profit
- Peak Season: Maximize revenue through premium pricing and potentially longer minimum stays. Ensure high availability.
- Low Season: Offer competitive pricing, special promotions (e.g., extended stay discounts), and flexible cancellation policies. Target off-season travelers like remote workers or budget-conscious guests.
- Shoulder Seasons: Implement dynamic pricing that balances peak and low rates. Target weekend travelers or specific events. Offer slightly more flexible terms than peak season.
- Regularly analyze your own performance against these Town of Davenport seasonality benchmarks and adjust your pricing and availability strategy accordingly.
Best Areas for Airbnb Investment in Town of Davenport (2026)
Exploring the top neighborhoods for short-term rentals in Town of Davenport? This section highlights key areas, outlining why they are attractive for hosts and guests, along with notable local attractions. Consider these locations based on your target guest profile and investment strategy.
| Neighborhood / Area | Why Host Here? (Target Guests & Appeal) | Key Attractions & Landmarks |
|---|---|---|
| Lake Harmony | A beautiful lakeside community known for its recreational activities like boating, fishing, and hiking, appealing to families and outdoor enthusiasts. | Lake Harmony, Big Boulder Lake, Poconos Mountain Resort, Hickory Run State Park, Boulder View Tavern |
| Davenport Center | The central hub of Davenport, offering a quaint small-town atmosphere with easy access to local amenities and attractions, perfect for travelers seeking tranquility. | Davenport Town Park, Local diners, Antique shops, Nearby hiking trails, Seasonal farmer's market |
| Thornton | Known for its unique charm and proximity to the scenic landscapes, Thornton offers a peaceful escape with access to various outdoor recreational activities. | Hudson River, Jasper Park, Local wineries, Biking trails, Fishing spots |
| Pine Ridge | A desirable neighborhood featuring modern amenities and a friendly community, ideal for both weekend getaways and longer stays. | Local shops, Pine Ridge Park, Community events, Scenic views, Nature trails |
| Stormville | A quaint town surrounded by nature, known for its work-life balance, making it appealing for those seeking leisure and adventure away from the city. | Stormville Airport Antique Shows, Local farms, Hiking trails, Scenic picnic spots, Nearby golf courses |
| Greene Lake | Offers serene views and a community-oriented atmosphere, perfect for nature lovers looking for a peaceful getaway. | Greene Lake, Hiking paths, Wildlife watching, Quiet picnic areas, Water activities |
| Brevard | An up-and-coming area attracting visitors for its natural beauty and recreational opportunities, promising a growing market for short-term rentals. | Brevard County Parks, Mountain biking trails, Scenic overlooks, Local dining options, Artisan shops |
| Woodridge | A friendly residential area that offers a nice blend of countryside charm and convenience, appealing to families and vacationers alike. | Local parks, Nature trails, Community events, Historic sites, Farmers markets |
Understanding Airbnb License Requirements & STR Laws in Town of Davenport (2026)
While Town of Davenport, New York, United States currently shows low STR regulations, specific Airbnb license requirements might still exist or change. Always verify the latest short term rental regulations and Airbnb license requirements directly with local government authorities for Town of Davenport to ensure full compliance before hosting.
(Source: AirROI data, 2026, finding no licensed listings among those analyzed)
Top Performing Airbnb Properties in Town of Davenport (2026)
Benchmark your potential! Explore examples of top-performing Airbnb properties in Town of Davenportbased on Trailing Twelve Month (TTM) revenue. Analyze their characteristics, revenue, occupancy rate, and ADR to understand what drives success in this market.
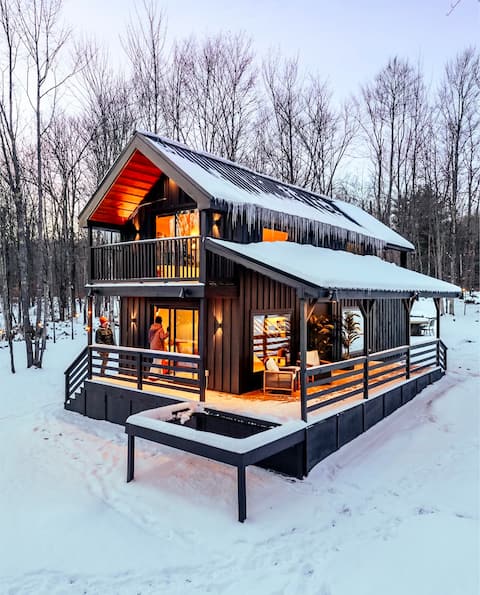
Romantic luxe chalet · sauna + hot tub
Entire Place • 1 bedroom
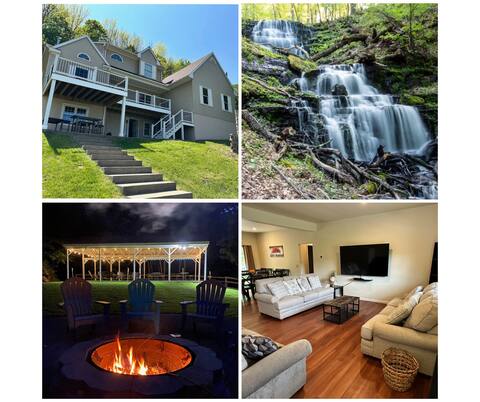
GameRm-Waterfall w/Deck-Slp28-FirePit-PavilionVIEW
Entire Place • 8 bedrooms
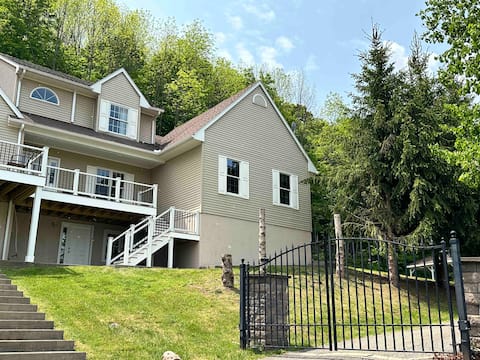
GameRm-Waterfall&Deck-Slp19-FirePit-View-Pavilion
Entire Place • 5 bedrooms

Augusta Woods - In-ground pool, peaceful setting,
Entire Place • 2 bedrooms

Zen Hideaway
Entire Place • 3 bedrooms

Wood Chip Station
Entire Place • 5 bedrooms
Note: Performance varies based on location, size, amenities, seasonality, and management quality. Data reflects the past 12 months.
Top Performing Airbnb Hosts in Town of Davenport (2026)
Learn from the best! This table showcases top-performing Airbnb hosts in Town of Davenport based on the number of properties managed and estimated total revenue over the past year. Analyze their scale and performance metrics.
| Host Name | Properties | Grossing Revenue | Stay Reviews | Avg Rating |
|---|---|---|---|---|
| Shirley | 3 | $254,856 | 119 | 4.97/5.0 |
| Joel | 1 | $144,213 | 85 | 4.95/5.0 |
| Jennifer | 3 | $127,962 | 169 | 4.99/5.0 |
| Cooperstown Stay | 2 | $99,421 | 4 | Not Rated |
| Tammy | 2 | $72,615 | 99 | 4.95/5.0 |
| Melissa | 1 | $69,689 | 30 | 4.80/5.0 |
| Cadillac Ranch | 2 | $58,211 | 98 | 4.92/5.0 |
| Chris | 1 | $56,357 | 29 | 4.97/5.0 |
| Alyssa | 1 | $55,305 | 277 | 4.99/5.0 |
| The Oney House | 1 | $50,417 | 25 | 4.96/5.0 |
Analyzing the strategies of top hosts, such as their property selection, pricing, and guest communication, can offer valuable lessons for optimizing your own Airbnb operations in Town of Davenport.
Dive Deeper: Advanced Town of Davenport STR Market Data (2026)
Ready to unlock more insights? AirROI provides access to advanced metrics and comprehensive Airbnb data for Town of Davenport. Explore detailed analytics beyond this report to refine your investment strategy, optimize pricing, and maximize your vacation rental profits.
Explore Advanced MetricsTown of Davenport Short-Term Rental Market Composition (2026): Property & Room Types
Room Type Distribution
Property Type Distribution
Market Composition Insights for Town of Davenport
- The Town of Davenport Airbnb market composition is heavily skewed towards Entire Home/Apt listings, which make up 87.8% of the 41 active rentals. This indicates strong guest preference for privacy and space.
- Looking at the property type distribution in Town of Davenport, Outdoor/Unique properties are the most common (43.9%), reflecting the local real estate landscape.
- Houses represent a significant 34.1% portion, catering likely to families or larger groups.
- The presence of 7.3% Hotel/Boutique listings indicates integration with traditional hospitality.
- Smaller segments like apartment/condo (combined 2.4%) offer potential for unique stay experiences.
Town of Davenport Airbnb Room Capacity Analysis (2026): Bedroom Distribution
Distribution of Listings by Number of Bedrooms
Room Capacity Insights for Town of Davenport
- The dominant room capacity in Town of Davenport is 1 bedroom listings, making up 34.1% of the market. This suggests a strong demand for properties suitable for couples or solo travelers.
- Together, 1 bedroom and 3 bedrooms properties represent 58.5% of the active Airbnb listings in Town of Davenport, indicating a high concentration in these sizes.
- A significant 39.0% of listings offer 3+ bedrooms, catering to larger groups and families seeking more space in Town of Davenport.
Town of Davenport Vacation Rental Guest Capacity Trends (2026)
Distribution of Listings by Guest Capacity
Guest Capacity Insights for Town of Davenport
- The most common guest capacity trend in Town of Davenport vacation rentals is listings accommodating 8+ guests (26.8%). This suggests the primary traveler segment is likely larger groups.
- Properties designed for 8+ guests and 6 guests dominate the Town of Davenport STR market, accounting for 43.9% of listings.
- 48.8% of properties accommodate 6+ guests, serving the market segment for larger families or group travel in Town of Davenport.
- On average, properties in Town of Davenport are equipped to host 5.0 guests.
Town of Davenport Airbnb Booking Patterns (2026): Available vs. Booked Days
Available Days Distribution
Booked Days Distribution
Booking Pattern Insights for Town of Davenport
- The most common availability pattern in Town of Davenport falls within the 181-270 days range, representing 51.2% of listings. This suggests many properties have significant open periods on their calendars.
- Approximately 95.1% of listings show high availability (181+ days open annually), indicating potential for increased bookings or specific owner usage patterns.
- For booked days, the 91-180 days range is most frequent in Town of Davenport (51.2%), reflecting common guest stay durations or potential owner blocking patterns.
- A notable 4.9% of properties secure long booking periods (181+ days booked per year), highlighting successful long-term rental strategies or significant owner usage.
Town of Davenport Airbnb Minimum Stay Requirements Analysis
Distribution of Listings by Minimum Night Requirement
1 Night
16 listings
39% of total
2 Nights
8 listings
19.5% of total
4-6 Nights
3 listings
7.3% of total
30+ Nights
14 listings
34.1% of total
Key Insights
- The most prevalent minimum stay requirement in Town of Davenport is 1 Night, adopted by 39% of listings. This highlights the market's preference for shorter, flexible bookings.
- A significant segment (34.1%) caters to monthly stays (30+ nights) in Town of Davenport, pointing to opportunities in the extended-stay market.
Recommendations
- Align with the market by considering a 1 Night minimum stay, as 39% of Town of Davenport hosts use this setting.
- Explore offering discounts for stays of 30+ nights to attract the 34.1% of the market seeking extended stays.
- Adjust minimum nights based on seasonality – potentially shorter during low season and longer during peak demand periods in Town of Davenport.
Town of Davenport Airbnb Cancellation Policy Trends Analysis (2026)
Super Strict 30 Days
2 listings
4.9% of total
Flexible
4 listings
9.8% of total
Moderate
13 listings
31.7% of total
Firm
18 listings
43.9% of total
Strict
4 listings
9.8% of total
Cancellation Policy Insights for Town of Davenport
- The prevailing Airbnb cancellation policy trend in Town of Davenport is Firm, used by 43.9% of listings.
- A majority (53.7%) of hosts in Town of Davenport utilize Firm or Strict policies, indicating a market where hosts prioritize booking security.
- Strict cancellation policies are quite rare (9.8%), potentially making listings with this policy less competitive unless justified by high demand or property type.
Recommendations for Hosts
- Consider adopting a Firm policy to align with the 43.9% market standard in Town of Davenport.
- Using a Strict policy might deter some guests, as only 9.8% of listings use it. Evaluate if potential revenue protection outweighs possible lower booking rates.
- Regularly review your cancellation policy against competitors and market demand shifts in Town of Davenport.
Town of Davenport STR Booking Lead Time Analysis (2026)
Average Booking Lead Time by Month
Booking Lead Time Insights for Town of Davenport
- The overall average booking lead time for vacation rentals in Town of Davenport is 68 days.
- Guests book furthest in advance for stays during July (average 125 days), likely coinciding with peak travel demand or local events.
- The shortest booking windows occur for stays in March (average 13 days), indicating more last-minute travel plans during this time.
- Seasonally, Summer (112 days avg.) sees the longest lead times, while Winter (32 days avg.) has the shortest, reflecting typical travel planning cycles.
Recommendations for Hosts
- Use the overall average lead time (68 days) as a baseline for your pricing and availability strategy in Town of Davenport.
- For July stays, consider implementing length-of-stay discounts or slightly higher rates for bookings made less than 125 days out to capitalize on advance planning.
- During March, focus on last-minute booking availability and promotions, as guests book with very short notice (13 days avg.).
- Target marketing efforts for the Summer season well in advance (at least 112 days) to capture early planners.
- Monitor your own booking lead times against these Town of Davenport averages to identify opportunities for dynamic pricing adjustments.
Popular & Essential Airbnb Amenities in Town of Davenport (2026)
Amenity Prevalence
Amenity Insights for Town of Davenport
- Essential amenities in Town of Davenport that guests expect include: Free parking on premises. Lacking these (this) could significantly impact bookings.
- Popular amenities like Heating, Fire extinguisher, Wifi are common but not universal. Offering these can provide a competitive edge.
- Warning: Wifi is not universally provided but is considered essential globally. Ensure reliable Wifi is offered.
Recommendations for Hosts
- Ensure your listing includes all essential amenities for Town of Davenport: Free parking on premises.
- Prioritize adding missing essentials: Free parking on premises.
- Consider adding popular differentiators like Heating or Fire extinguisher to increase appeal.
- Highlight unique or less common amenities you offer (e.g., hot tub, dedicated workspace, EV charger) in your listing description and photos.
- Regularly check competitor amenities in Town of Davenport to stay competitive.
Town of Davenport Airbnb Guest Demographics & Profile Analysis (2026)
Guest Profile Summary for Town of Davenport
- The typical guest profile for Airbnb in Town of Davenport consists of primarily domestic travelers (96%), often arriving from nearby New York, typically belonging to the Post-2000s (Gen Z/Alpha) group (50%), primarily speaking English or Spanish.
- Domestic travelers account for 95.9% of guests.
- Key international markets include United States (95.9%) and Switzerland (0.7%).
- Top languages spoken are English (68.6%) followed by Spanish (14.3%).
- A significant demographic segment is the Post-2000s (Gen Z/Alpha) group, representing 50% of guests.
Recommendations for Hosts
- Target domestic marketing efforts towards travelers from New York and Jersey City.
- Tailor amenities and listing descriptions to appeal to the dominant Post-2000s (Gen Z/Alpha) demographic (e.g., highlight fast WiFi, smart home features, local guides).
- Highlight unique local experiences or amenities relevant to the primary guest profile.
- Consider seasonal promotions aligned with peak travel times for key origin markets.
Nearby Short-Term Rental Market Comparison
How does the Town of Davenport Airbnb market stack up against its neighbors? Compare key performance metrics like average monthly revenue, ADR, and occupancy rates in surrounding areas to understand the broader regional STR landscape.
| Market | Active Properties | Monthly Revenue | Daily Rate | Avg. Occupancy |
|---|---|---|---|---|
| Freeland | 11 | $8,436 | $684.29 | 42% |
| Town of Trenton | 13 | $7,410 | $484.59 | 43% |
| Berlin Township | 15 | $7,208 | $729.10 | 35% |
| Middletown Springs | 13 | $6,843 | $507.55 | 32% |
| Town of Kingston | 10 | $6,470 | $473.76 | 49% |
| Frankford Township | 11 | $6,329 | $505.19 | 41% |
| Fort Ann | 35 | $6,238 | $790.41 | 37% |
| Stroud Township | 137 | $5,728 | $478.40 | 40% |
| Town of Monroe | 22 | $5,690 | $720.52 | 37% |
| Town of Ancram | 22 | $5,616 | $512.55 | 38% |