Town of Clinton Airbnb Market Analysis 2026: Short Term Rental Data & Vacation Rental Statistics in New York, United States
Is Airbnb profitable in Town of Clinton in 2026? Explore comprehensive Airbnb analytics for Town of Clinton, New York, United States to uncover income potential. This 2026 STR market report for Town of Clinton, based on AirROI data from February 2025 to January 2026, reveals key trends in the niche market of 46 active listings.
Whether you're considering an Airbnb investment in Town of Clinton, optimizing your existing vacation rental, or exploring rental arbitrage opportunities, understanding the Town of Clinton Airbnb data is crucial. Leveraging the low regulation environment is key to maximizing your short term rental income potential. Let's dive into the specifics.
Key Town of Clinton Airbnb Performance Metrics Overview
Monthly Airbnb Revenue Variations & Income Potential in Town of Clinton (2026)
Understanding the monthly revenue variations for Airbnb listings in Town of Clinton is key to maximizing your short term rental income potential. Seasonality significantly impacts earnings. Our analysis, based on data from the past 12 months, shows that the peak revenue month for STRs in Town of Clinton is typically August, while February often presents the lowest earnings, highlighting opportunities for strategic pricing adjustments during shoulder and low seasons. Explore the typical Airbnb income in Town of Clinton across different performance tiers:
- Best-in-class properties (Top 10%) achieve $10,788+ monthly, often utilizing dynamic pricing and superior guest experiences.
- Strong performing properties (Top 25%) earn $6,851 or more, indicating effective management and desirable locations/amenities.
- Typical properties (Median) generate around $3,893 per month, representing the average market performance.
- Entry-level properties (Bottom 25%) see earnings around $1,401, often with potential for optimization.
Average Monthly Airbnb Earnings Trend in Town of Clinton
Town of Clinton Airbnb Occupancy Rate Trends (2026)
Maximize your bookings by understanding the Town of Clinton STR occupancy trends. Seasonal demand shifts significantly influence how often properties are booked. Typically, Julysees the highest demand (peak season occupancy), while January experiences the lowest (low season). Effective strategies, like adjusting minimum stays or offering promotions, can boost occupancy during slower periods. Here's how different property tiers perform in Town of Clinton:
- Best-in-class properties (Top 10%) achieve 76%+ occupancy, indicating high desirability and potentially optimized availability.
- Strong performing properties (Top 25%) maintain 60% or higher occupancy, suggesting good market fit and guest satisfaction.
- Typical properties (Median) have an occupancy rate around 37%.
- Entry-level properties (Bottom 25%) average 21% occupancy, potentially facing higher vacancy.
Average Monthly Occupancy Rate Trend in Town of Clinton
Average Daily Rate (ADR) Airbnb Trends in Town of Clinton (2026)
Effective short term rental pricing strategy in Town of Clinton involves understanding monthly ADR fluctuations. The Average Daily Rate (ADR) for Airbnb in Town of Clinton typically peaks in August and dips lowest during March. Leveraging Airbnb dynamic pricing tools or strategies based on this seasonality can significantly boost revenue. Here's a look at the typical nightly rates achieved:
- Best-in-class properties (Top 10%) command rates of $778+ per night, often due to premium features or locations.
- Strong performing properties (Top 25%) achieve nightly rates of $544 or more.
- Typical properties (Median) charge around $280 per night.
- Entry-level properties (Bottom 25%) earn around $181 per night.
Average Daily Rate (ADR) Trend by Month in Town of Clinton
Get Live Town of Clinton Market Intelligence 👇

Explore Real-time Analytics
Airbnb Seasonality Analysis & Trends in Town of Clinton (2026)
Peak Season (August, July, October)
- Revenue averages $7,240 per month
- Occupancy rates average 52.3%
- Daily rates average $394
Shoulder Season
- Revenue averages $4,640 per month
- Occupancy maintains around 40.4%
- Daily rates hold near $375
Low Season (January, February, April)
- Revenue drops to average $2,932 per month
- Occupancy decreases to average 28.8%
- Daily rates adjust to average $360
Seasonality Insights for Town of Clinton
- The Airbnb seasonality in Town of Clinton shows highly seasonal trends requiring careful strategy. While the sections above show seasonal averages, it's also insightful to look at the extremes:
- During the high season, the absolute peak month showcases Town of Clinton's highest earning potential, with monthly revenues capable of climbing to $8,347, occupancy reaching a high of 55.9%, and ADRs peaking at $404.
- Conversely, the slowest single month of the year, typically falling within the low season, marks the market's lowest point. In this month, revenue might dip to $2,619, occupancy could drop to 24.6%, and ADRs may adjust down to $351.
- Understanding both the seasonal averages and these monthly peaks and troughs in revenue, occupancy, and ADR is crucial for maximizing your Airbnb profit potential in Town of Clinton.
Seasonal Strategies for Maximizing Profit
- Peak Season: Maximize revenue through premium pricing and potentially longer minimum stays. Ensure high availability.
- Low Season: Offer competitive pricing, special promotions (e.g., extended stay discounts), and flexible cancellation policies. Target off-season travelers like remote workers or budget-conscious guests.
- Shoulder Seasons: Implement dynamic pricing that balances peak and low rates. Target weekend travelers or specific events. Offer slightly more flexible terms than peak season.
- Regularly analyze your own performance against these Town of Clinton seasonality benchmarks and adjust your pricing and availability strategy accordingly.
Best Areas for Airbnb Investment in Town of Clinton (2026)
Exploring the top neighborhoods for short-term rentals in Town of Clinton? This section highlights key areas, outlining why they are attractive for hosts and guests, along with notable local attractions. Consider these locations based on your target guest profile and investment strategy.
| Neighborhood / Area | Why Host Here? (Target Guests & Appeal) | Key Attractions & Landmarks |
|---|---|---|
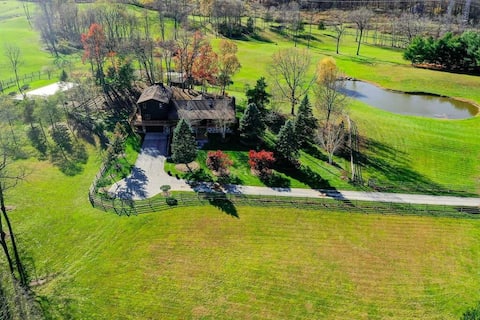
| Clinton Corners | Charming small town vibe with scenic landscapes and easy access to the Hudson River. Attractive for visitors seeking peace, nature, and local farms. | Staatsburgh State Historic Site, Olana State Historic Site, Culinary Institute of America, Walkway Over the Hudson, Tivoli Bays Wildlife Management Area |
| Lake Taghkanic State Park | A picturesque park ideal for outdoor enthusiasts. Popular for those looking to enjoy nature, hiking, and water activities in a serene environment. | Lake Taghkanic, Picnicking areas, Hiking trails, Fishing spots, Nature trails |
| Red Hook | Quaint nearby village with local shops and eateries. Draws visitors interested in a vibrant community atmosphere and local events. | Red Hook Village Park, Red Hook Farmers Market, Bard College, Old Rhinebeck Aerodrome, Sampson Park |
| Rhinebeck | Historic town known for its charming downtown area and cultural events. Ideal for tourists seeking a historic and cozy atmosphere. | Empire State Railway Museum, Rhinebeck Farmers Market, The Dutchess County Fairgrounds, The Rhinebeck Theater, Ferncliff Forest |
| Sawkill | An area with a picturesque backdrop, offering a mix of rural charm and local history. Suitable for guests wanting to experience the beauty of the Hudson Valley. | Sawkill Creek, Local wineries, Historic sites, Hiking trails, Farmers markets |
| Klyne Esopus Museum | Unique museum that showcases local history and culture. Attracts visitors interested in learning about the area’s rich past. | Klyne Esopus Museum, Historical exhibits, Local art displays, Nature trails, Community events |
| Lighthouse Park | Located along the Hudson River with stunning views. Perfect for those looking to relax by the water and enjoy recreational activities. | Views of Hudson River, Walking trails, Fishing areas, Picnic spots, Cycling paths |
| Germantown | A small town with rich history and proximity to farmland. Exceptional for visitors wanting to explore quaint shops and farm-to-table dining. | Germantown Exchange, Local wineries, Art galleries, Historic homes, Outdoor markets |
Understanding Airbnb License Requirements & STR Laws in Town of Clinton (2026)
While Town of Clinton, New York, United States currently shows low STR regulations, specific Airbnb license requirements might still exist or change. Always verify the latest short term rental regulations and Airbnb license requirements directly with local government authorities for Town of Clinton to ensure full compliance before hosting.
(Source: AirROI data, 2026, finding no licensed listings among those analyzed)
Top Performing Airbnb Properties in Town of Clinton (2026)
Benchmark your potential! Explore examples of top-performing Airbnb properties in Town of Clintonbased on Trailing Twelve Month (TTM) revenue. Analyze their characteristics, revenue, occupancy rate, and ADR to understand what drives success in this market.
Cozy Cabin w/ Heated Pool, Hot Tub and Open Fields
Entire Place • 5 bedrooms
High Meadows | Modern Farmhouse, Pool, 13 acres
Entire Place • 3 bedrooms

Rhinebeck Country Living with a Modern Twist
Entire Place • 3 bedrooms

Long Pond Cottage, Country Retreat in Rhinebeck
Entire Place • 2 bedrooms

Lake House with outdoor Hot Tub
Entire Place • 2 bedrooms
Riverfront rustic farmhouse near Rhinebeck
Entire Place • 4 bedrooms
Note: Performance varies based on location, size, amenities, seasonality, and management quality. Data reflects the past 12 months.
Top Performing Airbnb Hosts in Town of Clinton (2026)
Learn from the best! This table showcases top-performing Airbnb hosts in Town of Clinton based on the number of properties managed and estimated total revenue over the past year. Analyze their scale and performance metrics.
| Host Name | Properties | Grossing Revenue | Stay Reviews | Avg Rating |
|---|---|---|---|---|
| Wes | 1 | $189,948 | 84 | 4.96/5.0 |
| Allis | 1 | $122,090 | 52 | 4.98/5.0 |
| Beto And Scott | 1 | $115,820 | 83 | 5.00/5.0 |
| Rick | 2 | $114,625 | 745 | 4.90/5.0 |
| Catherine | 1 | $106,273 | 177 | 4.98/5.0 |
| Lorenzo | 1 | $106,128 | 87 | 4.89/5.0 |
| Rachel | 1 | $94,305 | 86 | 4.92/5.0 |
| Anthony | 1 | $93,212 | 94 | 4.84/5.0 |
| Cristina | 1 | $77,865 | 34 | 5.00/5.0 |
| Evan | 1 | $74,968 | 102 | 4.86/5.0 |
Analyzing the strategies of top hosts, such as their property selection, pricing, and guest communication, can offer valuable lessons for optimizing your own Airbnb operations in Town of Clinton.
Dive Deeper: Advanced Town of Clinton STR Market Data (2026)
Ready to unlock more insights? AirROI provides access to advanced metrics and comprehensive Airbnb data for Town of Clinton. Explore detailed analytics beyond this report to refine your investment strategy, optimize pricing, and maximize your vacation rental profits.
Explore Advanced MetricsTown of Clinton Short-Term Rental Market Composition (2026): Property & Room Types
Room Type Distribution
Property Type Distribution
Market Composition Insights for Town of Clinton
- The Town of Clinton Airbnb market composition is heavily skewed towards Entire Home/Apt listings, which make up 82.6% of the 46 active rentals. This indicates strong guest preference for privacy and space.
- Looking at the property type distribution in Town of Clinton, House properties are the most common (82.6%), reflecting the local real estate landscape.
- Houses represent a significant 82.6% portion, catering likely to families or larger groups.
- Smaller segments like hotel/boutique, apartment/condo, others (combined 8.7%) offer potential for unique stay experiences.
Town of Clinton Airbnb Room Capacity Analysis (2026): Bedroom Distribution
Distribution of Listings by Number of Bedrooms
Room Capacity Insights for Town of Clinton
- The dominant room capacity in Town of Clinton is 3 bedrooms listings, making up 30.4% of the market. This suggests a strong demand for properties suitable for families or small groups.
- Together, 3 bedrooms and 2 bedrooms properties represent 52.1% of the active Airbnb listings in Town of Clinton, indicating a high concentration in these sizes.
- A significant 43.5% of listings offer 3+ bedrooms, catering to larger groups and families seeking more space in Town of Clinton.
Town of Clinton Vacation Rental Guest Capacity Trends (2026)
Distribution of Listings by Guest Capacity
Guest Capacity Insights for Town of Clinton
- The most common guest capacity trend in Town of Clinton vacation rentals is listings accommodating 6 guests (32.6%). This suggests the primary traveler segment is likely larger groups.
- Properties designed for 6 guests and 5 guests dominate the Town of Clinton STR market, accounting for 50.0% of listings.
- 43.5% of properties accommodate 6+ guests, serving the market segment for larger families or group travel in Town of Clinton.
- On average, properties in Town of Clinton are equipped to host 4.4 guests.
Town of Clinton Airbnb Booking Patterns (2026): Available vs. Booked Days
Available Days Distribution
Booked Days Distribution
Booking Pattern Insights for Town of Clinton
- The most common availability pattern in Town of Clinton falls within the 271-366 days range, representing 52.2% of listings. This suggests many properties have significant open periods on their calendars.
- Approximately 82.6% of listings show high availability (181+ days open annually), indicating potential for increased bookings or specific owner usage patterns.
- For booked days, the 31-90 days range is most frequent in Town of Clinton (39.1%), reflecting common guest stay durations or potential owner blocking patterns.
- A notable 17.3% of properties secure long booking periods (181+ days booked per year), highlighting successful long-term rental strategies or significant owner usage.
Town of Clinton Airbnb Minimum Stay Requirements Analysis
Distribution of Listings by Minimum Night Requirement
1 Night
12 listings
26.1% of total
2 Nights
7 listings
15.2% of total
3 Nights
6 listings
13% of total
4-6 Nights
2 listings
4.3% of total
7-29 Nights
4 listings
8.7% of total
30+ Nights
15 listings
32.6% of total
Key Insights
- The most prevalent minimum stay requirement in Town of Clinton is 30+ Nights, adopted by 32.6% of listings. This highlights the market's preference for longer commitments.
- A significant segment (32.6%) caters to monthly stays (30+ nights) in Town of Clinton, pointing to opportunities in the extended-stay market.
Recommendations
- Align with the market by considering a 30+ Nights minimum stay, as 32.6% of Town of Clinton hosts use this setting.
- If feasible, allowing 1-night stays, especially midweek or during low season, could capture last-minute bookings, as only 26.1% currently do.
- Explore offering discounts for stays of 30+ nights to attract the 32.6% of the market seeking extended stays.
- Adjust minimum nights based on seasonality – potentially shorter during low season and longer during peak demand periods in Town of Clinton.
Town of Clinton Airbnb Cancellation Policy Trends Analysis (2026)
Super Strict 30 Days
1 listings
2.2% of total
Flexible
5 listings
10.9% of total
Moderate
18 listings
39.1% of total
Firm
20 listings
43.5% of total
Strict
2 listings
4.3% of total
Cancellation Policy Insights for Town of Clinton
- The prevailing Airbnb cancellation policy trend in Town of Clinton is Firm, used by 43.5% of listings.
- There's a relatively balanced mix between guest-friendly (50.0%) and stricter (47.8%) policies, offering choices for different guest needs.
- Strict cancellation policies are quite rare (4.3%), potentially making listings with this policy less competitive unless justified by high demand or property type.
Recommendations for Hosts
- Consider adopting a Firm policy to align with the 43.5% market standard in Town of Clinton.
- Using a Strict policy might deter some guests, as only 4.3% of listings use it. Evaluate if potential revenue protection outweighs possible lower booking rates.
- Regularly review your cancellation policy against competitors and market demand shifts in Town of Clinton.
Town of Clinton STR Booking Lead Time Analysis (2026)
Average Booking Lead Time by Month
Booking Lead Time Insights for Town of Clinton
- The overall average booking lead time for vacation rentals in Town of Clinton is 69 days.
- Guests book furthest in advance for stays during October (average 119 days), likely coinciding with peak travel demand or local events.
- The shortest booking windows occur for stays in February (average 25 days), indicating more last-minute travel plans during this time.
- Seasonally, Fall (95 days avg.) sees the longest lead times, while Winter (36 days avg.) has the shortest, reflecting typical travel planning cycles.
Recommendations for Hosts
- Use the overall average lead time (69 days) as a baseline for your pricing and availability strategy in Town of Clinton.
- For October stays, consider implementing length-of-stay discounts or slightly higher rates for bookings made less than 119 days out to capitalize on advance planning.
- Target marketing efforts for the Fall season well in advance (at least 95 days) to capture early planners.
- Monitor your own booking lead times against these Town of Clinton averages to identify opportunities for dynamic pricing adjustments.
Popular & Essential Airbnb Amenities in Town of Clinton (2026)
Amenity Prevalence
Amenity Insights for Town of Clinton
- Essential amenities in Town of Clinton that guests expect include: Wifi, Free parking on premises, Smoke alarm, Carbon monoxide alarm, Air conditioning, Heating. Lacking these (any) could significantly impact bookings.
- Popular amenities like Hair dryer, Fire extinguisher, Essentials are common but not universal. Offering these can provide a competitive edge.
Recommendations for Hosts
- Ensure your listing includes all essential amenities for Town of Clinton: Wifi, Free parking on premises, Smoke alarm, Carbon monoxide alarm, Air conditioning, Heating.
- Prioritize adding missing essentials: Smoke alarm, Carbon monoxide alarm, Air conditioning, Heating.
- Consider adding popular differentiators like Hair dryer or Fire extinguisher to increase appeal.
- Highlight unique or less common amenities you offer (e.g., hot tub, dedicated workspace, EV charger) in your listing description and photos.
- Regularly check competitor amenities in Town of Clinton to stay competitive.
Town of Clinton Airbnb Guest Demographics & Profile Analysis (2026)
Guest Profile Summary for Town of Clinton
- The typical guest profile for Airbnb in Town of Clinton consists of primarily domestic travelers (95%), often arriving from nearby New York, typically belonging to the Post-2000s (Gen Z/Alpha) group (50%), primarily speaking English or Spanish.
- Domestic travelers account for 94.9% of guests.
- Key international markets include United States (94.9%) and DC (2.1%).
- Top languages spoken are English (67.8%) followed by Spanish (12%).
- A significant demographic segment is the Post-2000s (Gen Z/Alpha) group, representing 50% of guests.
Recommendations for Hosts
- Target domestic marketing efforts towards travelers from New York and Philadelphia.
- Tailor amenities and listing descriptions to appeal to the dominant Post-2000s (Gen Z/Alpha) demographic (e.g., highlight fast WiFi, smart home features, local guides).
- Highlight unique local experiences or amenities relevant to the primary guest profile.
- Consider seasonal promotions aligned with peak travel times for key origin markets.
Nearby Short-Term Rental Market Comparison
How does the Town of Clinton Airbnb market stack up against its neighbors? Compare key performance metrics like average monthly revenue, ADR, and occupancy rates in surrounding areas to understand the broader regional STR landscape.
| Market | Active Properties | Monthly Revenue | Daily Rate | Avg. Occupancy |
|---|---|---|---|---|
| Town of Kingston | 10 | $6,470 | $473.76 | 49% |
| Frankford Township | 11 | $6,329 | $505.19 | 41% |
| Sag Harbor | 15 | $6,129 | $1280.84 | 40% |
| Town of East Hampton | 1,327 | $5,945 | $986.02 | 36% |
| Spring Lake Heights | 16 | $5,785 | $725.20 | 40% |
| Town of Monroe | 22 | $5,690 | $720.52 | 37% |
| Town of Southampton | 1,201 | $5,620 | $1002.45 | 33% |
| Town of Ancram | 22 | $5,616 | $512.55 | 38% |
| Southampton | 19 | $5,405 | $1456.43 | 30% |
| Neptune City | 12 | $5,299 | $531.14 | 45% |