Town of Cazenovia Airbnb Market Analysis 2026: Short Term Rental Data & Vacation Rental Statistics in New York, United States
Is Airbnb profitable in Town of Cazenovia in 2026? Explore comprehensive Airbnb analytics for Town of Cazenovia, New York, United States to uncover income potential. This 2026 STR market report for Town of Cazenovia, based on AirROI data from February 2025 to January 2026, reveals key trends in the niche market of 22 active listings.
Whether you're considering an Airbnb investment in Town of Cazenovia, optimizing your existing vacation rental, or exploring rental arbitrage opportunities, understanding the Town of Cazenovia Airbnb data is crucial. Leveraging the low regulation environment is key to maximizing your short term rental income potential. Let's dive into the specifics.
Key Town of Cazenovia Airbnb Performance Metrics Overview
Monthly Airbnb Revenue Variations & Income Potential in Town of Cazenovia (2026)
Understanding the monthly revenue variations for Airbnb listings in Town of Cazenovia is key to maximizing your short term rental income potential. Seasonality significantly impacts earnings. Our analysis, based on data from the past 12 months, shows that the peak revenue month for STRs in Town of Cazenovia is typically August, while January often presents the lowest earnings, highlighting opportunities for strategic pricing adjustments during shoulder and low seasons. Explore the typical Airbnb income in Town of Cazenovia across different performance tiers:
- Best-in-class properties (Top 10%) achieve $5,451+ monthly, often utilizing dynamic pricing and superior guest experiences.
- Strong performing properties (Top 25%) earn $3,339 or more, indicating effective management and desirable locations/amenities.
- Typical properties (Median) generate around $1,936 per month, representing the average market performance.
- Entry-level properties (Bottom 25%) see earnings around $1,177, often with potential for optimization.
Average Monthly Airbnb Earnings Trend in Town of Cazenovia
Town of Cazenovia Airbnb Occupancy Rate Trends (2026)
Maximize your bookings by understanding the Town of Cazenovia STR occupancy trends. Seasonal demand shifts significantly influence how often properties are booked. Typically, Julysees the highest demand (peak season occupancy), while January experiences the lowest (low season). Effective strategies, like adjusting minimum stays or offering promotions, can boost occupancy during slower periods. Here's how different property tiers perform in Town of Cazenovia:
- Best-in-class properties (Top 10%) achieve 74%+ occupancy, indicating high desirability and potentially optimized availability.
- Strong performing properties (Top 25%) maintain 49% or higher occupancy, suggesting good market fit and guest satisfaction.
- Typical properties (Median) have an occupancy rate around 34%.
- Entry-level properties (Bottom 25%) average 19% occupancy, potentially facing higher vacancy.
Average Monthly Occupancy Rate Trend in Town of Cazenovia
Average Daily Rate (ADR) Airbnb Trends in Town of Cazenovia (2026)
Effective short term rental pricing strategy in Town of Cazenovia involves understanding monthly ADR fluctuations. The Average Daily Rate (ADR) for Airbnb in Town of Cazenovia typically peaks in June and dips lowest during March. Leveraging Airbnb dynamic pricing tools or strategies based on this seasonality can significantly boost revenue. Here's a look at the typical nightly rates achieved:
- Best-in-class properties (Top 10%) command rates of $422+ per night, often due to premium features or locations.
- Strong performing properties (Top 25%) achieve nightly rates of $299 or more.
- Typical properties (Median) charge around $188 per night.
- Entry-level properties (Bottom 25%) earn around $136 per night.
Average Daily Rate (ADR) Trend by Month in Town of Cazenovia
Get Live Town of Cazenovia Market Intelligence 👇

Explore Real-time Analytics
Airbnb Seasonality Analysis & Trends in Town of Cazenovia (2026)
Peak Season (August, July, September)
- Revenue averages $3,861 per month
- Occupancy rates average 51.0%
- Daily rates average $278
Shoulder Season
- Revenue averages $2,502 per month
- Occupancy maintains around 37.3%
- Daily rates hold near $274
Low Season (January, February, March)
- Revenue drops to average $1,278 per month
- Occupancy decreases to average 23.6%
- Daily rates adjust to average $266
Seasonality Insights for Town of Cazenovia
- The Airbnb seasonality in Town of Cazenovia shows highly seasonal trends requiring careful strategy. While the sections above show seasonal averages, it's also insightful to look at the extremes:
- During the high season, the absolute peak month showcases Town of Cazenovia's highest earning potential, with monthly revenues capable of climbing to $4,342, occupancy reaching a high of 56.8%, and ADRs peaking at $283.
- Conversely, the slowest single month of the year, typically falling within the low season, marks the market's lowest point. In this month, revenue might dip to $665, occupancy could drop to 16.8%, and ADRs may adjust down to $261.
- Understanding both the seasonal averages and these monthly peaks and troughs in revenue, occupancy, and ADR is crucial for maximizing your Airbnb profit potential in Town of Cazenovia.
Seasonal Strategies for Maximizing Profit
- Peak Season: Maximize revenue through premium pricing and potentially longer minimum stays. Ensure high availability.
- Low Season: Offer competitive pricing, special promotions (e.g., extended stay discounts), and flexible cancellation policies. Target off-season travelers like remote workers or budget-conscious guests.
- Shoulder Seasons: Implement dynamic pricing that balances peak and low rates. Target weekend travelers or specific events. Offer slightly more flexible terms than peak season.
- Regularly analyze your own performance against these Town of Cazenovia seasonality benchmarks and adjust your pricing and availability strategy accordingly.
Best Areas for Airbnb Investment in Town of Cazenovia (2026)
Exploring the top neighborhoods for short-term rentals in Town of Cazenovia? This section highlights key areas, outlining why they are attractive for hosts and guests, along with notable local attractions. Consider these locations based on your target guest profile and investment strategy.
| Neighborhood / Area | Why Host Here? (Target Guests & Appeal) | Key Attractions & Landmarks |
|---|---|---|
| Downtown Cazenovia | The heart of Cazenovia with charming shops, restaurants, and proximity to Cazenovia Lake. A popular base for visitors looking to explore the town and nearby natural landscapes. | Cazenovia Lake, Cazenovia Public Library, Cazenovia Golf Club, Chittenango Falls State Park, Cazenovia Commons |
| Cazenovia Lakefront | Stunning views and direct access to Cazenovia Lake make this area a favorite for families and summer vacationers looking for waterfront accommodations. | Cazenovia Lake, Cazenovia Village Park, Boating and fishing, Swimming beaches, Nature trails |
| Cazenovia State Forest | Ideal for nature lovers and outdoor enthusiasts, this area offers hiking trails and a peaceful wooded environment, attracting guests who seek tranquility and adventure. | Hiking trails, Nature watching, Picnic areas, Exploring local wildlife, Outdoor activities |
| Cazenovia Village | Rich in history and charm, this area features historic architecture and a close-knit community feel, appealing to those looking for a quaint town experience. | Cazenovia Historical Society, Charming local shops, Annual events and festivals, Art galleries, Community markets |
| Cazenovia Art Trail | A unique area showcasing local artists and studios, ideal for cultural tourism and attracting guests interested in art and creativity. | Local artist studios, Art exhibitions, Art workshops, Cultural events, Scenic drives |
| Nearby Cazenovia Winery | Attracts wine enthusiasts and visitors looking for a taste of local wines and beautiful vineyard views, making it a delightful getaway destination. | Wine tastings, Vineyard tours, Picnic areas, Seasonal events, Scenic views |
| Cazenovia Country Club | A popular area for golf enthusiasts and those seeking a summer getaway, offering recreational activities and a relaxing atmosphere. | Golfing, Clubhouse dining, Events and tournaments, Scenic landscapes, Lakeside views |
| Cazenovia Ski Resort | Ideal for winter sports lovers, this location offers skiing and snowboarding activities, attracting visitors year-round for its seasonal offerings. | Skiing and snowboarding, Winter sports events, Lodging options, Snowshoeing, Winter hiking trails |
Understanding Airbnb License Requirements & STR Laws in Town of Cazenovia (2026)
While Town of Cazenovia, New York, United States currently shows low STR regulations, specific Airbnb license requirements might still exist or change. Always verify the latest short term rental regulations and Airbnb license requirements directly with local government authorities for Town of Cazenovia to ensure full compliance before hosting.
(Source: AirROI data, 2026, finding no licensed listings among those analyzed)
Top Performing Airbnb Properties in Town of Cazenovia (2026)
Benchmark your potential! Explore examples of top-performing Airbnb properties in Town of Cazenoviabased on Trailing Twelve Month (TTM) revenue. Analyze their characteristics, revenue, occupancy rate, and ADR to understand what drives success in this market.
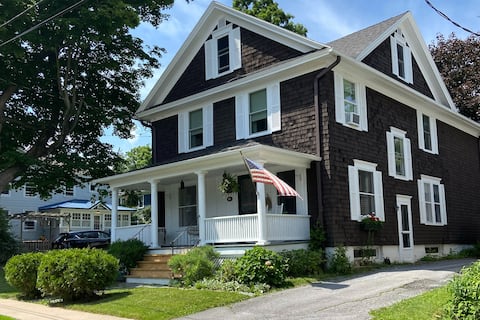
Village Escape - 5 Bedroom, 2 Bath in the village
Entire Place • 5 bedrooms

1854 Farmhouse Stay Historic Cazenovia
Entire Place • 1 bedroom
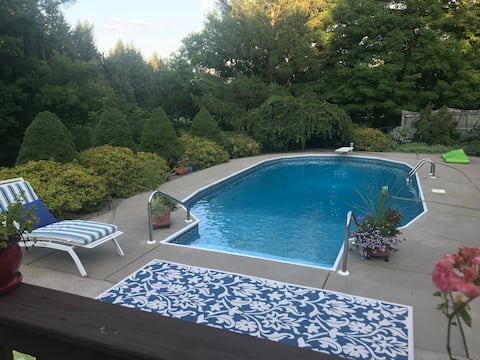
Quaint 3 bedroom country home with inground pool!
Entire Place • 3 bedrooms

Gracious village suite.
Entire Place • 2 bedrooms

The Cabin at Mystic Mountain
Entire Place • 3 bedrooms
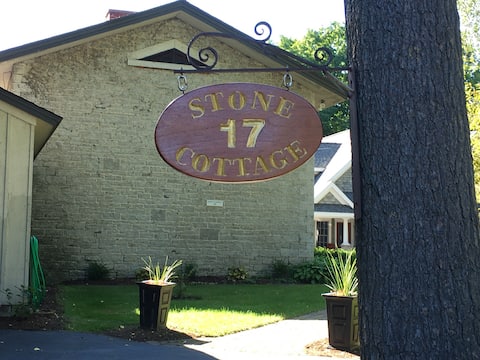
Historic Stone Cottage on Cazenovia Lake
Private Room �• 1 bedroom
Note: Performance varies based on location, size, amenities, seasonality, and management quality. Data reflects the past 12 months.
Top Performing Airbnb Hosts in Town of Cazenovia (2026)
Learn from the best! This table showcases top-performing Airbnb hosts in Town of Cazenovia based on the number of properties managed and estimated total revenue over the past year. Analyze their scale and performance metrics.
| Host Name | Properties | Grossing Revenue | Stay Reviews | Avg Rating |
|---|---|---|---|---|
| Sondra | 3 | $62,002 | 117 | 4.74/5.0 |
| Robin | 1 | $60,287 | 102 | 4.96/5.0 |
| Lisa | 1 | $59,153 | 104 | 5.00/5.0 |
| Nancy | 2 | $41,668 | 205 | 5.00/5.0 |
| Brian & Melissa | 2 | $41,350 | 455 | 4.85/5.0 |
| David Allen | 2 | $36,953 | 35 | 4.55/5.0 |
| Wendy | 2 | $32,529 | 270 | 4.88/5.0 |
| Cheryl | 1 | $31,131 | 85 | 4.88/5.0 |
| Teresa | 1 | $27,897 | 118 | 4.97/5.0 |
| Wendy | 1 | $26,726 | 60 | 4.93/5.0 |
Analyzing the strategies of top hosts, such as their property selection, pricing, and guest communication, can offer valuable lessons for optimizing your own Airbnb operations in Town of Cazenovia.
Dive Deeper: Advanced Town of Cazenovia STR Market Data (2026)
Ready to unlock more insights? AirROI provides access to advanced metrics and comprehensive Airbnb data for Town of Cazenovia. Explore detailed analytics beyond this report to refine your investment strategy, optimize pricing, and maximize your vacation rental profits.
Explore Advanced MetricsTown of Cazenovia Short-Term Rental Market Composition (2026): Property & Room Types
Room Type Distribution
Property Type Distribution
Market Composition Insights for Town of Cazenovia
- The Town of Cazenovia Airbnb market composition is heavily skewed towards Entire Home/Apt listings, which make up 86.4% of the 22 active rentals. This indicates strong guest preference for privacy and space.
- Looking at the property type distribution in Town of Cazenovia, House properties are the most common (54.5%), reflecting the local real estate landscape.
- Houses represent a significant 54.5% portion, catering likely to families or larger groups.
- The presence of 9.1% Hotel/Boutique listings indicates integration with traditional hospitality.
- Smaller segments like outdoor/unique (combined 4.5%) offer potential for unique stay experiences.
Town of Cazenovia Airbnb Room Capacity Analysis (2026): Bedroom Distribution
Distribution of Listings by Number of Bedrooms
Room Capacity Insights for Town of Cazenovia
- The dominant room capacity in Town of Cazenovia is 2 bedrooms listings, making up 22.7% of the market. This suggests a strong demand for properties suitable for couples or solo travelers.
- Together, 2 bedrooms and 3 bedrooms properties represent 45.4% of the active Airbnb listings in Town of Cazenovia, indicating a high concentration in these sizes.
- A significant 45.4% of listings offer 3+ bedrooms, catering to larger groups and families seeking more space in Town of Cazenovia.
Town of Cazenovia Vacation Rental Guest Capacity Trends (2026)
Distribution of Listings by Guest Capacity
Guest Capacity Insights for Town of Cazenovia
- The most common guest capacity trend in Town of Cazenovia vacation rentals is listings accommodating 6 guests (22.7%). This suggests the primary traveler segment is likely larger groups.
- Properties designed for 6 guests and 5 guests dominate the Town of Cazenovia STR market, accounting for 40.9% of listings.
- 40.8% of properties accommodate 6+ guests, serving the market segment for larger families or group travel in Town of Cazenovia.
- On average, properties in Town of Cazenovia are equipped to host 4.7 guests.
Town of Cazenovia Airbnb Booking Patterns (2026): Available vs. Booked Days
Available Days Distribution
Booked Days Distribution
Booking Pattern Insights for Town of Cazenovia
- The most common availability pattern in Town of Cazenovia falls within the 181-270 days range, representing 50% of listings. This suggests many properties have significant open periods on their calendars.
- Approximately 95.5% of listings show high availability (181+ days open annually), indicating potential for increased bookings or specific owner usage patterns.
- For booked days, the 91-180 days range is most frequent in Town of Cazenovia (45.5%), reflecting common guest stay durations or potential owner blocking patterns.
- A notable 9.1% of properties secure long booking periods (181+ days booked per year), highlighting successful long-term rental strategies or significant owner usage.
Town of Cazenovia Airbnb Minimum Stay Requirements Analysis
Distribution of Listings by Minimum Night Requirement
1 Night
5 listings
22.7% of total
2 Nights
7 listings
31.8% of total
3 Nights
3 listings
13.6% of total
7-29 Nights
1 listings
4.5% of total
30+ Nights
6 listings
27.3% of total
Key Insights
- The most prevalent minimum stay requirement in Town of Cazenovia is 2 Nights, adopted by 31.8% of listings. This highlights the market's preference for shorter, flexible bookings.
- A significant segment (27.3%) caters to monthly stays (30+ nights) in Town of Cazenovia, pointing to opportunities in the extended-stay market.
Recommendations
- Align with the market by considering a 2 Nights minimum stay, as 31.8% of Town of Cazenovia hosts use this setting.
- If feasible, allowing 1-night stays, especially midweek or during low season, could capture last-minute bookings, as only 22.7% currently do.
- Explore offering discounts for stays of 30+ nights to attract the 27.3% of the market seeking extended stays.
- Adjust minimum nights based on seasonality – potentially shorter during low season and longer during peak demand periods in Town of Cazenovia.
Town of Cazenovia Airbnb Cancellation Policy Trends Analysis (2026)
Flexible
1 listings
4.5% of total
Moderate
3 listings
13.6% of total
Firm
15 listings
68.2% of total
Strict
3 listings
13.6% of total
Cancellation Policy Insights for Town of Cazenovia
- The prevailing Airbnb cancellation policy trend in Town of Cazenovia is Firm, used by 68.2% of listings.
- A majority (81.8%) of hosts in Town of Cazenovia utilize Firm or Strict policies, indicating a market where hosts prioritize booking security.
Recommendations for Hosts
- Consider adopting a Firm policy to align with the 68.2% market standard in Town of Cazenovia.
- Using a Strict policy might deter some guests, as only 13.6% of listings use it. Evaluate if potential revenue protection outweighs possible lower booking rates.
- Regularly review your cancellation policy against competitors and market demand shifts in Town of Cazenovia.
Town of Cazenovia STR Booking Lead Time Analysis (2026)
Average Booking Lead Time by Month
Booking Lead Time Insights for Town of Cazenovia
- The overall average booking lead time for vacation rentals in Town of Cazenovia is 73 days.
- Guests book furthest in advance for stays during May (average 132 days), likely coinciding with peak travel demand or local events.
- The shortest booking windows occur for stays in February (average 10 days), indicating more last-minute travel plans during this time.
- Seasonally, Spring (74 days avg.) sees the longest lead times, while Winter (31 days avg.) has the shortest, reflecting typical travel planning cycles.
Recommendations for Hosts
- Use the overall average lead time (73 days) as a baseline for your pricing and availability strategy in Town of Cazenovia.
- For May stays, consider implementing length-of-stay discounts or slightly higher rates for bookings made less than 132 days out to capitalize on advance planning.
- During February, focus on last-minute booking availability and promotions, as guests book with very short notice (10 days avg.).
- Target marketing efforts for the Spring season well in advance (at least 74 days) to capture early planners.
- Monitor your own booking lead times against these Town of Cazenovia averages to identify opportunities for dynamic pricing adjustments.
Popular & Essential Airbnb Amenities in Town of Cazenovia (2026)
Amenity Prevalence
Amenity Insights for Town of Cazenovia
- Essential amenities in Town of Cazenovia that guests expect include: Smoke alarm, Free parking on premises, Heating, Wifi, Essentials, Hangers. Lacking these (any) could significantly impact bookings.
- Popular amenities like Hair dryer, Coffee maker, Hot water are common but not universal. Offering these can provide a competitive edge.
Recommendations for Hosts
- Ensure your listing includes all essential amenities for Town of Cazenovia: Smoke alarm, Free parking on premises, Heating, Wifi, Essentials, Hangers.
- Prioritize adding missing essentials: Hangers.
- Consider adding popular differentiators like Hair dryer or Coffee maker to increase appeal.
- Highlight unique or less common amenities you offer (e.g., hot tub, dedicated workspace, EV charger) in your listing description and photos.
- Regularly check competitor amenities in Town of Cazenovia to stay competitive.
Town of Cazenovia Airbnb Guest Demographics & Profile Analysis (2026)
Guest Profile Summary for Town of Cazenovia
- The typical guest profile for Airbnb in Town of Cazenovia consists of primarily domestic travelers (94%), often arriving from nearby Huntington Station, typically belonging to the Post-2000s (Gen Z/Alpha) group (50%), primarily speaking English or Spanish.
- Domestic travelers account for 93.7% of guests.
- Key international markets include United States (93.7%) and Canada (1.7%).
- Top languages spoken are English (70%) followed by Spanish (13.8%).
- A significant demographic segment is the Post-2000s (Gen Z/Alpha) group, representing 50% of guests.
Recommendations for Hosts
- Target domestic marketing efforts towards travelers from Huntington Station and Philadelphia.
- Tailor amenities and listing descriptions to appeal to the dominant Post-2000s (Gen Z/Alpha) demographic (e.g., highlight fast WiFi, smart home features, local guides).
- Highlight unique local experiences or amenities relevant to the primary guest profile.
- Consider seasonal promotions aligned with peak travel times for key origin markets.
Nearby Short-Term Rental Market Comparison
How does the Town of Cazenovia Airbnb market stack up against its neighbors? Compare key performance metrics like average monthly revenue, ADR, and occupancy rates in surrounding areas to understand the broader regional STR landscape.
| Market | Active Properties | Monthly Revenue | Daily Rate | Avg. Occupancy |
|---|---|---|---|---|
| Freeland | 11 | $8,436 | $684.29 | 42% |
| Town of Trenton | 13 | $7,410 | $484.59 | 43% |
| Berlin Township | 15 | $7,208 | $729.10 | 35% |
| Town of Kingston | 10 | $6,470 | $473.76 | 49% |
| Frankford Township | 11 | $6,329 | $505.19 | 41% |
| Stroud Township | 137 | $5,728 | $478.40 | 40% |
| Town of Monroe | 22 | $5,690 | $720.52 | 37% |
| Town of Torrey | 34 | $5,535 | $437.35 | 50% |
| Mount Pocono | 22 | $5,346 | $485.18 | 45% |
| Pocono Summit | 11 | $5,114 | $548.58 | 43% |