Town of Bolton Airbnb Market Analysis 2026: Short Term Rental Data & Vacation Rental Statistics in New York, United States
Is Airbnb profitable in Town of Bolton in 2026? Explore comprehensive Airbnb analytics for Town of Bolton, New York, United States to uncover income potential. This 2026 STR market report for Town of Bolton, based on AirROI data from February 2025 to January 2026, reveals key trends in the niche market of 140 active listings.
Whether you're considering an Airbnb investment in Town of Bolton, optimizing your existing vacation rental, or exploring rental arbitrage opportunities, understanding the Town of Bolton Airbnb data is crucial. Leveraging the low regulation environment is key to maximizing your short term rental income potential. Let's dive into the specifics.
Key Town of Bolton Airbnb Performance Metrics Overview
Monthly Airbnb Revenue Variations & Income Potential in Town of Bolton (2026)
Understanding the monthly revenue variations for Airbnb listings in Town of Bolton is key to maximizing your short term rental income potential. Seasonality significantly impacts earnings. Our analysis, based on data from the past 12 months, shows that the peak revenue month for STRs in Town of Bolton is typically August, while March often presents the lowest earnings, highlighting opportunities for strategic pricing adjustments during shoulder and low seasons. Explore the typical Airbnb income in Town of Bolton across different performance tiers:
- Best-in-class properties (Top 10%) achieve $14,443+ monthly, often utilizing dynamic pricing and superior guest experiences.
- Strong performing properties (Top 25%) earn $8,610 or more, indicating effective management and desirable locations/amenities.
- Typical properties (Median) generate around $4,455 per month, representing the average market performance.
- Entry-level properties (Bottom 25%) see earnings around $2,710, often with potential for optimization.
Average Monthly Airbnb Earnings Trend in Town of Bolton
Town of Bolton Airbnb Occupancy Rate Trends (2026)
Maximize your bookings by understanding the Town of Bolton STR occupancy trends. Seasonal demand shifts significantly influence how often properties are booked. Typically, Augustsees the highest demand (peak season occupancy), while January experiences the lowest (low season). Effective strategies, like adjusting minimum stays or offering promotions, can boost occupancy during slower periods. Here's how different property tiers perform in Town of Bolton:
- Best-in-class properties (Top 10%) achieve 63%+ occupancy, indicating high desirability and potentially optimized availability.
- Strong performing properties (Top 25%) maintain 45% or higher occupancy, suggesting good market fit and guest satisfaction.
- Typical properties (Median) have an occupancy rate around 29%.
- Entry-level properties (Bottom 25%) average 18% occupancy, potentially facing higher vacancy.
Average Monthly Occupancy Rate Trend in Town of Bolton
Average Daily Rate (ADR) Airbnb Trends in Town of Bolton (2026)
Effective short term rental pricing strategy in Town of Bolton involves understanding monthly ADR fluctuations. The Average Daily Rate (ADR) for Airbnb in Town of Bolton typically peaks in July and dips lowest during March. Leveraging Airbnb dynamic pricing tools or strategies based on this seasonality can significantly boost revenue. Here's a look at the typical nightly rates achieved:
- Best-in-class properties (Top 10%) command rates of $1,505+ per night, often due to premium features or locations.
- Strong performing properties (Top 25%) achieve nightly rates of $875 or more.
- Typical properties (Median) charge around $480 per night.
- Entry-level properties (Bottom 25%) earn around $337 per night.
Average Daily Rate (ADR) Trend by Month in Town of Bolton
Get Live Town of Bolton Market Intelligence 👇

Explore Real-time Analytics
Airbnb Seasonality Analysis & Trends in Town of Bolton (2026)
Peak Season (August, July, June)
- Revenue averages $12,154 per month
- Occupancy rates average 54.9%
- Daily rates average $758
Shoulder Season
- Revenue averages $5,309 per month
- Occupancy maintains around 27.5%
- Daily rates hold near $691
Low Season (January, March, April)
- Revenue drops to average $3,844 per month
- Occupancy decreases to average 24.4%
- Daily rates adjust to average $672
Seasonality Insights for Town of Bolton
- The Airbnb seasonality in Town of Bolton shows highly seasonal trends requiring careful strategy. While the sections above show seasonal averages, it's also insightful to look at the extremes:
- During the high season, the absolute peak month showcases Town of Bolton's highest earning potential, with monthly revenues capable of climbing to $14,533, occupancy reaching a high of 65.9%, and ADRs peaking at $761.
- Conversely, the slowest single month of the year, typically falling within the low season, marks the market's lowest point. In this month, revenue might dip to $3,488, occupancy could drop to 20.8%, and ADRs may adjust down to $668.
- Understanding both the seasonal averages and these monthly peaks and troughs in revenue, occupancy, and ADR is crucial for maximizing your Airbnb profit potential in Town of Bolton.
Seasonal Strategies for Maximizing Profit
- Peak Season: Maximize revenue through premium pricing and potentially longer minimum stays. Ensure high availability.
- Low Season: Offer competitive pricing, special promotions (e.g., extended stay discounts), and flexible cancellation policies. Target off-season travelers like remote workers or budget-conscious guests.
- Shoulder Seasons: Implement dynamic pricing that balances peak and low rates. Target weekend travelers or specific events. Offer slightly more flexible terms than peak season.
- Regularly analyze your own performance against these Town of Bolton seasonality benchmarks and adjust your pricing and availability strategy accordingly.
Best Areas for Airbnb Investment in Town of Bolton (2026)
Exploring the top neighborhoods for short-term rentals in Town of Bolton? This section highlights key areas, outlining why they are attractive for hosts and guests, along with notable local attractions. Consider these locations based on your target guest profile and investment strategy.
| Neighborhood / Area | Why Host Here? (Target Guests & Appeal) | Key Attractions & Landmarks |
|---|---|---|
| Lake George | A beautiful freshwater lake surrounded by the Adirondack Mountains, Lake George is a popular destination for outdoor activities, tourism, and family fun. It's ideal for summer rentals and winter sports enthusiasts. | Lake George Steamboat Company, Fort William Henry Museum, The Great Escape & Splashwater Kingdom, Scenic Cruises on Lake George, Lake George Village, Prospect Mountain |
| Bolton Landing | Bolton Landing is a charming small town on the shores of Lake George, known for its stunning scenery and proximity to nature activities. It's perfect for visitors looking for a quiet retreat. | Bolton Landing Marina, The Algonquin Restaurant, Hiking at Rogers Memorial Park, Bolton Historical Museum, Annie's Park, Beachfront at the Town of Bolton |
| Prospect Mountain | Famous for its panoramic views, hiking trails, and natural beauty, Prospect Mountain attracts outdoor enthusiasts year-round. This area is perfect for nature-loving Airbnb guests. | Prospect Mountain Veterans Memorial Highway, Hiking Trails, Scenic Overlooks, Picnic Areas, Fishing and Boating nearby |
| Adirondack Park | A vast park with endless hiking, skiing, and nature activities. It attracts tourists looking to explore the great outdoors throughout all seasons, making it a solid investment opportunity. | Hiking in the High Peaks, Skiing at Gore Mountain, Canoeing in the many lakes, Wildlife watching, Scenic landscapes and views |
| Lake Luzerne | Just a short drive from Bolton, Lake Luzerne is a scenic area with access to the Hudson River and Lake Luzerne. It's suitable for vacationers seeking water activities and outdoor recreation. | Lake Luzerne Beach, Hudson River Rafting, Camping and Hiking |
| Ticonderoga | Rich in history and natural beauty, Ticonderoga offers opportunities to explore historical sites, such as Fort Ticonderoga, and is close to recreational areas, making it popular among visitors. | Fort Ticonderoga, Montcalm Point, Lake George Battlefield Park, Ticonderoga Historical Society, Skiing at nearby resorts |
| Gore Mountain | A ski area that is a major draw in the winter, attracting skiers and snowboarders. In the summer, it's popular for hiking and outdoor activities. A seasonal hotspot for Airbnb rentals. | Gore Mountain Ski Resort, Hiking Trails, Scenic Chairlift Rides, Summer Festivals |
| Hague | A quaint town on the shores of Lake George, Hague offers stunning views and access to outdoor fun. It attracts tourists who want to experience the serenity of nature. | Hague Town beach, Fishing, kayaking, and hiking, Scenic Drives, Hague Historical Society |
Understanding Airbnb License Requirements & STR Laws in Town of Bolton (2026)
While Town of Bolton, New York, United States currently shows low STR regulations, specific Airbnb license requirements might still exist or change. Always verify the latest short term rental regulations and Airbnb license requirements directly with local government authorities for Town of Bolton to ensure full compliance before hosting.
(Source: AirROI data, 2026, finding no licensed listings among those analyzed)
Top Performing Airbnb Properties in Town of Bolton (2026)
Benchmark your potential! Explore examples of top-performing Airbnb properties in Town of Boltonbased on Trailing Twelve Month (TTM) revenue. Analyze their characteristics, revenue, occupancy rate, and ADR to understand what drives success in this market.
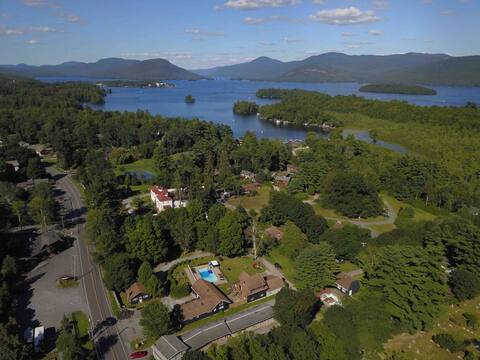
The Bolton Estate with Pool and Beach
Entire Place • 18 bedrooms

Bolton Bear House|Karaoke Stage|Hot Tub|12 Beds|
Entire Place • 6 bedrooms
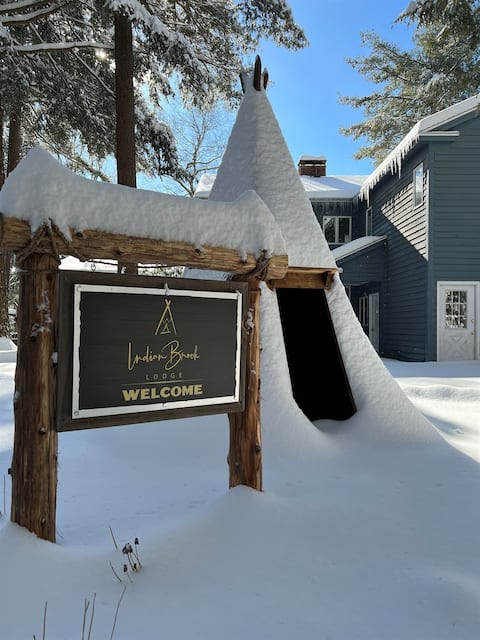
Indian Brook Lodge|11 Beds|Hot Tub|Pet Friendly|
Entire Place • 6 bedrooms
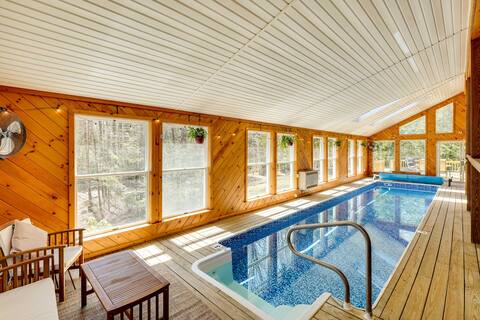
Lake George Oasis w/ 9 Acres, Hot Tub & Game Room!
Entire Place • 3 bedrooms
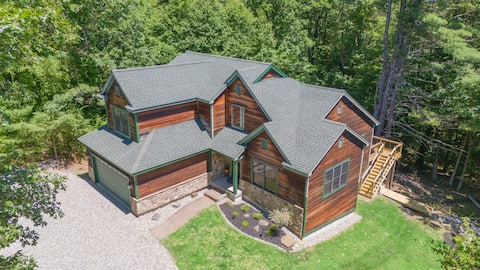
Bolton Hill Lodge
Entire Place • 4 bedrooms
Sagamore Golf House|Wine Cellar|Movie Theater|15bd
Entire Place • 8 bedrooms
Note: Performance varies based on location, size, amenities, seasonality, and management quality. Data reflects the past 12 months.
Top Performing Airbnb Hosts in Town of Bolton (2026)
Learn from the best! This table showcases top-performing Airbnb hosts in Town of Bolton based on the number of properties managed and estimated total revenue over the past year. Analyze their scale and performance metrics.
| Host Name | Properties | Grossing Revenue | Stay Reviews | Avg Rating |
|---|---|---|---|---|
| LakeGeorgeVacay.Com | 7 | $1,155,399 | 66 | 5.00/5.0 |
| Northern Living | 12 | $774,906 | 199 | 4.86/5.0 |
| Jacob | 5 | $597,766 | 87 | 4.96/5.0 |
| Evolve | 8 | $393,181 | 240 | 4.87/5.0 |
| John | 5 | $267,945 | 147 | 4.90/5.0 |
| Michelle | 8 | $261,121 | 251 | 4.82/5.0 |
| Jessica | 1 | $202,644 | 28 | 5.00/5.0 |
| Eagle'S Nest | 1 | $155,051 | 48 | 4.98/5.0 |
| Kimberly | 2 | $149,988 | 118 | 4.89/5.0 |
| Jeanette | 1 | $139,254 | 243 | 4.86/5.0 |
Analyzing the strategies of top hosts, such as their property selection, pricing, and guest communication, can offer valuable lessons for optimizing your own Airbnb operations in Town of Bolton.
Dive Deeper: Advanced Town of Bolton STR Market Data (2026)
Ready to unlock more insights? AirROI provides access to advanced metrics and comprehensive Airbnb data for Town of Bolton. Explore detailed analytics beyond this report to refine your investment strategy, optimize pricing, and maximize your vacation rental profits.
Explore Advanced MetricsTown of Bolton Short-Term Rental Market Composition (2026): Property & Room Types
Room Type Distribution
Property Type Distribution
Market Composition Insights for Town of Bolton
- The Town of Bolton Airbnb market composition is heavily skewed towards Entire Home/Apt listings, which make up 97.1% of the 140 active rentals. This indicates strong guest preference for privacy and space.
- Looking at the property type distribution in Town of Bolton, House properties are the most common (68.6%), reflecting the local real estate landscape.
- Houses represent a significant 68.6% portion, catering likely to families or larger groups.
- Smaller segments like unique stays, hotel/boutique, others (combined 7.9%) offer potential for unique stay experiences.
Town of Bolton Airbnb Room Capacity Analysis (2026): Bedroom Distribution
Distribution of Listings by Number of Bedrooms
Room Capacity Insights for Town of Bolton
- The dominant room capacity in Town of Bolton is 3 bedrooms listings, making up 28.6% of the market. This suggests a strong demand for properties suitable for families or small groups.
- Together, 3 bedrooms and 4 bedrooms properties represent 52.9% of the active Airbnb listings in Town of Bolton, indicating a high concentration in these sizes.
- A significant 69.3% of listings offer 3+ bedrooms, catering to larger groups and families seeking more space in Town of Bolton.
Town of Bolton Vacation Rental Guest Capacity Trends (2026)
Distribution of Listings by Guest Capacity
Guest Capacity Insights for Town of Bolton
- The most common guest capacity trend in Town of Bolton vacation rentals is listings accommodating 8+ guests (55.7%). This suggests the primary traveler segment is likely larger groups.
- Properties designed for 8+ guests and 6 guests dominate the Town of Bolton STR market, accounting for 72.1% of listings.
- 74.2% of properties accommodate 6+ guests, serving the market segment for larger families or group travel in Town of Bolton.
- On average, properties in Town of Bolton are equipped to host 6.5 guests.
Town of Bolton Airbnb Booking Patterns (2026): Available vs. Booked Days
Available Days Distribution
Booked Days Distribution
Booking Pattern Insights for Town of Bolton
- The most common availability pattern in Town of Bolton falls within the 271-366 days range, representing 62.9% of listings. This suggests many properties have significant open periods on their calendars.
- Approximately 95.8% of listings show high availability (181+ days open annually), indicating potential for increased bookings or specific owner usage patterns.
- For booked days, the 31-90 days range is most frequent in Town of Bolton (44.3%), reflecting common guest stay durations or potential owner blocking patterns.
- A notable 4.3% of properties secure long booking periods (181+ days booked per year), highlighting successful long-term rental strategies or significant owner usage.
Town of Bolton Airbnb Minimum Stay Requirements Analysis
Distribution of Listings by Minimum Night Requirement
1 Night
1 listings
0.7% of total
2 Nights
34 listings
24.3% of total
3 Nights
14 listings
10% of total
4-6 Nights
9 listings
6.4% of total
7-29 Nights
3 listings
2.1% of total
30+ Nights
79 listings
56.4% of total
Key Insights
- The most prevalent minimum stay requirement in Town of Bolton is 30+ Nights, adopted by 56.4% of listings. This highlights the market's preference for longer commitments.
- A significant segment (56.4%) caters to monthly stays (30+ nights) in Town of Bolton, pointing to opportunities in the extended-stay market.
Recommendations
- Align with the market by considering a 30+ Nights minimum stay, as 56.4% of Town of Bolton hosts use this setting.
- If feasible, allowing 1-night stays, especially midweek or during low season, could capture last-minute bookings, as only 0.7% currently do.
- Explore offering discounts for stays of 30+ nights to attract the 56.4% of the market seeking extended stays.
- Adjust minimum nights based on seasonality – potentially shorter during low season and longer during peak demand periods in Town of Bolton.
Town of Bolton Airbnb Cancellation Policy Trends Analysis (2026)
Super Strict 30 Days
8 listings
5.7% of total
Limited
2 listings
1.4% of total
Super Strict 60 Days
10 listings
7.1% of total
Flexible
9 listings
6.4% of total
Moderate
12 listings
8.6% of total
Firm
67 listings
47.9% of total
Strict
32 listings
22.9% of total
Cancellation Policy Insights for Town of Bolton
- The prevailing Airbnb cancellation policy trend in Town of Bolton is Firm, used by 47.9% of listings.
- A majority (70.8%) of hosts in Town of Bolton utilize Firm or Strict policies, indicating a market where hosts prioritize booking security.
Recommendations for Hosts
- Consider adopting a Firm policy to align with the 47.9% market standard in Town of Bolton.
- Regularly review your cancellation policy against competitors and market demand shifts in Town of Bolton.
Town of Bolton STR Booking Lead Time Analysis (2026)
Average Booking Lead Time by Month
Booking Lead Time Insights for Town of Bolton
- The overall average booking lead time for vacation rentals in Town of Bolton is 88 days.
- Guests book furthest in advance for stays during July (average 133 days), likely coinciding with peak travel demand or local events.
- The shortest booking windows occur for stays in February (average 30 days), indicating more last-minute travel plans during this time.
- Seasonally, Summer (120 days avg.) sees the longest lead times, while Winter (45 days avg.) has the shortest, reflecting typical travel planning cycles.
Recommendations for Hosts
- Use the overall average lead time (88 days) as a baseline for your pricing and availability strategy in Town of Bolton.
- For July stays, consider implementing length-of-stay discounts or slightly higher rates for bookings made less than 133 days out to capitalize on advance planning.
- Target marketing efforts for the Summer season well in advance (at least 120 days) to capture early planners.
- Monitor your own booking lead times against these Town of Bolton averages to identify opportunities for dynamic pricing adjustments.
Popular & Essential Airbnb Amenities in Town of Bolton (2026)
Amenity Prevalence
Amenity Insights for Town of Bolton
- Essential amenities in Town of Bolton that guests expect include: Smoke alarm, Wifi, Free parking on premises, Carbon monoxide alarm, Hot water. Lacking these (any) could significantly impact bookings.
- Popular amenities like TV, Air conditioning, Coffee maker are common but not universal. Offering these can provide a competitive edge.
Recommendations for Hosts
- Ensure your listing includes all essential amenities for Town of Bolton: Smoke alarm, Wifi, Free parking on premises, Carbon monoxide alarm, Hot water.
- Prioritize adding missing essentials: Wifi, Free parking on premises, Carbon monoxide alarm, Hot water.
- Consider adding popular differentiators like TV or Air conditioning to increase appeal.
- Highlight unique or less common amenities you offer (e.g., hot tub, dedicated workspace, EV charger) in your listing description and photos.
- Regularly check competitor amenities in Town of Bolton to stay competitive.
Town of Bolton Airbnb Guest Demographics & Profile Analysis (2026)
Guest Profile Summary for Town of Bolton
- The typical guest profile for Airbnb in Town of Bolton consists of primarily domestic travelers (98%), often arriving from nearby New York, typically belonging to the Post-2000s (Gen Z/Alpha) group (50%), primarily speaking English or Spanish.
- Domestic travelers account for 97.8% of guests.
- Key international markets include United States (97.8%) and Canada (0.6%).
- Top languages spoken are English (70.9%) followed by Spanish (12.1%).
- A significant demographic segment is the Post-2000s (Gen Z/Alpha) group, representing 50% of guests.
Recommendations for Hosts
- Target domestic marketing efforts towards travelers from New York and New Jersey.
- Tailor amenities and listing descriptions to appeal to the dominant Post-2000s (Gen Z/Alpha) demographic (e.g., highlight fast WiFi, smart home features, local guides).
- Highlight unique local experiences or amenities relevant to the primary guest profile.
- Consider seasonal promotions aligned with peak travel times for key origin markets.
Nearby Short-Term Rental Market Comparison
How does the Town of Bolton Airbnb market stack up against its neighbors? Compare key performance metrics like average monthly revenue, ADR, and occupancy rates in surrounding areas to understand the broader regional STR landscape.
| Market | Active Properties | Monthly Revenue | Daily Rate | Avg. Occupancy |
|---|---|---|---|---|
| Middletown Springs | 13 | $6,843 | $507.55 | 32% |
| Pomfret | 15 | $6,549 | $502.74 | 45% |
| Fort Ann | 35 | $6,238 | $790.41 | 37% |
| Hanover | 33 | $5,826 | $1189.51 | 41% |
| Town of Ancram | 22 | $5,616 | $512.55 | 38% |
| Town of Schodack | 11 | $5,158 | $555.89 | 29% |
| Town of Stillwater | 55 | $5,153 | $564.54 | 42% |
| Monterey | 41 | $5,089 | $470.60 | 44% |
| Malletts Bay | 51 | $4,842 | $444.86 | 41% |
| Town of Wilton | 103 | $4,841 | $862.83 | 38% |