Town of Bethel Airbnb Market Analysis 2026: Short Term Rental Data & Vacation Rental Statistics in New York, United States
Is Airbnb profitable in Town of Bethel in 2026? Explore comprehensive Airbnb analytics for Town of Bethel, New York, United States to uncover income potential. This 2026 STR market report for Town of Bethel, based on AirROI data from February 2025 to January 2026, reveals key trends in the niche market of 152 active listings.
Whether you're considering an Airbnb investment in Town of Bethel, optimizing your existing vacation rental, or exploring rental arbitrage opportunities, understanding the Town of Bethel Airbnb data is crucial. Understanding the local regulations is key to maximizing your short term rental income potential. Let's dive into the specifics.
Key Town of Bethel Airbnb Performance Metrics Overview
Monthly Airbnb Revenue Variations & Income Potential in Town of Bethel (2026)
Understanding the monthly revenue variations for Airbnb listings in Town of Bethel is key to maximizing your short term rental income potential. Seasonality significantly impacts earnings. Our analysis, based on data from the past 12 months, shows that the peak revenue month for STRs in Town of Bethel is typically August, while April often presents the lowest earnings, highlighting opportunities for strategic pricing adjustments during shoulder and low seasons. Explore the typical Airbnb income in Town of Bethel across different performance tiers:
- Best-in-class properties (Top 10%) achieve $7,705+ monthly, often utilizing dynamic pricing and superior guest experiences.
- Strong performing properties (Top 25%) earn $4,861 or more, indicating effective management and desirable locations/amenities.
- Typical properties (Median) generate around $2,593 per month, representing the average market performance.
- Entry-level properties (Bottom 25%) see earnings around $1,315, often with potential for optimization.
Average Monthly Airbnb Earnings Trend in Town of Bethel
Town of Bethel Airbnb Occupancy Rate Trends (2026)
Maximize your bookings by understanding the Town of Bethel STR occupancy trends. Seasonal demand shifts significantly influence how often properties are booked. Typically, Augustsees the highest demand (peak season occupancy), while January experiences the lowest (low season). Effective strategies, like adjusting minimum stays or offering promotions, can boost occupancy during slower periods. Here's how different property tiers perform in Town of Bethel:
- Best-in-class properties (Top 10%) achieve 70%+ occupancy, indicating high desirability and potentially optimized availability.
- Strong performing properties (Top 25%) maintain 53% or higher occupancy, suggesting good market fit and guest satisfaction.
- Typical properties (Median) have an occupancy rate around 33%.
- Entry-level properties (Bottom 25%) average 17% occupancy, potentially facing higher vacancy.
Average Monthly Occupancy Rate Trend in Town of Bethel
Average Daily Rate (ADR) Airbnb Trends in Town of Bethel (2026)
Effective short term rental pricing strategy in Town of Bethel involves understanding monthly ADR fluctuations. The Average Daily Rate (ADR) for Airbnb in Town of Bethel typically peaks in July and dips lowest during March. Leveraging Airbnb dynamic pricing tools or strategies based on this seasonality can significantly boost revenue. Here's a look at the typical nightly rates achieved:
- Best-in-class properties (Top 10%) command rates of $569+ per night, often due to premium features or locations.
- Strong performing properties (Top 25%) achieve nightly rates of $364 or more.
- Typical properties (Median) charge around $240 per night.
- Entry-level properties (Bottom 25%) earn around $182 per night.
Average Daily Rate (ADR) Trend by Month in Town of Bethel
Get Live Town of Bethel Market Intelligence 👇

Explore Real-time Analytics
Airbnb Seasonality Analysis & Trends in Town of Bethel (2026)
Peak Season (August, July, December)
- Revenue averages $5,264 per month
- Occupancy rates average 44.2%
- Daily rates average $347
Shoulder Season
- Revenue averages $3,494 per month
- Occupancy maintains around 33.8%
- Daily rates hold near $336
Low Season (February, March, April)
- Revenue drops to average $2,748 per month
- Occupancy decreases to average 33.3%
- Daily rates adjust to average $301
Seasonality Insights for Town of Bethel
- The Airbnb seasonality in Town of Bethel shows highly seasonal trends requiring careful strategy. While the sections above show seasonal averages, it's also insightful to look at the extremes:
- During the high season, the absolute peak month showcases Town of Bethel's highest earning potential, with monthly revenues capable of climbing to $6,282, occupancy reaching a high of 52.0%, and ADRs peaking at $357.
- Conversely, the slowest single month of the year, typically falling within the low season, marks the market's lowest point. In this month, revenue might dip to $2,579, occupancy could drop to 29.3%, and ADRs may adjust down to $299.
- Understanding both the seasonal averages and these monthly peaks and troughs in revenue, occupancy, and ADR is crucial for maximizing your Airbnb profit potential in Town of Bethel.
Seasonal Strategies for Maximizing Profit
- Peak Season: Maximize revenue through premium pricing and potentially longer minimum stays. Ensure high availability.
- Low Season: Offer competitive pricing, special promotions (e.g., extended stay discounts), and flexible cancellation policies. Target off-season travelers like remote workers or budget-conscious guests.
- Shoulder Seasons: Implement dynamic pricing that balances peak and low rates. Target weekend travelers or specific events. Offer slightly more flexible terms than peak season.
- Regularly analyze your own performance against these Town of Bethel seasonality benchmarks and adjust your pricing and availability strategy accordingly.
Best Areas for Airbnb Investment in Town of Bethel (2026)
Exploring the top neighborhoods for short-term rentals in Town of Bethel? This section highlights key areas, outlining why they are attractive for hosts and guests, along with notable local attractions. Consider these locations based on your target guest profile and investment strategy.
| Neighborhood / Area | Why Host Here? (Target Guests & Appeal) | Key Attractions & Landmarks |
|---|---|---|
| Kauneonga Lake | A picturesque lake community known for its scenic views and recreational activities. Popular among tourists looking for a serene getaway close to nature with plenty of outdoor activities. | Kauneonga Lake, Sullivan County Park & Lake, Fishing and boating activities, Hiking trails nearby, Local shops and dining options |
| Bethel Woods Center for the Arts | Famous for the original Woodstock Festival, this area attracts music lovers and event-goers all year round, making it a prime location for Airbnb hosts when events are happening. | Bethel Woods Center for the Arts, Woodstock Museum, Live concerts and events, Surrounding nature trails |
| White Lake | A charming community surrounding a beautiful lake, ideal for family vacations and summer retreats, offering numerous water activities. | White Lake, Boating and fishing, Local beaches, Cabin rentals, Hiking opportunities |
| Monticello | The closest urban area with amenities and attractions, appealing to guests looking for both nature and convenience, also hosts various festivals and events throughout the year. | Monticello Casino & Raceway, Local shops and restaurants, Festivals and community events, Nearby hiking trails |
| Smallwood | A quaint community with a rich history and nature-oriented attractions, ideal for guests seeking a peaceful experience away from the hustle and bustle. | Smallwood Bungalows, Lake Areas, Historical landmarks, Secluded hiking paths |
| Swan Lake | A relaxing area with ample lake and outdoor activities, drawing families and groups for weekend getaways. | Swan Lake, Swimming and fishing, Relaxing picnic areas, Nature walks |
| Yulan | An off-the-beaten-path location located within the beautiful Catskills, appealing to guests looking for tranquility and scenic beauty. | River access for kayaking, Hiking and outdoor adventures, Local farms and markets |
| Cochecton | Known for its serene rural charm, coffee shops, and organic farms, this area is great for guests looking for authenticity and a local experience in the Catskills. | Local organic farms, Cochecton Train Station, Nature reserves, Scenic drives |
Understanding Airbnb License Requirements & STR Laws in Town of Bethel (2026)
With 12% of listings showing registration in 2026, understanding potential Airbnb license requirements is crucial in Town of Bethel. Always verify the latest short term rental regulations and Airbnb license requirements directly with local government authorities for Town of Bethel to ensure full compliance before hosting.
(Source: AirROI data, 2026, based on 12% licensed listings)
Top Performing Airbnb Properties in Town of Bethel (2026)
Benchmark your potential! Explore examples of top-performing Airbnb properties in Town of Bethelbased on Trailing Twelve Month (TTM) revenue. Analyze their characteristics, revenue, occupancy rate, and ADR to understand what drives success in this market.
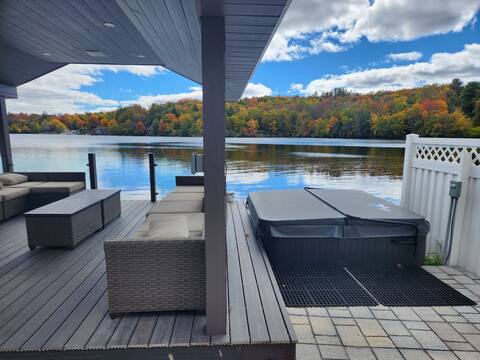
Private Dock/Indoor Pool/Sauna/Hot Tub - Sleeps 14
Entire Place • 6 bedrooms
Welcome to NOBLE NEST!
Entire Place • 9 bedrooms
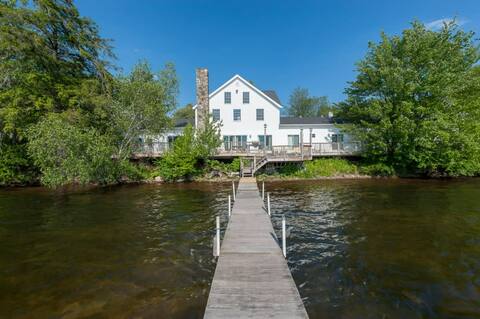
The Homestead Full: Lakefront Fun—Sleeps 28!
Entire Place • 14 bedrooms
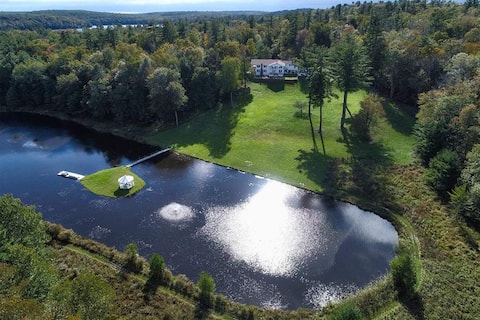
150 acre Luxury Eco-Retreat - Renewable powered!
Entire Place • 8 bedrooms
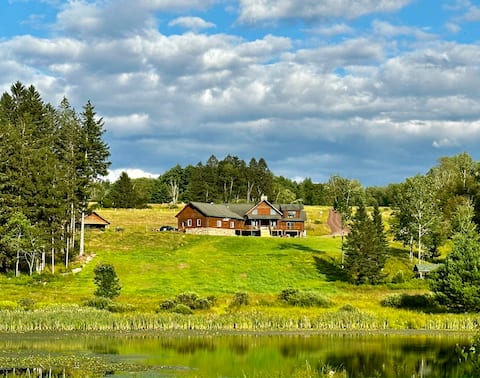
Huge Family/Group Retreat- Sleeps 24 On 16 Acres
Entire Place • 6 bedrooms

Lakefront Villa! Sleeps 14, Hot tub, boats!
Entire Place • 7 bedrooms
Note: Performance varies based on location, size, amenities, seasonality, and management quality. Data reflects the past 12 months.
Top Performing Airbnb Hosts in Town of Bethel (2026)
Learn from the best! This table showcases top-performing Airbnb hosts in Town of Bethel based on the number of properties managed and estimated total revenue over the past year. Analyze their scale and performance metrics.
| Host Name | Properties | Grossing Revenue | Stay Reviews | Avg Rating |
|---|---|---|---|---|
| Red Cottage | 4 | $258,031 | 105 | 4.91/5.0 |
| Olga | 1 | $237,370 | 114 | 4.97/5.0 |
| Iryna | 1 | $208,517 | 16 | 4.38/5.0 |
| Katie | 3 | $171,274 | 96 | 4.94/5.0 |
| Bing | 1 | $122,323 | 33 | 4.94/5.0 |
| Ben | 1 | $121,938 | 64 | 4.91/5.0 |
| Awnna | 1 | $117,054 | 236 | 4.99/5.0 |
| Meghan | 3 | $116,946 | 390 | 4.79/5.0 |
| Sallie | 1 | $106,565 | 47 | 5.00/5.0 |
| Stephanie | 1 | $102,665 | 109 | 4.98/5.0 |
Analyzing the strategies of top hosts, such as their property selection, pricing, and guest communication, can offer valuable lessons for optimizing your own Airbnb operations in Town of Bethel.
Dive Deeper: Advanced Town of Bethel STR Market Data (2026)
Ready to unlock more insights? AirROI provides access to advanced metrics and comprehensive Airbnb data for Town of Bethel. Explore detailed analytics beyond this report to refine your investment strategy, optimize pricing, and maximize your vacation rental profits.
Explore Advanced MetricsTown of Bethel Short-Term Rental Market Composition (2026): Property & Room Types
Room Type Distribution
Property Type Distribution
Market Composition Insights for Town of Bethel
- The Town of Bethel Airbnb market composition is heavily skewed towards Entire Home/Apt listings, which make up 98.7% of the 152 active rentals. This indicates strong guest preference for privacy and space.
- Looking at the property type distribution in Town of Bethel, House properties are the most common (60.5%), reflecting the local real estate landscape.
- Houses represent a significant 60.5% portion, catering likely to families or larger groups.
- Smaller segments like apartment/condo, hotel/boutique, unique stays, others (combined 9.1%) offer potential for unique stay experiences.
Town of Bethel Airbnb Room Capacity Analysis (2026): Bedroom Distribution
Distribution of Listings by Number of Bedrooms
Room Capacity Insights for Town of Bethel
- The dominant room capacity in Town of Bethel is 2 bedrooms listings, making up 33.6% of the market. This suggests a strong demand for properties suitable for couples or solo travelers.
- Together, 2 bedrooms and 3 bedrooms properties represent 59.9% of the active Airbnb listings in Town of Bethel, indicating a high concentration in these sizes.
- A significant 49.4% of listings offer 3+ bedrooms, catering to larger groups and families seeking more space in Town of Bethel.
Town of Bethel Vacation Rental Guest Capacity Trends (2026)
Distribution of Listings by Guest Capacity
Guest Capacity Insights for Town of Bethel
- The most common guest capacity trend in Town of Bethel vacation rentals is listings accommodating 4 guests (30.3%). This suggests the primary traveler segment is likely small families or groups.
- Properties designed for 4 guests and 8+ guests dominate the Town of Bethel STR market, accounting for 60.6% of listings.
- 51.3% of properties accommodate 6+ guests, serving the market segment for larger families or group travel in Town of Bethel.
- On average, properties in Town of Bethel are equipped to host 5.5 guests.
Town of Bethel Airbnb Booking Patterns (2026): Available vs. Booked Days
Available Days Distribution
Booked Days Distribution
Booking Pattern Insights for Town of Bethel
- The most common availability pattern in Town of Bethel falls within the 271-366 days range, representing 53.3% of listings. This suggests many properties have significant open periods on their calendars.
- Approximately 88.2% of listings show high availability (181+ days open annually), indicating potential for increased bookings or specific owner usage patterns.
- For booked days, the 31-90 days range is most frequent in Town of Bethel (36.2%), reflecting common guest stay durations or potential owner blocking patterns.
- A notable 12.5% of properties secure long booking periods (181+ days booked per year), highlighting successful long-term rental strategies or significant owner usage.
Town of Bethel Airbnb Minimum Stay Requirements Analysis
Distribution of Listings by Minimum Night Requirement
1 Night
30 listings
19.7% of total
2 Nights
71 listings
46.7% of total
3 Nights
5 listings
3.3% of total
4-6 Nights
3 listings
2% of total
7-29 Nights
2 listings
1.3% of total
30+ Nights
41 listings
27% of total
Key Insights
- The most prevalent minimum stay requirement in Town of Bethel is 2 Nights, adopted by 46.7% of listings. This highlights the market's preference for shorter, flexible bookings.
- A strong majority (66.4%) of the Town of Bethel Airbnb data shows acceptance of very short stays (1-2 nights), indicating a dynamic, high-turnover market.
- A significant segment (27%) caters to monthly stays (30+ nights) in Town of Bethel, pointing to opportunities in the extended-stay market.
Recommendations
- Align with the market by considering a 2 Nights minimum stay, as 46.7% of Town of Bethel hosts use this setting.
- If feasible, allowing 1-night stays, especially midweek or during low season, could capture last-minute bookings, as only 19.7% currently do.
- A 2-night minimum appears standard (46.7%). Consider this for weekends or peak periods.
- Explore offering discounts for stays of 30+ nights to attract the 27% of the market seeking extended stays.
- Adjust minimum nights based on seasonality – potentially shorter during low season and longer during peak demand periods in Town of Bethel.
Town of Bethel Airbnb Cancellation Policy Trends Analysis (2026)
Limited
7 listings
4.6% of total
Super Strict 30 Days
1 listings
0.7% of total
Flexible
19 listings
12.5% of total
Moderate
40 listings
26.3% of total
Firm
73 listings
48% of total
Strict
12 listings
7.9% of total
Cancellation Policy Insights for Town of Bethel
- The prevailing Airbnb cancellation policy trend in Town of Bethel is Firm, used by 48% of listings.
- A majority (55.9%) of hosts in Town of Bethel utilize Firm or Strict policies, indicating a market where hosts prioritize booking security.
- Strict cancellation policies are quite rare (7.9%), potentially making listings with this policy less competitive unless justified by high demand or property type.
Recommendations for Hosts
- Consider adopting a Firm policy to align with the 48% market standard in Town of Bethel.
- Using a Strict policy might deter some guests, as only 7.9% of listings use it. Evaluate if potential revenue protection outweighs possible lower booking rates.
- Regularly review your cancellation policy against competitors and market demand shifts in Town of Bethel.
Town of Bethel STR Booking Lead Time Analysis (2026)
Average Booking Lead Time by Month
Booking Lead Time Insights for Town of Bethel
- The overall average booking lead time for vacation rentals in Town of Bethel is 45 days.
- Guests book furthest in advance for stays during August (average 62 days), likely coinciding with peak travel demand or local events.
- The shortest booking windows occur for stays in January (average 22 days), indicating more last-minute travel plans during this time.
- Seasonally, Summer (57 days avg.) sees the longest lead times, while Winter (28 days avg.) has the shortest, reflecting typical travel planning cycles.
Recommendations for Hosts
- Use the overall average lead time (45 days) as a baseline for your pricing and availability strategy in Town of Bethel.
- For August stays, consider implementing length-of-stay discounts or slightly higher rates for bookings made less than 62 days out to capitalize on advance planning.
- Target marketing efforts for the Summer season well in advance (at least 57 days) to capture early planners.
- Monitor your own booking lead times against these Town of Bethel averages to identify opportunities for dynamic pricing adjustments.
Popular & Essential Airbnb Amenities in Town of Bethel (2026)
Amenity Prevalence
Amenity Insights for Town of Bethel
- Essential amenities in Town of Bethel that guests expect include: Wifi, Free parking on premises, Smoke alarm, Kitchen. Lacking these (any) could significantly impact bookings.
- Popular amenities like Hot water, Heating, TV are common but not universal. Offering these can provide a competitive edge.
Recommendations for Hosts
- Ensure your listing includes all essential amenities for Town of Bethel: Wifi, Free parking on premises, Smoke alarm, Kitchen.
- Prioritize adding missing essentials: Wifi, Free parking on premises, Smoke alarm, Kitchen.
- Consider adding popular differentiators like Hot water or Heating to increase appeal.
- Highlight unique or less common amenities you offer (e.g., hot tub, dedicated workspace, EV charger) in your listing description and photos.
- Regularly check competitor amenities in Town of Bethel to stay competitive.
Town of Bethel Airbnb Guest Demographics & Profile Analysis (2026)
Guest Profile Summary for Town of Bethel
- The typical guest profile for Airbnb in Town of Bethel consists of primarily domestic travelers (97%), often arriving from nearby New York, typically belonging to the Post-2000s (Gen Z/Alpha) group (50%), primarily speaking English or Spanish.
- Domestic travelers account for 96.9% of guests.
- Key international markets include United States (96.9%) and DC (0.5%).
- Top languages spoken are English (63.4%) followed by Spanish (14.5%).
- A significant demographic segment is the Post-2000s (Gen Z/Alpha) group, representing 50% of guests.
Recommendations for Hosts
- Target domestic marketing efforts towards travelers from New York and Philadelphia.
- Tailor amenities and listing descriptions to appeal to the dominant Post-2000s (Gen Z/Alpha) demographic (e.g., highlight fast WiFi, smart home features, local guides).
- Highlight unique local experiences or amenities relevant to the primary guest profile.
- Consider seasonal promotions aligned with peak travel times for key origin markets.
Nearby Short-Term Rental Market Comparison
How does the Town of Bethel Airbnb market stack up against its neighbors? Compare key performance metrics like average monthly revenue, ADR, and occupancy rates in surrounding areas to understand the broader regional STR landscape.
| Market | Active Properties | Monthly Revenue | Daily Rate | Avg. Occupancy |
|---|---|---|---|---|
| Freeland | 11 | $8,436 | $684.29 | 42% |
| Berlin Township | 15 | $7,208 | $729.10 | 35% |
| Town of Kingston | 10 | $6,470 | $473.76 | 49% |
| Frankford Township | 11 | $6,329 | $505.19 | 41% |
| Spring Lake Heights | 16 | $5,785 | $725.20 | 40% |
| Stroud Township | 137 | $5,728 | $478.40 | 40% |
| Town of Monroe | 22 | $5,690 | $720.52 | 37% |
| Town of Ancram | 22 | $5,616 | $512.55 | 38% |
| Hilltown Township | 11 | $5,557 | $578.96 | 40% |
| Mount Pocono | 22 | $5,346 | $485.18 | 45% |