Naples Airbnb Market Analysis 2026: Short Term Rental Data & Vacation Rental Statistics in New York, United States
Is Airbnb profitable in Naples in 2026? Explore comprehensive Airbnb analytics for Naples, New York, United States to uncover income potential. This 2026 STR market report for Naples, based on AirROI data from February 2025 to January 2026, reveals key trends in the niche market of 27 active listings.
Whether you're considering an Airbnb investment in Naples, optimizing your existing vacation rental, or exploring rental arbitrage opportunities, understanding the Naples Airbnb data is crucial. Leveraging the low regulation environment is key to maximizing your short term rental income potential. Let's dive into the specifics.
Key Naples Airbnb Performance Metrics Overview
Monthly Airbnb Revenue Variations & Income Potential in Naples (2026)
Understanding the monthly revenue variations for Airbnb listings in Naples is key to maximizing your short term rental income potential. Seasonality significantly impacts earnings. Our analysis, based on data from the past 12 months, shows that the peak revenue month for STRs in Naples is typically July, while December often presents the lowest earnings, highlighting opportunities for strategic pricing adjustments during shoulder and low seasons. Explore the typical Airbnb income in Naples across different performance tiers:
- Best-in-class properties (Top 10%) achieve $9,325+ monthly, often utilizing dynamic pricing and superior guest experiences.
- Strong performing properties (Top 25%) earn $6,215 or more, indicating effective management and desirable locations/amenities.
- Typical properties (Median) generate around $3,627 per month, representing the average market performance.
- Entry-level properties (Bottom 25%) see earnings around $2,152, often with potential for optimization.
Average Monthly Airbnb Earnings Trend in Naples
Naples Airbnb Occupancy Rate Trends (2026)
Maximize your bookings by understanding the Naples STR occupancy trends. Seasonal demand shifts significantly influence how often properties are booked. Typically, Augustsees the highest demand (peak season occupancy), while December experiences the lowest (low season). Effective strategies, like adjusting minimum stays or offering promotions, can boost occupancy during slower periods. Here's how different property tiers perform in Naples:
- Best-in-class properties (Top 10%) achieve 71%+ occupancy, indicating high desirability and potentially optimized availability.
- Strong performing properties (Top 25%) maintain 55% or higher occupancy, suggesting good market fit and guest satisfaction.
- Typical properties (Median) have an occupancy rate around 36%.
- Entry-level properties (Bottom 25%) average 24% occupancy, potentially facing higher vacancy.
Average Monthly Occupancy Rate Trend in Naples
Average Daily Rate (ADR) Airbnb Trends in Naples (2026)
Effective short term rental pricing strategy in Naples involves understanding monthly ADR fluctuations. The Average Daily Rate (ADR) for Airbnb in Naples typically peaks in July and dips lowest during March. Leveraging Airbnb dynamic pricing tools or strategies based on this seasonality can significantly boost revenue. Here's a look at the typical nightly rates achieved:
- Best-in-class properties (Top 10%) command rates of $1,408+ per night, often due to premium features or locations.
- Strong performing properties (Top 25%) achieve nightly rates of $565 or more.
- Typical properties (Median) charge around $362 per night.
- Entry-level properties (Bottom 25%) earn around $227 per night.
Average Daily Rate (ADR) Trend by Month in Naples
Get Live Naples Market Intelligence 👇

Explore Real-time Analytics
Airbnb Seasonality Analysis & Trends in Naples (2026)
Peak Season (July, August, June)
- Revenue averages $7,976 per month
- Occupancy rates average 53.5%
- Daily rates average $535
Shoulder Season
- Revenue averages $4,073 per month
- Occupancy maintains around 37.1%
- Daily rates hold near $503
Low Season (February, November, December)
- Revenue drops to average $2,968 per month
- Occupancy decreases to average 32.4%
- Daily rates adjust to average $480
Seasonality Insights for Naples
- The Airbnb seasonality in Naples shows highly seasonal trends requiring careful strategy. While the sections above show seasonal averages, it's also insightful to look at the extremes:
- During the high season, the absolute peak month showcases Naples's highest earning potential, with monthly revenues capable of climbing to $8,887, occupancy reaching a high of 59.4%, and ADRs peaking at $538.
- Conversely, the slowest single month of the year, typically falling within the low season, marks the market's lowest point. In this month, revenue might dip to $2,957, occupancy could drop to 27.9%, and ADRs may adjust down to $471.
- Understanding both the seasonal averages and these monthly peaks and troughs in revenue, occupancy, and ADR is crucial for maximizing your Airbnb profit potential in Naples.
Seasonal Strategies for Maximizing Profit
- Peak Season: Maximize revenue through premium pricing and potentially longer minimum stays. Ensure high availability.
- Low Season: Offer competitive pricing, special promotions (e.g., extended stay discounts), and flexible cancellation policies. Target off-season travelers like remote workers or budget-conscious guests.
- Shoulder Seasons: Implement dynamic pricing that balances peak and low rates. Target weekend travelers or specific events. Offer slightly more flexible terms than peak season.
- Regularly analyze your own performance against these Naples seasonality benchmarks and adjust your pricing and availability strategy accordingly.
Best Areas for Airbnb Investment in Naples (2026)
Exploring the top neighborhoods for short-term rentals in Naples? This section highlights key areas, outlining why they are attractive for hosts and guests, along with notable local attractions. Consider these locations based on your target guest profile and investment strategy.
| Neighborhood / Area | Why Host Here? (Target Guests & Appeal) | Key Attractions & Landmarks |
|---|---|---|
| Downtown Naples | Vibrant area known for its shopping, dining, and entertainment options. Popular among tourists seeking a lively atmosphere with close proximity to the beach. | Tin City, 5th Avenue South, Naples Pier, Naples Botanical Garden, Coconut Point Mall |
| Old Naples | Historic charm with beautiful beaches and upscale dining. Attracts visitors looking for a quaint and picturesque environment with a rich history. | Naples Beach, Naples Historical Society, Fifth Avenue South shops, Artis-Naples, Lowdermilk Beach Park |
| Pelican Bay | Luxury community known for its stunning beaches and high-end amenities. Appeals to affluent travelers seeking relaxation and comfort in a resort-like setting. | Pelican Bay Beach, The Club at Pelican Bay, Artis-Naples, Local Gulf Coast restaurants, Vanderbilt Beach |
| North Naples | Family-friendly area with parks, beaches, and great schools. Perfect for family trips and those wanting a quieter atmosphere while still enjoying local attractions. | Delnor-Wiggins Pass State Park, North Collier Regional Park, Naples Philharmonic, Mercato shops, Vanderbilt Beach |
| The Moorings | Quiet, upscale residential area known for its waterfront properties and luxury homes. Ideal for those looking for peaceful surroundings with access to the beach. | The Moorings Beach Club, Naples Beach, Waterside Shops, The Naples Players, The Botanical Gardens |
| East Naples | Conveniently located near shopping and golfing, this area is ideal for budget-conscious travelers looking for access to Naples’ attractions without the premium prices. | East Naples Community Park, Royal Palm Country Club, Coastland Center Mall, Naples Zoo, Riverside Park |
| Golden Gate | An emerging area offering affordable housing options, popular with families and locals. A great starting point for discovering Naples without breaking the bank. | Golden Gate Community Park, Naples Botanical Garden, Shady Acres, Mediation Garden, Local markets and shops |
| Fifth Avenue South | Iconic street in Naples filled with upscale shops, restaurants, and art galleries. Attracts visitors looking for an upscale shopping and dining experience in a beautiful setting. | Cafes and Restaurants, Art Galleries, Public Art Displays, Shopping Boutiques, Live Music Venues |
Understanding Airbnb License Requirements & STR Laws in Naples (2026)
While Naples, New York, United States currently shows low STR regulations, specific Airbnb license requirements might still exist or change. Always verify the latest short term rental regulations and Airbnb license requirements directly with local government authorities for Naples to ensure full compliance before hosting.
(Source: AirROI data, 2026, finding no licensed listings among those analyzed)
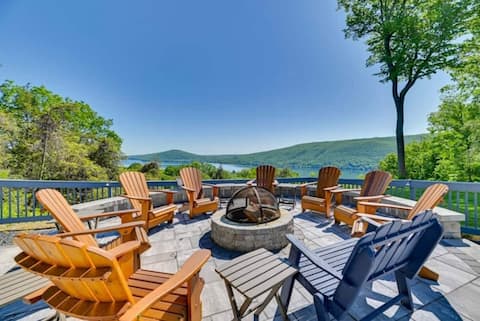
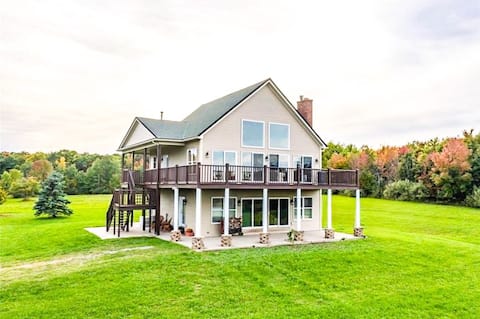
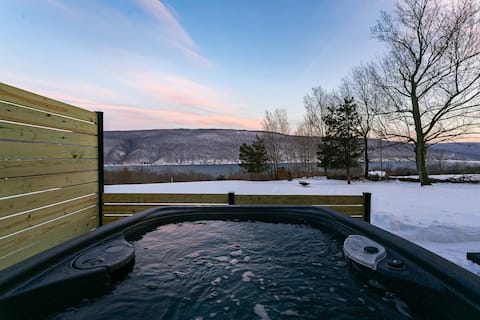
Top Performing Airbnb Properties in Naples (2026)
Benchmark your potential! Explore examples of top-performing Airbnb properties in Naplesbased on Trailing Twelve Month (TTM) revenue. Analyze their characteristics, revenue, occupancy rate, and ADR to understand what drives success in this market.
153) Finger Lakes - Lake View Home Near Ski Resort
Entire Place • 9 bedrooms

Lake View w/Pool, HotTub, & Fast Wi-Fi
Entire Place • 3 bedrooms
Lakeviews, hot tub, fireplace, peace & quiet
Entire Place • 3 bedrooms

Lakefront | Dock | Hot Tub | Near Boat Launch
Entire Place • 2 bedrooms

Minutes to Bristol Mountain, Wineries, Canandaigua
Entire Place • 4 bedrooms
The Lakeview Chalet: Cozy & Chic, Hot Tub, Games
Entire Place • 2 bedrooms
Note: Performance varies based on location, size, amenities, seasonality, and management quality. Data reflects the past 12 months.
Top Performing Airbnb Hosts in Naples (2026)
Learn from the best! This table showcases top-performing Airbnb hosts in Naples based on the number of properties managed and estimated total revenue over the past year. Analyze their scale and performance metrics.
| Host Name | Properties | Grossing Revenue | Stay Reviews | Avg Rating |
|---|---|---|---|---|
| Traverse | 1 | $164,391 | 9 | 5.00/5.0 |
| Vibe | 2 | $101,307 | 17 | 4.96/5.0 |
| Annie | 1 | $77,994 | 20 | 4.85/5.0 |
| Evolve | 2 | $77,089 | 117 | 4.92/5.0 |
| Kelly | 1 | $76,349 | 58 | 5.00/5.0 |
| William | 1 | $63,418 | 22 | 4.86/5.0 |
| FLX Collective | 1 | $63,299 | 142 | 4.97/5.0 |
| Galina | 1 | $59,288 | 160 | 4.99/5.0 |
| Kaycie J Properties LLC | 1 | $55,138 | 47 | 4.70/5.0 |
| Ben & Walt | 1 | $55,061 | 119 | 4.97/5.0 |
Analyzing the strategies of top hosts, such as their property selection, pricing, and guest communication, can offer valuable lessons for optimizing your own Airbnb operations in Naples.
Dive Deeper: Advanced Naples STR Market Data (2026)
Ready to unlock more insights? AirROI provides access to advanced metrics and comprehensive Airbnb data for Naples. Explore detailed analytics beyond this report to refine your investment strategy, optimize pricing, and maximize your vacation rental profits.
Explore Advanced MetricsNaples Short-Term Rental Market Composition (2026): Property & Room Types
Room Type Distribution
Property Type Distribution
Market Composition Insights for Naples
- The Naples Airbnb market composition is heavily skewed towards Entire Home/Apt listings, which make up 100% of the 27 active rentals. This indicates strong guest preference for privacy and space.
- Looking at the property type distribution in Naples, House properties are the most common (63%), reflecting the local real estate landscape.
- Houses represent a significant 63% portion, catering likely to families or larger groups.
- Smaller segments like hotel/boutique, apartment/condo (combined 7.4%) offer potential for unique stay experiences.
Naples Airbnb Room Capacity Analysis (2026): Bedroom Distribution
Distribution of Listings by Number of Bedrooms
Room Capacity Insights for Naples
- The dominant room capacity in Naples is 3 bedrooms listings, making up 33.3% of the market. This suggests a strong demand for properties suitable for families or small groups.
- Together, 3 bedrooms and 4 bedrooms properties represent 55.5% of the active Airbnb listings in Naples, indicating a high concentration in these sizes.
- A significant 59.2% of listings offer 3+ bedrooms, catering to larger groups and families seeking more space in Naples.
Naples Vacation Rental Guest Capacity Trends (2026)
Distribution of Listings by Guest Capacity
Guest Capacity Insights for Naples
- The most common guest capacity trend in Naples vacation rentals is listings accommodating 8+ guests (37%). This suggests the primary traveler segment is likely larger groups.
- Properties designed for 8+ guests and 6 guests dominate the Naples STR market, accounting for 59.2% of listings.
- 62.9% of properties accommodate 6+ guests, serving the market segment for larger families or group travel in Naples.
- On average, properties in Naples are equipped to host 5.8 guests.
Naples Airbnb Booking Patterns (2026): Available vs. Booked Days
Available Days Distribution
Booked Days Distribution
Booking Pattern Insights for Naples
- The most common availability pattern in Naples falls within the 271-366 days range, representing 44.4% of listings. This suggests many properties have significant open periods on their calendars.
- Approximately 81.4% of listings show high availability (181+ days open annually), indicating potential for increased bookings or specific owner usage patterns.
- For booked days, the 91-180 days range is most frequent in Naples (37%), reflecting common guest stay durations or potential owner blocking patterns.
- A notable 22.2% of properties secure long booking periods (181+ days booked per year), highlighting successful long-term rental strategies or significant owner usage.
Naples Airbnb Minimum Stay Requirements Analysis
Distribution of Listings by Minimum Night Requirement
1 Night
3 listings
11.1% of total
2 Nights
8 listings
29.6% of total
3 Nights
2 listings
7.4% of total
4-6 Nights
1 listings
3.7% of total
7-29 Nights
1 listings
3.7% of total
30+ Nights
12 listings
44.4% of total
Key Insights
- The most prevalent minimum stay requirement in Naples is 30+ Nights, adopted by 44.4% of listings. This highlights the market's preference for longer commitments.
- A significant segment (44.4%) caters to monthly stays (30+ nights) in Naples, pointing to opportunities in the extended-stay market.
Recommendations
- Align with the market by considering a 30+ Nights minimum stay, as 44.4% of Naples hosts use this setting.
- If feasible, allowing 1-night stays, especially midweek or during low season, could capture last-minute bookings, as only 11.1% currently do.
- Explore offering discounts for stays of 30+ nights to attract the 44.4% of the market seeking extended stays.
- Adjust minimum nights based on seasonality – potentially shorter during low season and longer during peak demand periods in Naples.
Naples Airbnb Cancellation Policy Trends Analysis (2026)
Super Strict 60 Days
1 listings
3.7% of total
Flexible
5 listings
18.5% of total
Moderate
5 listings
18.5% of total
Firm
12 listings
44.4% of total
Strict
4 listings
14.8% of total
Cancellation Policy Insights for Naples
- The prevailing Airbnb cancellation policy trend in Naples is Firm, used by 44.4% of listings.
- A majority (59.2%) of hosts in Naples utilize Firm or Strict policies, indicating a market where hosts prioritize booking security.
Recommendations for Hosts
- Consider adopting a Firm policy to align with the 44.4% market standard in Naples.
- Using a Strict policy might deter some guests, as only 14.8% of listings use it. Evaluate if potential revenue protection outweighs possible lower booking rates.
- Regularly review your cancellation policy against competitors and market demand shifts in Naples.
Naples STR Booking Lead Time Analysis (2026)
Average Booking Lead Time by Month
Booking Lead Time Insights for Naples
- The overall average booking lead time for vacation rentals in Naples is 53 days.
- Guests book furthest in advance for stays during July (average 69 days), likely coinciding with peak travel demand or local events.
- The shortest booking windows occur for stays in March (average 23 days), indicating more last-minute travel plans during this time.
- Seasonally, Summer (60 days avg.) sees the longest lead times, while Spring (41 days avg.) has the shortest, reflecting typical travel planning cycles.
Recommendations for Hosts
- Use the overall average lead time (53 days) as a baseline for your pricing and availability strategy in Naples.
- For July stays, consider implementing length-of-stay discounts or slightly higher rates for bookings made less than 69 days out to capitalize on advance planning.
- Target marketing efforts for the Summer season well in advance (at least 60 days) to capture early planners.
- Monitor your own booking lead times against these Naples averages to identify opportunities for dynamic pricing adjustments.
Popular & Essential Airbnb Amenities in Naples (2026)
Amenity Prevalence
Amenity Insights for Naples
- Essential amenities in Naples that guests expect include: Free parking on premises, Fire extinguisher, Kitchen, Smoke alarm, Dishes and silverware, Carbon monoxide alarm. Lacking these (any) could significantly impact bookings.
- Popular amenities like Hot water, Coffee maker, TV are common but not universal. Offering these can provide a competitive edge.
Recommendations for Hosts
- Ensure your listing includes all essential amenities for Naples: Free parking on premises, Fire extinguisher, Kitchen, Smoke alarm, Dishes and silverware, Carbon monoxide alarm.
- Prioritize adding missing essentials: Dishes and silverware, Carbon monoxide alarm.
- Consider adding popular differentiators like Hot water or Coffee maker to increase appeal.
- Highlight unique or less common amenities you offer (e.g., hot tub, dedicated workspace, EV charger) in your listing description and photos.
- Regularly check competitor amenities in Naples to stay competitive.
Naples Airbnb Guest Demographics & Profile Analysis (2026)
Guest Profile Summary for Naples
- The typical guest profile for Airbnb in Naples consists of primarily domestic travelers (91%), often arriving from nearby Rochester, typically belonging to the Post-2000s (Gen Z/Alpha) group (50%), primarily speaking English or Spanish.
- Domestic travelers account for 91.4% of guests.
- Key international markets include United States (91.4%) and Canada (3.6%).
- Top languages spoken are English (84%) followed by Spanish (2.7%).
- A significant demographic segment is the Post-2000s (Gen Z/Alpha) group, representing 50% of guests.
Recommendations for Hosts
- Target domestic marketing efforts towards travelers from Rochester and New York.
- Tailor amenities and listing descriptions to appeal to the dominant Post-2000s (Gen Z/Alpha) demographic (e.g., highlight fast WiFi, smart home features, local guides).
- Highlight unique local experiences or amenities relevant to the primary guest profile.
- Consider seasonal promotions aligned with peak travel times for key origin markets.
Nearby Short-Term Rental Market Comparison
How does the Naples Airbnb market stack up against its neighbors? Compare key performance metrics like average monthly revenue, ADR, and occupancy rates in surrounding areas to understand the broader regional STR landscape.
| Market | Active Properties | Monthly Revenue | Daily Rate | Avg. Occupancy |
|---|---|---|---|---|
| Town of Torrey | 34 | $5,535 | $437.35 | 50% |
| Rushville | 16 | $5,126 | $656.66 | 41% |
| Town of Mansfield | 61 | $4,782 | $517.31 | 32% |
| Town of Otisco | 22 | $4,749 | $417.83 | 43% |
| Foster Township | 22 | $4,725 | $499.51 | 37% |
| Town of Porter | 22 | $4,724 | $331.03 | 54% |
| Town of Canandaigua | 79 | $4,714 | $488.13 | 42% |
| Town of Fayette | 59 | $4,659 | $407.20 | 42% |
| Town of Skaneateles | 68 | $4,507 | $498.14 | 42% |
| Eldred Township | 11 | $4,386 | $482.25 | 38% |