Hampton Bays Airbnb Market Analysis 2026: Short Term Rental Data & Vacation Rental Statistics in New York, United States
Is Airbnb profitable in Hampton Bays in 2026? Explore comprehensive Airbnb analytics for Hampton Bays, New York, United States to uncover income potential. This 2026 STR market report for Hampton Bays, based on AirROI data from February 2025 to January 2026, reveals key trends in the niche market of 32 active listings.
Whether you're considering an Airbnb investment in Hampton Bays, optimizing your existing vacation rental, or exploring rental arbitrage opportunities, understanding the Hampton Bays Airbnb data is crucial. Leveraging the low regulation environment is key to maximizing your short term rental income potential. Let's dive into the specifics.
Key Hampton Bays Airbnb Performance Metrics Overview
Monthly Airbnb Revenue Variations & Income Potential in Hampton Bays (2026)
Understanding the monthly revenue variations for Airbnb listings in Hampton Bays is key to maximizing your short term rental income potential. Seasonality significantly impacts earnings. Our analysis, based on data from the past 12 months, shows that the peak revenue month for STRs in Hampton Bays is typically July, while May often presents the lowest earnings, highlighting opportunities for strategic pricing adjustments during shoulder and low seasons. Explore the typical Airbnb income in Hampton Bays across different performance tiers:
- Best-in-class properties (Top 10%) achieve $17,335+ monthly, often utilizing dynamic pricing and superior guest experiences.
- Strong performing properties (Top 25%) earn $7,473 or more, indicating effective management and desirable locations/amenities.
- Typical properties (Median) generate around $4,099 per month, representing the average market performance.
- Entry-level properties (Bottom 25%) see earnings around $2,042, often with potential for optimization.
Average Monthly Airbnb Earnings Trend in Hampton Bays
Hampton Bays Airbnb Occupancy Rate Trends (2026)
Maximize your bookings by understanding the Hampton Bays STR occupancy trends. Seasonal demand shifts significantly influence how often properties are booked. Typically, Junesees the highest demand (peak season occupancy), while May experiences the lowest (low season). Effective strategies, like adjusting minimum stays or offering promotions, can boost occupancy during slower periods. Here's how different property tiers perform in Hampton Bays:
- Best-in-class properties (Top 10%) achieve 58%+ occupancy, indicating high desirability and potentially optimized availability.
- Strong performing properties (Top 25%) maintain 43% or higher occupancy, suggesting good market fit and guest satisfaction.
- Typical properties (Median) have an occupancy rate around 23%.
- Entry-level properties (Bottom 25%) average 12% occupancy, potentially facing higher vacancy.
Average Monthly Occupancy Rate Trend in Hampton Bays
Average Daily Rate (ADR) Airbnb Trends in Hampton Bays (2026)
Effective short term rental pricing strategy in Hampton Bays involves understanding monthly ADR fluctuations. The Average Daily Rate (ADR) for Airbnb in Hampton Bays typically peaks in July and dips lowest during January. Leveraging Airbnb dynamic pricing tools or strategies based on this seasonality can significantly boost revenue. Here's a look at the typical nightly rates achieved:
- Best-in-class properties (Top 10%) command rates of $1,791+ per night, often due to premium features or locations.
- Strong performing properties (Top 25%) achieve nightly rates of $851 or more.
- Typical properties (Median) charge around $451 per night.
- Entry-level properties (Bottom 25%) earn around $353 per night.
Average Daily Rate (ADR) Trend by Month in Hampton Bays
Get Live Hampton Bays Market Intelligence 👇
Explore Real-time Analytics
Airbnb Seasonality Analysis & Trends in Hampton Bays (2026)
Peak Season (July, June, August)
- Revenue averages $9,746 per month
- Occupancy rates average 39.1%
- Daily rates average $864
Shoulder Season
- Revenue averages $5,121 per month
- Occupancy maintains around 24.4%
- Daily rates hold near $614
Low Season (February, March, April)
- Revenue drops to average $0 per month
- Occupancy decreases to average 0.0%
- Daily rates adjust to average $803
Seasonality Insights for Hampton Bays
- The Airbnb seasonality in Hampton Bays shows highly seasonal trends requiring careful strategy. While the sections above show seasonal averages, it's also insightful to look at the extremes:
- During the high season, the absolute peak month showcases Hampton Bays's highest earning potential, with monthly revenues capable of climbing to $10,999, occupancy reaching a high of 43.2%, and ADRs peaking at $913.
- Conversely, the slowest single month of the year, typically falling within the low season, marks the market's lowest point. In this month, revenue might dip to $0, occupancy could drop to 0.0%, and ADRs may adjust down to $534.
- Understanding both the seasonal averages and these monthly peaks and troughs in revenue, occupancy, and ADR is crucial for maximizing your Airbnb profit potential in Hampton Bays.
Seasonal Strategies for Maximizing Profit
- Peak Season: Maximize revenue through premium pricing and potentially longer minimum stays. Ensure high availability.
- Low Season: Offer competitive pricing, special promotions (e.g., extended stay discounts), and flexible cancellation policies. Target off-season travelers like remote workers or budget-conscious guests.
- Shoulder Seasons: Implement dynamic pricing that balances peak and low rates. Target weekend travelers or specific events. Offer slightly more flexible terms than peak season.
- Regularly analyze your own performance against these Hampton Bays seasonality benchmarks and adjust your pricing and availability strategy accordingly.
Best Areas for Airbnb Investment in Hampton Bays (2026)
Exploring the top neighborhoods for short-term rentals in Hampton Bays? This section highlights key areas, outlining why they are attractive for hosts and guests, along with notable local attractions. Consider these locations based on your target guest profile and investment strategy.
| Neighborhood / Area | Why Host Here? (Target Guests & Appeal) | Key Attractions & Landmarks |
|---|---|---|
| Southampton | Charming village known for its pristine beaches, historic homes, and upscale shopping. A popular destination for affluent tourists, especially during the summer months. | Cooper's Beach, Southampton Village, Shinnecock Hills Golf Club, Sebonack Golf Club, Southampton Arts Center |
| Westhampton Beach | A picturesque coastal village with a vibrant arts scene and beautiful waterfront. It attracts tourists looking for a quaint beach experience with events throughout the summer. | Westhampton Beach Performing Arts Center, Pike's Beach, Main Street shopping, Westhampton History Museum, Dune Road |
| East Quogue | A family-friendly community with a relaxed atmosphere, offering access to some beautiful beaches. It’s a great option for families looking to escape the city. | Pond View Park, East Quogue Village Beach, Quogue Wildlife Refuge, The Dunes at Quogue |
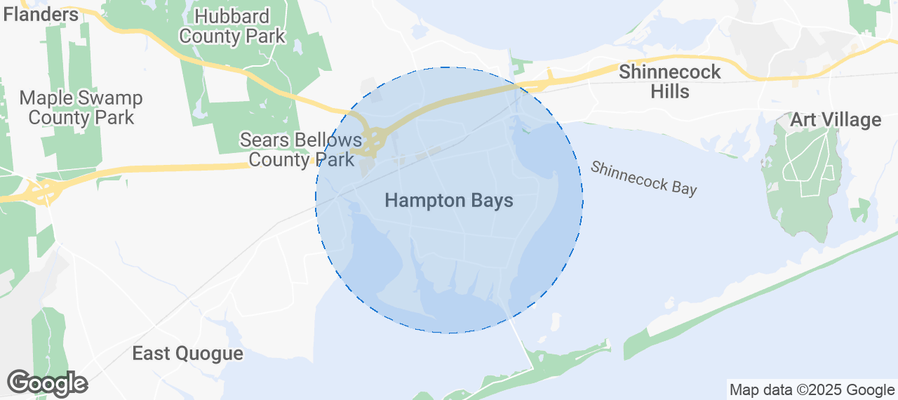
| Hampton Bays | Known for its stunning bay views and proximity to the ocean. Ideal for water sports enthusiasts and those looking to relax by the beach. | Shinnecock Bay, Tiana Beach, Ponquogue Beach, Canal Beach, Hampton Bays Marina |
| North Sea | A secluded area surrounded by nature and waters, appealing to those who enjoy outdoor activities like hiking and fishing. Offers a peaceful retreat. | North Sea Park, Little Peconic Bay, Kennebunk Pond, Glover's Pond |
| Remsenburg-Speonk | A quaint hamlet known for its spacious properties and proximity to both the bay and ocean beaches. Perfect for those looking for a laid-back, residential vibe with local charm. | Speonk River, Remsenburg Beach, Robert B. Sweeney Park, The Speonk-Remsenburg Community Center |
| Montauk | A bit further east, Montauk is famous for its beaches, surfing, and vibrant nightlife. It draws a younger crowd and is known for its energetic summer atmosphere. | Montauk Point Lighthouse, Ditch Plains Beach, Kirk Park Beach, Montauk Brewing Company, Camp Hero State Park |
| Sag Harbor | A historic maritime village with beautiful homes and a rich cultural history. Attractive for tourists seeking a unique blend of art, food, and relaxation. | Sag Harbor Whaling Museum, Haven's Beach, Sag Harbor Cinema, Mashashimuet Park, Long Island Maritime Museum |
Understanding Airbnb License Requirements & STR Laws in Hampton Bays (2026)
While Hampton Bays, New York, United States currently shows low STR regulations, specific Airbnb license requirements might still exist or change. Always verify the latest short term rental regulations and Airbnb license requirements directly with local government authorities for Hampton Bays to ensure full compliance before hosting.
(Source: AirROI data, 2026, finding no licensed listings among those analyzed)
Top Performing Airbnb Properties in Hampton Bays (2026)
Benchmark your potential! Explore examples of top-performing Airbnb properties in Hampton Baysbased on Trailing Twelve Month (TTM) revenue. Analyze their characteristics, revenue, occupancy rate, and ADR to understand what drives success in this market.

Luxury Home With Stunning Views
Entire Place • 5 bedrooms

Hampton Bays Modern Beach House
Entire Place • N/A

4BR/4BA: Water views, pool table, outdoor dining
Entire Place • 4 bedrooms

Hamptons Home with Bay Beach Access
Entire Place • 4 bedrooms

Chic Hampton Bays escape; private pool, sundeck
Entire Place • 4 bedrooms
Seabreeze #4: Charming Cottage Footsteps to Beach
Entire Place • 2 bedrooms
Note: Performance varies based on location, size, amenities, seasonality, and management quality. Data reflects the past 12 months.
Top Performing Airbnb Hosts in Hampton Bays (2026)
Learn from the best! This table showcases top-performing Airbnb hosts in Hampton Bays based on the number of properties managed and estimated total revenue over the past year. Analyze their scale and performance metrics.
| Host Name | Properties | Grossing Revenue | Stay Reviews | Avg Rating |
|---|---|---|---|---|
| StayMarquis | 4 | $283,626 | 10 | 4.89/5.0 |
| Jean Marc | 1 | $193,584 | 5 | 4.80/5.0 |
| The Drake Inn | 15 | $180,177 | 60 | 4.64/5.0 |
| Jessica | 1 | $141,484 | 4 | 5.00/5.0 |
| A J | 2 | $124,187 | 51 | 4.76/5.0 |
| Kristen | 1 | $86,206 | 6 | 5.00/5.0 |
| Alex And Regina | 1 | $52,553 | 18 | 5.00/5.0 |
| Sean | 1 | $40,033 | 17 | 5.00/5.0 |
| Elias | 1 | $35,167 | 26 | 5.00/5.0 |
| Estefania | 1 | $35,038 | 2 | Not Rated |
Analyzing the strategies of top hosts, such as their property selection, pricing, and guest communication, can offer valuable lessons for optimizing your own Airbnb operations in Hampton Bays.
Dive Deeper: Advanced Hampton Bays STR Market Data (2026)
Ready to unlock more insights? AirROI provides access to advanced metrics and comprehensive Airbnb data for Hampton Bays. Explore detailed analytics beyond this report to refine your investment strategy, optimize pricing, and maximize your vacation rental profits.
Explore Advanced MetricsHampton Bays Short-Term Rental Market Composition (2026): Property & Room Types
Room Type Distribution
Property Type Distribution
Market Composition Insights for Hampton Bays
- The Hampton Bays Airbnb market composition is heavily skewed towards Entire Home/Apt listings, which make up 59.4% of the 32 active rentals. This indicates strong guest preference for privacy and space.
- However, a notable 40.6% share for Private Rooms suggests opportunities for budget-conscious travelers or hosts renting out spare rooms.
- Looking at the property type distribution in Hampton Bays, House properties are the most common (90.6%), reflecting the local real estate landscape.
- Houses represent a significant 90.6% portion, catering likely to families or larger groups.
- Smaller segments like hotel/boutique (combined 3.1%) offer potential for unique stay experiences.
Hampton Bays Airbnb Room Capacity Analysis (2026): Bedroom Distribution
Distribution of Listings by Number of Bedrooms
Room Capacity Insights for Hampton Bays
- The dominant room capacity in Hampton Bays is 2 bedrooms listings, making up 21.9% of the market. This suggests a strong demand for properties suitable for couples or solo travelers.
- Together, 2 bedrooms and 3 bedrooms properties represent 40.7% of the active Airbnb listings in Hampton Bays, indicating a high concentration in these sizes.
- A significant 40.7% of listings offer 3+ bedrooms, catering to larger groups and families seeking more space in Hampton Bays.
Hampton Bays Vacation Rental Guest Capacity Trends (2026)
Distribution of Listings by Guest Capacity
Guest Capacity Insights for Hampton Bays
- The most common guest capacity trend in Hampton Bays vacation rentals is listings accommodating 8+ guests (25%). This suggests the primary traveler segment is likely larger groups.
- Properties designed for 8+ guests and 6 guests dominate the Hampton Bays STR market, accounting for 43.8% of listings.
- 43.8% of properties accommodate 6+ guests, serving the market segment for larger families or group travel in Hampton Bays.
- On average, properties in Hampton Bays are equipped to host 3.7 guests.
Hampton Bays Airbnb Booking Patterns (2026): Available vs. Booked Days
Available Days Distribution
Booked Days Distribution
Booking Pattern Insights for Hampton Bays
- The most common availability pattern in Hampton Bays falls within the 271-366 days range, representing 87.5% of listings. This suggests many properties have significant open periods on their calendars.
- Approximately 100.0% of listings show high availability (181+ days open annually), indicating potential for increased bookings or specific owner usage patterns.
- For booked days, the 31-90 days range is most frequent in Hampton Bays (43.8%), reflecting common guest stay durations or potential owner blocking patterns.
Hampton Bays Airbnb Minimum Stay Requirements Analysis
Distribution of Listings by Minimum Night Requirement
1 Night
17 listings
53.1% of total
2 Nights
2 listings
6.3% of total
4-6 Nights
2 listings
6.3% of total
7-29 Nights
2 listings
6.3% of total
30+ Nights
9 listings
28.1% of total
Key Insights
- The most prevalent minimum stay requirement in Hampton Bays is 1 Night, adopted by 53.1% of listings. This highlights the market's preference for shorter, flexible bookings.
- A significant segment (28.1%) caters to monthly stays (30+ nights) in Hampton Bays, pointing to opportunities in the extended-stay market.
Recommendations
- Align with the market by considering a 1 Night minimum stay, as 53.1% of Hampton Bays hosts use this setting.
- Explore offering discounts for stays of 30+ nights to attract the 28.1% of the market seeking extended stays.
- Adjust minimum nights based on seasonality – potentially shorter during low season and longer during peak demand periods in Hampton Bays.
Hampton Bays Airbnb Cancellation Policy Trends Analysis (2026)
Super Strict 60 Days
5 listings
15.6% of total
Super Strict 30 Days
1 listings
3.1% of total
Flexible
1 listings
3.1% of total
Moderate
1 listings
3.1% of total
Firm
21 listings
65.6% of total
Strict
3 listings
9.4% of total
Cancellation Policy Insights for Hampton Bays
- The prevailing Airbnb cancellation policy trend in Hampton Bays is Firm, used by 65.6% of listings.
- A majority (75.0%) of hosts in Hampton Bays utilize Firm or Strict policies, indicating a market where hosts prioritize booking security.
- Strict cancellation policies are quite rare (9.4%), potentially making listings with this policy less competitive unless justified by high demand or property type.
Recommendations for Hosts
- Consider adopting a Firm policy to align with the 65.6% market standard in Hampton Bays.
- Using a Strict policy might deter some guests, as only 9.4% of listings use it. Evaluate if potential revenue protection outweighs possible lower booking rates.
- Regularly review your cancellation policy against competitors and market demand shifts in Hampton Bays.
Hampton Bays STR Booking Lead Time Analysis (2026)
Average Booking Lead Time by Month
Booking Lead Time Insights for Hampton Bays
- The overall average booking lead time for vacation rentals in Hampton Bays is 14 days.
- Guests book furthest in advance for stays during October (average 26 days), likely coinciding with peak travel demand or local events.
- The shortest booking windows occur for stays in April (average 0 days), indicating more last-minute travel plans during this time.
- Seasonally, Fall (20 days avg.) sees the longest lead times, while Spring (0 days avg.) has the shortest, reflecting typical travel planning cycles.
Recommendations for Hosts
- Use the overall average lead time (14 days) as a baseline for your pricing and availability strategy in Hampton Bays.
- For October stays, consider implementing length-of-stay discounts or slightly higher rates for bookings made less than 26 days out to capitalize on advance planning.
- During April, focus on last-minute booking availability and promotions, as guests book with very short notice (0 days avg.).
- Target marketing efforts for the Fall season well in advance (at least 20 days) to capture early planners.
- Monitor your own booking lead times against these Hampton Bays averages to identify opportunities for dynamic pricing adjustments.
Popular & Essential Airbnb Amenities in Hampton Bays (2026)
Amenity Prevalence
Amenity Insights for Hampton Bays
- Essential amenities in Hampton Bays that guests expect include: Air conditioning, TV, Wifi, Free parking on premises. Lacking these (any) could significantly impact bookings.
- Popular amenities like Hair dryer, Microwave, Coffee maker are common but not universal. Offering these can provide a competitive edge.
Recommendations for Hosts
- Ensure your listing includes all essential amenities for Hampton Bays: Air conditioning, TV, Wifi, Free parking on premises.
- Consider adding popular differentiators like Hair dryer or Microwave to increase appeal.
- Highlight unique or less common amenities you offer (e.g., hot tub, dedicated workspace, EV charger) in your listing description and photos.
- Regularly check competitor amenities in Hampton Bays to stay competitive.
Hampton Bays Airbnb Guest Demographics & Profile Analysis (2026)
Guest Profile Summary for Hampton Bays
- The typical guest profile for Airbnb in Hampton Bays consists of primarily domestic travelers (87%), often arriving from nearby New York, typically belonging to the Post-2000s (Gen Z/Alpha) group (50%), primarily speaking English or Spanish.
- Domestic travelers account for 87.3% of guests.
- Key international markets include United States (87.3%) and United Kingdom (1.7%).
- Top languages spoken are English (50%) followed by Spanish (16.7%).
- A significant demographic segment is the Post-2000s (Gen Z/Alpha) group, representing 50% of guests.
Recommendations for Hosts
- Target domestic marketing efforts towards travelers from New York and Boston.
- Tailor amenities and listing descriptions to appeal to the dominant Post-2000s (Gen Z/Alpha) demographic (e.g., highlight fast WiFi, smart home features, local guides).
- Highlight unique local experiences or amenities relevant to the primary guest profile.
- Consider seasonal promotions aligned with peak travel times for key origin markets.
Nearby Short-Term Rental Market Comparison
How does the Hampton Bays Airbnb market stack up against its neighbors? Compare key performance metrics like average monthly revenue, ADR, and occupancy rates in surrounding areas to understand the broader regional STR landscape.
| Market | Active Properties | Monthly Revenue | Daily Rate | Avg. Occupancy |
|---|---|---|---|---|
| Sag Harbor | 15 | $6,129 | $1280.84 | 40% |
| Town of East Hampton | 1,327 | $5,945 | $986.02 | 36% |
| Middletown | 395 | $5,781 | $589.01 | 45% |
| Town of Southampton | 1,201 | $5,620 | $1002.45 | 33% |
| Southampton | 19 | $5,405 | $1456.43 | 30% |
| New Shoreham | 120 | $5,359 | $637.79 | 45% |
| Monmouth Beach | 12 | $5,209 | $794.91 | 38% |
| Town of Pleasant Valley | 29 | $5,076 | $509.86 | 40% |
| Town of Putnam Valley | 50 | $4,930 | $413.72 | 43% |
| Town of Pawling | 19 | $4,658 | $411.34 | 44% |