Essex Airbnb Market Analysis 2026: Short Term Rental Data & Vacation Rental Statistics in New York, United States
Is Airbnb profitable in Essex in 2026? Explore comprehensive Airbnb analytics for Essex, New York, United States to uncover income potential. This 2026 STR market report for Essex, based on AirROI data from February 2025 to January 2026, reveals key trends in the niche market of 21 active listings.
Whether you're considering an Airbnb investment in Essex, optimizing your existing vacation rental, or exploring rental arbitrage opportunities, understanding the Essex Airbnb data is crucial. Leveraging the low regulation environment is key to maximizing your short term rental income potential. Let's dive into the specifics.
Key Essex Airbnb Performance Metrics Overview
Monthly Airbnb Revenue Variations & Income Potential in Essex (2026)
Understanding the monthly revenue variations for Airbnb listings in Essex is key to maximizing your short term rental income potential. Seasonality significantly impacts earnings. Our analysis, based on data from the past 12 months, shows that the peak revenue month for STRs in Essex is typically August, while January often presents the lowest earnings, highlighting opportunities for strategic pricing adjustments during shoulder and low seasons. Explore the typical Airbnb income in Essex across different performance tiers:
- Best-in-class properties (Top 10%) achieve $4,783+ monthly, often utilizing dynamic pricing and superior guest experiences.
- Strong performing properties (Top 25%) earn $3,190 or more, indicating effective management and desirable locations/amenities.
- Typical properties (Median) generate around $1,973 per month, representing the average market performance.
- Entry-level properties (Bottom 25%) see earnings around $1,221, often with potential for optimization.
Average Monthly Airbnb Earnings Trend in Essex
Essex Airbnb Occupancy Rate Trends (2026)
Maximize your bookings by understanding the Essex STR occupancy trends. Seasonal demand shifts significantly influence how often properties are booked. Typically, Augustsees the highest demand (peak season occupancy), while January experiences the lowest (low season). Effective strategies, like adjusting minimum stays or offering promotions, can boost occupancy during slower periods. Here's how different property tiers perform in Essex:
- Best-in-class properties (Top 10%) achieve 55%+ occupancy, indicating high desirability and potentially optimized availability.
- Strong performing properties (Top 25%) maintain 40% or higher occupancy, suggesting good market fit and guest satisfaction.
- Typical properties (Median) have an occupancy rate around 25%.
- Entry-level properties (Bottom 25%) average 18% occupancy, potentially facing higher vacancy.
Average Monthly Occupancy Rate Trend in Essex
Average Daily Rate (ADR) Airbnb Trends in Essex (2026)
Effective short term rental pricing strategy in Essex involves understanding monthly ADR fluctuations. The Average Daily Rate (ADR) for Airbnb in Essex typically peaks in July and dips lowest during November. Leveraging Airbnb dynamic pricing tools or strategies based on this seasonality can significantly boost revenue. Here's a look at the typical nightly rates achieved:
- Best-in-class properties (Top 10%) command rates of $400+ per night, often due to premium features or locations.
- Strong performing properties (Top 25%) achieve nightly rates of $326 or more.
- Typical properties (Median) charge around $244 per night.
- Entry-level properties (Bottom 25%) earn around $201 per night.
Average Daily Rate (ADR) Trend by Month in Essex
Get Live Essex Market Intelligence 👇

Explore Real-time Analytics
Airbnb Seasonality Analysis & Trends in Essex (2026)
Peak Season (August, November, July)
- Revenue averages $4,072 per month
- Occupancy rates average 40.8%
- Daily rates average $279
Shoulder Season
- Revenue averages $2,246 per month
- Occupancy maintains around 30.2%
- Daily rates hold near $270
Low Season (January, April, December)
- Revenue drops to average $1,067 per month
- Occupancy decreases to average 18.9%
- Daily rates adjust to average $262
Seasonality Insights for Essex
- The Airbnb seasonality in Essex shows highly seasonal trends requiring careful strategy. While the sections above show seasonal averages, it's also insightful to look at the extremes:
- During the high season, the absolute peak month showcases Essex's highest earning potential, with monthly revenues capable of climbing to $4,429, occupancy reaching a high of 53.4%, and ADRs peaking at $298.
- Conversely, the slowest single month of the year, typically falling within the low season, marks the market's lowest point. In this month, revenue might dip to $554, occupancy could drop to 9.7%, and ADRs may adjust down to $249.
- Understanding both the seasonal averages and these monthly peaks and troughs in revenue, occupancy, and ADR is crucial for maximizing your Airbnb profit potential in Essex.
Seasonal Strategies for Maximizing Profit
- Peak Season: Maximize revenue through premium pricing and potentially longer minimum stays. Ensure high availability.
- Low Season: Offer competitive pricing, special promotions (e.g., extended stay discounts), and flexible cancellation policies. Target off-season travelers like remote workers or budget-conscious guests.
- Shoulder Seasons: Implement dynamic pricing that balances peak and low rates. Target weekend travelers or specific events. Offer slightly more flexible terms than peak season.
- Regularly analyze your own performance against these Essex seasonality benchmarks and adjust your pricing and availability strategy accordingly.
Best Areas for Airbnb Investment in Essex (2026)
Exploring the top neighborhoods for short-term rentals in Essex? This section highlights key areas, outlining why they are attractive for hosts and guests, along with notable local attractions. Consider these locations based on your target guest profile and investment strategy.
| Neighborhood / Area | Why Host Here? (Target Guests & Appeal) | Key Attractions & Landmarks |
|---|---|---|
| Lake Placid | Famous for hosting the Winter Olympics and its stunning natural beauty. A prime spot for outdoor enthusiasts and tourists looking to enjoy skiing, hiking, and lake activities. | Lake Placid Lake, Whiteface Mountain, Olympic Center, Mirror Lake, High Falls Gorge, Lake Placid Olympic Museum |
| Saranac Lake | Known for its charming Adirondack architecture and vibrant arts scene. Ideal for visitors looking for a tranquil getaway with access to beautiful lakes and hiking trails. | Saranac Lake Village, Lake Flower, The Wild Center, Bloomingdale Bog Trail, Saranac Lake Arts Council |
| Ticonderoga | Rich in history and natural beauty, this area offers visitors a blend of historic sites and outdoor activities. Perfect for visitors interested in history and nature. | Fort Ticonderoga, Ticonderoga Golf Club, Lake Champlain, Bayside Ski Resort, Crown Point State Historic Site |
| Keene Valley | A scenic village nestled in the High Peaks region, ideal for adventure seekers and outdoor lovers. Attracts visitors for its hiking, climbing, and breathtaking vistas. | Giant Mountain, Keene Valley Library, The Adirondack Store, Marcy Field, Hiking Trails |
| Elizabethtown | A small town with beautiful scenery offering a more relaxed vacation atmosphere. Great for visitors interested in nature and local culture. | North Creek Railroad, Elizabethtown Community Hospital, Port Henry Beach, Camp Dudley, Adirondack Interpretive Center |
| Willsboro | Located on the shores of Lake Champlain, Willsboro offers guests outdoor activities and a peaceful retreat. Attracts visitors seeking water activities and beautiful views. | Willsboro Bay, Lake Champlain, Willsboro Marina, Giant Mountain Wilderness Area, Willsboro Falls |
| Westport | A picturesque town located at the gateway to the 'Champlain Valley' with stunning views and outdoor adventures. Perfect for nature lovers and those seeking a tranquil getaway. | Westport Marina, Bayside Cemetery, Lake Champlain, Westport Heritage House, Rock Harbor |
| Ausable Forks | A small village known for its proximity to the Ausable River and the beauty of the surrounding wilderness. Suitable for outdoor enthusiasts who enjoy fishing, hiking, and whitewater rafting. | Ausable River, Hiking Trails, Fishing spots, Whitewater Rafting, Local parks |
Understanding Airbnb License Requirements & STR Laws in Essex (2026)
While Essex, New York, United States currently shows low STR regulations, specific Airbnb license requirements might still exist or change. Always verify the latest short term rental regulations and Airbnb license requirements directly with local government authorities for Essex to ensure full compliance before hosting.
(Source: AirROI data, 2026, finding no licensed listings among those analyzed)
Top Performing Airbnb Properties in Essex (2026)
Benchmark your potential! Explore examples of top-performing Airbnb properties in Essexbased on Trailing Twelve Month (TTM) revenue. Analyze their characteristics, revenue, occupancy rate, and ADR to understand what drives success in this market.

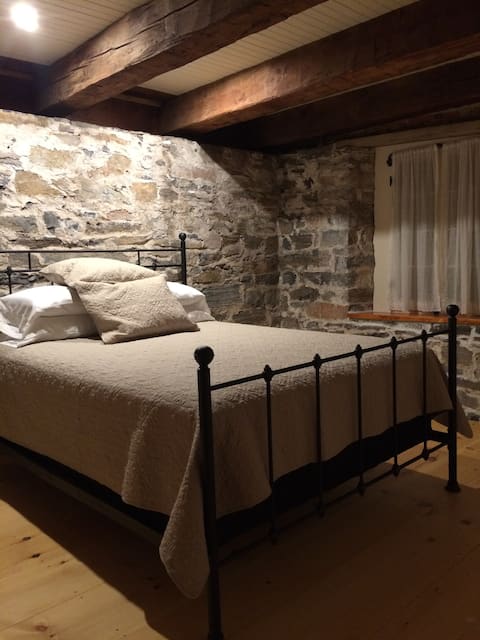
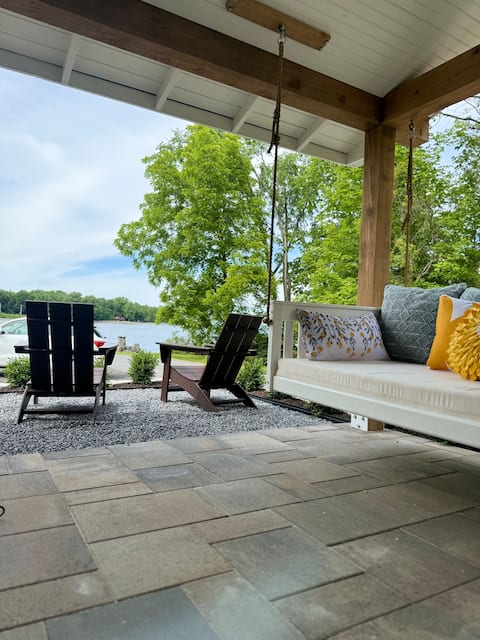
Spectacular views at the “Edge” of Lake Champlain
Entire Place • 4 bedrooms
Modern 2 BR Apt in Essex NY on Lake Champlain
Entire Place • 2 bedrooms

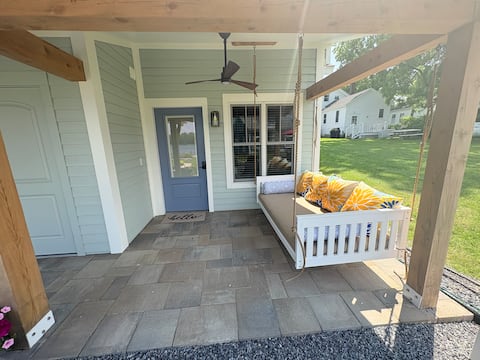
The Perch at The Old Dock
Entire Place • 2 bedrooms
Lady on the Lake Cottage 1 - Tub/Shower Combo
Entire Place • 1 bedroom
Lady on the Lake Cottage 6 - Shower Only
Entire Place • 1 bedroom

Cute modern farmhouse, Essex NY
Entire Place • 3 bedrooms
Note: Performance varies based on location, size, amenities, seasonality, and management quality. Data reflects the past 12 months.
Top Performing Airbnb Hosts in Essex (2026)
Learn from the best! This table showcases top-performing Airbnb hosts in Essex based on the number of properties managed and estimated total revenue over the past year. Analyze their scale and performance metrics.
| Host Name | Properties | Grossing Revenue | Stay Reviews | Avg Rating |
|---|---|---|---|---|
| Christine | 6 | $111,818 | 89 | 4.99/5.0 |
| Lisa | 1 | $48,564 | 68 | 4.84/5.0 |
| James | 3 | $40,743 | 414 | 4.74/5.0 |
| Laura | 1 | $38,412 | 90 | 4.98/5.0 |
| Audrey | 2 | $34,833 | 180 | 4.94/5.0 |
| Colby | 1 | $32,076 | 19 | 4.84/5.0 |
| Shahong | 1 | $18,562 | 6 | 5.00/5.0 |
| Cory | 1 | $15,237 | 18 | 5.00/5.0 |
| Jim | 2 | $14,217 | 32 | 4.86/5.0 |
| Luther | 1 | $10,444 | 2 | Not Rated |
Analyzing the strategies of top hosts, such as their property selection, pricing, and guest communication, can offer valuable lessons for optimizing your own Airbnb operations in Essex.
Dive Deeper: Advanced Essex STR Market Data (2026)
Ready to unlock more insights? AirROI provides access to advanced metrics and comprehensive Airbnb data for Essex. Explore detailed analytics beyond this report to refine your investment strategy, optimize pricing, and maximize your vacation rental profits.
Explore Advanced MetricsEssex Short-Term Rental Market Composition (2026): Property & Room Types
Room Type Distribution
Property Type Distribution
Market Composition Insights for Essex
- The Essex Airbnb market composition is heavily skewed towards Entire Home/Apt listings, which make up 100% of the 21 active rentals. This indicates strong guest preference for privacy and space.
- Looking at the property type distribution in Essex, House properties are the most common (66.7%), reflecting the local real estate landscape.
- Houses represent a significant 66.7% portion, catering likely to families or larger groups.
- Smaller segments like unique stays (combined 4.8%) offer potential for unique stay experiences.
Essex Airbnb Room Capacity Analysis (2026): Bedroom Distribution
Distribution of Listings by Number of Bedrooms
Room Capacity Insights for Essex
- The dominant room capacity in Essex is 1 bedroom listings, making up 52.4% of the market. This suggests a strong demand for properties suitable for couples or solo travelers.
- Together, 1 bedroom and 4 bedrooms properties represent 71.4% of the active Airbnb listings in Essex, indicating a high concentration in these sizes.
- With over half the market (52.4%) consisting of studios or 1-bedroom units, Essex is particularly well-suited for individuals or couples.
- A significant 23.8% of listings offer 3+ bedrooms, catering to larger groups and families seeking more space in Essex.
Essex Vacation Rental Guest Capacity Trends (2026)
Distribution of Listings by Guest Capacity
Guest Capacity Insights for Essex
- The most common guest capacity trend in Essex vacation rentals is listings accommodating 3 guests (42.9%). This suggests the primary traveler segment is likely small families or groups.
- Properties designed for 3 guests and 4 guests dominate the Essex STR market, accounting for 61.9% of listings.
- 19.1% of properties accommodate 6+ guests, serving the market segment for larger families or group travel in Essex.
- On average, properties in Essex are equipped to host 4.0 guests.
Essex Airbnb Booking Patterns (2026): Available vs. Booked Days
Available Days Distribution
Booked Days Distribution
Booking Pattern Insights for Essex
- The most common availability pattern in Essex falls within the 271-366 days range, representing 85.7% of listings. This suggests many properties have significant open periods on their calendars.
- Approximately 100.0% of listings show high availability (181+ days open annually), indicating potential for increased bookings or specific owner usage patterns.
- For booked days, the 31-90 days range is most frequent in Essex (61.9%), reflecting common guest stay durations or potential owner blocking patterns.
Essex Airbnb Minimum Stay Requirements Analysis
Distribution of Listings by Minimum Night Requirement
1 Night
2 listings
9.5% of total
2 Nights
10 listings
47.6% of total
3 Nights
1 listings
4.8% of total
30+ Nights
8 listings
38.1% of total
Key Insights
- The most prevalent minimum stay requirement in Essex is 2 Nights, adopted by 47.6% of listings. This highlights the market's preference for shorter, flexible bookings.
- A significant segment (38.1%) caters to monthly stays (30+ nights) in Essex, pointing to opportunities in the extended-stay market.
Recommendations
- Align with the market by considering a 2 Nights minimum stay, as 47.6% of Essex hosts use this setting.
- If feasible, allowing 1-night stays, especially midweek or during low season, could capture last-minute bookings, as only 9.5% currently do.
- A 2-night minimum appears standard (47.6%). Consider this for weekends or peak periods.
- Explore offering discounts for stays of 30+ nights to attract the 38.1% of the market seeking extended stays.
- Adjust minimum nights based on seasonality – potentially shorter during low season and longer during peak demand periods in Essex.
Essex Airbnb Cancellation Policy Trends Analysis (2026)
Flexible
3 listings
14.3% of total
Moderate
14 listings
66.7% of total
Firm
4 listings
19% of total
Cancellation Policy Insights for Essex
- The prevailing Airbnb cancellation policy trend in Essex is Moderate, used by 66.7% of listings.
- The market strongly favors guest-friendly terms, with 81.0% of listings offering Flexible or Moderate policies. This suggests guests in Essex may expect booking flexibility.
Recommendations for Hosts
- Consider adopting a Moderate policy to align with the 66.7% market standard in Essex.
- Regularly review your cancellation policy against competitors and market demand shifts in Essex.
Essex STR Booking Lead Time Analysis (2026)
Average Booking Lead Time by Month
Booking Lead Time Insights for Essex
- The overall average booking lead time for vacation rentals in Essex is 73 days.
- Guests book furthest in advance for stays during January (average 364 days), likely coinciding with peak travel demand or local events.
- The shortest booking windows occur for stays in February (average 8 days), indicating more last-minute travel plans during this time.
- Seasonally, Winter (179 days avg.) sees the longest lead times, while Fall (54 days avg.) has the shortest, reflecting typical travel planning cycles.
Recommendations for Hosts
- Use the overall average lead time (73 days) as a baseline for your pricing and availability strategy in Essex.
- For January stays, consider implementing length-of-stay discounts or slightly higher rates for bookings made less than 364 days out to capitalize on advance planning.
- During February, focus on last-minute booking availability and promotions, as guests book with very short notice (8 days avg.).
- Target marketing efforts for the Winter season well in advance (at least 179 days) to capture early planners.
- Monitor your own booking lead times against these Essex averages to identify opportunities for dynamic pricing adjustments.
Popular & Essential Airbnb Amenities in Essex (2026)
Amenity Prevalence
Amenity Insights for Essex
- Essential amenities in Essex that guests expect include: Wifi, Carbon monoxide alarm, Smoke alarm. Lacking these (any) could significantly impact bookings.
- Popular amenities like Free parking on premises, Essentials, Coffee maker are common but not universal. Offering these can provide a competitive edge.
Recommendations for Hosts
- Ensure your listing includes all essential amenities for Essex: Wifi, Carbon monoxide alarm, Smoke alarm.
- Prioritize adding missing essentials: Wifi, Carbon monoxide alarm, Smoke alarm.
- Consider adding popular differentiators like Free parking on premises or Essentials to increase appeal.
- Highlight unique or less common amenities you offer (e.g., hot tub, dedicated workspace, EV charger) in your listing description and photos.
- Regularly check competitor amenities in Essex to stay competitive.
Essex Airbnb Guest Demographics & Profile Analysis (2026)
Guest Profile Summary for Essex
- The typical guest profile for Airbnb in Essex consists of primarily domestic travelers (90%), often arriving from nearby New York, typically belonging to the Post-2000s (Gen Z/Alpha) group (50%), primarily speaking English or Spanish.
- Domestic travelers account for 89.5% of guests.
- Key international markets include United States (89.5%) and Canada (3.2%).
- Top languages spoken are English (64.7%) followed by Spanish (14.7%).
- A significant demographic segment is the Post-2000s (Gen Z/Alpha) group, representing 50% of guests.
Recommendations for Hosts
- Target domestic marketing efforts towards travelers from New York and Philadelphia.
- Tailor amenities and listing descriptions to appeal to the dominant Post-2000s (Gen Z/Alpha) demographic (e.g., highlight fast WiFi, smart home features, local guides).
- Highlight unique local experiences or amenities relevant to the primary guest profile.
- Consider seasonal promotions aligned with peak travel times for key origin markets.
Nearby Short-Term Rental Market Comparison
How does the Essex Airbnb market stack up against its neighbors? Compare key performance metrics like average monthly revenue, ADR, and occupancy rates in surrounding areas to understand the broader regional STR landscape.
| Market | Active Properties | Monthly Revenue | Daily Rate | Avg. Occupancy |
|---|---|---|---|---|
| Middletown Springs | 13 | $6,843 | $507.55 | 32% |
| Pomfret | 15 | $6,549 | $502.74 | 45% |
| Fort Ann | 35 | $6,238 | $790.41 | 37% |
| Hanover | 33 | $5,826 | $1189.51 | 41% |
| Mille-Isles | 89 | $5,219 | $472.25 | 38% |
| Malletts Bay | 51 | $4,842 | $444.86 | 41% |
| Town of Wilton | 103 | $4,841 | $862.83 | 38% |
| Town of Bolton | 140 | $4,533 | $693.78 | 37% |
| Putnam Station | 14 | $4,483 | $512.24 | 42% |
| Stowe | 875 | $4,424 | $529.19 | 38% |