City of Troy Airbnb Market Analysis 2026: Short Term Rental Data & Vacation Rental Statistics in New York, United States
Is Airbnb profitable in City of Troy in 2026? Explore comprehensive Airbnb analytics for City of Troy, New York, United States to uncover income potential. This 2026 STR market report for City of Troy, based on AirROI data from February 2025 to January 2026, reveals key trends in the niche market of 161 active listings.
Whether you're considering an Airbnb investment in City of Troy, optimizing your existing vacation rental, or exploring rental arbitrage opportunities, understanding the City of Troy Airbnb data is crucial. Leveraging the low regulation environment is key to maximizing your short term rental income potential. Let's dive into the specifics.
Key City of Troy Airbnb Performance Metrics Overview
Monthly Airbnb Revenue Variations & Income Potential in City of Troy (2026)
Understanding the monthly revenue variations for Airbnb listings in City of Troy is key to maximizing your short term rental income potential. Seasonality significantly impacts earnings. Our analysis, based on data from the past 12 months, shows that the peak revenue month for STRs in City of Troy is typically July, while February often presents the lowest earnings, highlighting opportunities for strategic pricing adjustments during shoulder and low seasons. Explore the typical Airbnb income in City of Troy across different performance tiers:
- Best-in-class properties (Top 10%) achieve $3,509+ monthly, often utilizing dynamic pricing and superior guest experiences.
- Strong performing properties (Top 25%) earn $2,508 or more, indicating effective management and desirable locations/amenities.
- Typical properties (Median) generate around $1,670 per month, representing the average market performance.
- Entry-level properties (Bottom 25%) see earnings around $869, often with potential for optimization.
Average Monthly Airbnb Earnings Trend in City of Troy
City of Troy Airbnb Occupancy Rate Trends (2026)
Maximize your bookings by understanding the City of Troy STR occupancy trends. Seasonal demand shifts significantly influence how often properties are booked. Typically, Julysees the highest demand (peak season occupancy), while January experiences the lowest (low season). Effective strategies, like adjusting minimum stays or offering promotions, can boost occupancy during slower periods. Here's how different property tiers perform in City of Troy:
- Best-in-class properties (Top 10%) achieve 84%+ occupancy, indicating high desirability and potentially optimized availability.
- Strong performing properties (Top 25%) maintain 68% or higher occupancy, suggesting good market fit and guest satisfaction.
- Typical properties (Median) have an occupancy rate around 47%.
- Entry-level properties (Bottom 25%) average 27% occupancy, potentially facing higher vacancy.
Average Monthly Occupancy Rate Trend in City of Troy
Average Daily Rate (ADR) Airbnb Trends in City of Troy (2026)
Effective short term rental pricing strategy in City of Troy involves understanding monthly ADR fluctuations. The Average Daily Rate (ADR) for Airbnb in City of Troy typically peaks in October and dips lowest during February. Leveraging Airbnb dynamic pricing tools or strategies based on this seasonality can significantly boost revenue. Here's a look at the typical nightly rates achieved:
- Best-in-class properties (Top 10%) command rates of $204+ per night, often due to premium features or locations.
- Strong performing properties (Top 25%) achieve nightly rates of $144 or more.
- Typical properties (Median) charge around $101 per night.
- Entry-level properties (Bottom 25%) earn around $72 per night.
Average Daily Rate (ADR) Trend by Month in City of Troy
Get Live City of Troy Market Intelligence 👇

Explore Real-time Analytics
Airbnb Seasonality Analysis & Trends in City of Troy (2026)
Peak Season (July, August, October)
- Revenue averages $2,348 per month
- Occupancy rates average 54.5%
- Daily rates average $120
Shoulder Season
- Revenue averages $1,899 per month
- Occupancy maintains around 47.2%
- Daily rates hold near $117
Low Season (January, February, April)
- Revenue drops to average $1,476 per month
- Occupancy decreases to average 42.5%
- Daily rates adjust to average $110
Seasonality Insights for City of Troy
- The Airbnb seasonality in City of Troy shows moderate seasonality with distinct peak and low periods. While the sections above show seasonal averages, it's also insightful to look at the extremes:
- During the high season, the absolute peak month showcases City of Troy's highest earning potential, with monthly revenues capable of climbing to $2,450, occupancy reaching a high of 57.5%, and ADRs peaking at $123.
- Conversely, the slowest single month of the year, typically falling within the low season, marks the market's lowest point. In this month, revenue might dip to $1,405, occupancy could drop to 39.6%, and ADRs may adjust down to $104.
- Understanding both the seasonal averages and these monthly peaks and troughs in revenue, occupancy, and ADR is crucial for maximizing your Airbnb profit potential in City of Troy.
Seasonal Strategies for Maximizing Profit
- Peak Season: Maximize revenue through premium pricing and potentially longer minimum stays. Ensure high availability.
- Low Season: Offer competitive pricing, special promotions (e.g., extended stay discounts), and flexible cancellation policies. Target off-season travelers like remote workers or budget-conscious guests.
- Shoulder Seasons: Implement dynamic pricing that balances peak and low rates. Target weekend travelers or specific events. Offer slightly more flexible terms than peak season.
- Regularly analyze your own performance against these City of Troy seasonality benchmarks and adjust your pricing and availability strategy accordingly.
Best Areas for Airbnb Investment in City of Troy (2026)
Exploring the top neighborhoods for short-term rentals in City of Troy? This section highlights key areas, outlining why they are attractive for hosts and guests, along with notable local attractions. Consider these locations based on your target guest profile and investment strategy.
| Neighborhood / Area | Why Host Here? (Target Guests & Appeal) | Key Attractions & Landmarks |
|---|---|---|
| Downtown Troy | The vibrant heart of Troy with its historic architecture and revitalized waterfront. Known for restaurants, shops, and accessibility to events, perfect for short-term stays. | Troy Waterfront Farmers Market, Rensselaer County Historical Society, The Troy Savings Bank Music Hall, Riverfront Park, Brown's Brewing Co. |
| Frear Park | A peaceful residential area next to the largest city park, ideal for families and nature lovers. Offers hiking and outdoor activities. | Frear Park, Troy Golf Club, Troy BMX, Nature Trails, Picnic Areas |
| Baxter Park | A growing neighborhood popular with students and young professionals, known for its community feel and proximity to dining options and local shops. | Troy Waterfront Farmers Market, Local Cafes, Boutique Shops, Rensselaer Polytechnic Institute, Washington Park |
| Rensselaer Historic District | Rich in history with picturesque views and historical sites. An attractive area for those interested in cultural experiences and exploration. | Troy Historic District, The Emma Willard House, Various Historic Churches, Riverside Park, Public Art Installations |
| Sandy Hill | A residential area that is ideal for families and offers proximity to schools and community amenities. Great for longer stays in a quiet neighborhood. | Sandy Hill Park, Community Sports Facilities, Local Libraries, Walking Trails, Residential Amenities |
| Northern Troy | An up-and-coming area with charming homes and easy access to downtown. Perfect for visitors looking for a local experience that is still close to major attractions. | Saratoga Springs, Patroon Island Park, Various Dining Options, Local Shops, Community Events |
| South Troy | Known for its diverse community and vibrant culture, South Troy offers a variety of local events and activities, making it a lively base for visitors. | Local Festivals, Troy Waterfront, Restaurants with International Cuisine, Art Exhibitions, Historical Walking Tours |
| Clinton Park | A residential and commercial neighborhood that attracts business travelers and tourists due to its central location and accessibility to major roads. | Shopping Centers, Local Eateries, Parks and Playgrounds, Community Events, Access to Public Transport |
Understanding Airbnb License Requirements & STR Laws in City of Troy (2026)
While City of Troy, New York, United States currently shows low STR regulations, specific Airbnb license requirements might still exist or change. Always verify the latest short term rental regulations and Airbnb license requirements directly with local government authorities for City of Troy to ensure full compliance before hosting.
(Source: AirROI data, 2026, finding no licensed listings among those analyzed)
Top Performing Airbnb Properties in City of Troy (2026)
Benchmark your potential! Explore examples of top-performing Airbnb properties in City of Troybased on Trailing Twelve Month (TTM) revenue. Analyze their characteristics, revenue, occupancy rate, and ADR to understand what drives success in this market.
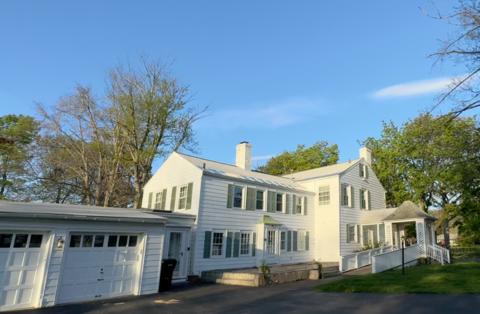
Charming Riverfront Mansion: The Powers House
Entire Place • 6 bedrooms

Downtown Trojan Horse Airbnb, Parking, Magic Patio
Entire Place • 4 bedrooms

4 Bdrm Luxury Modern Victorian with Tree House
Entire Place • 4 bedrooms

Bungalow by Frear Park Golf Course*Pet Friendly
Entire Place • 4 bedrooms

Hidden Gem in heart of Troy
Entire Place • 3 bedrooms
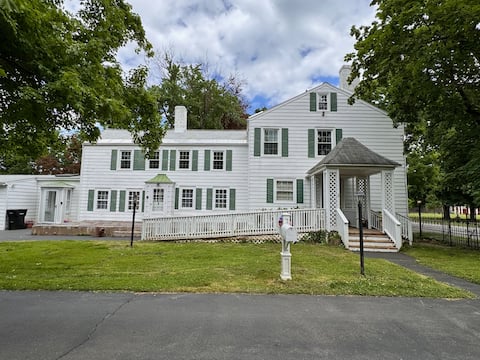
Charming Riverfront 4BR Flat
Entire Place • 4 bedrooms
Note: Performance varies based on location, size, amenities, seasonality, and management quality. Data reflects the past 12 months.
Top Performing Airbnb Hosts in City of Troy (2026)
Learn from the best! This table showcases top-performing Airbnb hosts in City of Troy based on the number of properties managed and estimated total revenue over the past year. Analyze their scale and performance metrics.
| Host Name | Properties | Grossing Revenue | Stay Reviews | Avg Rating |
|---|---|---|---|---|
| Igor | 10 | $351,692 | 2801 | 4.91/5.0 |
| Tatyana And Phillip Pevzner | 10 | $168,729 | 831 | 4.81/5.0 |
| Eric | 6 | $100,857 | 157 | 4.86/5.0 |
| Susan | 4 | $99,224 | 882 | 4.92/5.0 |
| Miriam | 4 | $98,430 | 609 | 4.90/5.0 |
| Sylva | 6 | $95,260 | 145 | 4.89/5.0 |
| James | 3 | $86,887 | 78 | 4.91/5.0 |
| Tatyana | 2 | $74,373 | 384 | 4.95/5.0 |
| Charles | 3 | $71,989 | 1209 | 4.96/5.0 |
| Katherine | 1 | $70,820 | 251 | 4.99/5.0 |
Analyzing the strategies of top hosts, such as their property selection, pricing, and guest communication, can offer valuable lessons for optimizing your own Airbnb operations in City of Troy.
Dive Deeper: Advanced City of Troy STR Market Data (2026)
Ready to unlock more insights? AirROI provides access to advanced metrics and comprehensive Airbnb data for City of Troy. Explore detailed analytics beyond this report to refine your investment strategy, optimize pricing, and maximize your vacation rental profits.
Explore Advanced MetricsCity of Troy Short-Term Rental Market Composition (2026): Property & Room Types
Room Type Distribution
Property Type Distribution
Market Composition Insights for City of Troy
- The City of Troy Airbnb market composition is heavily skewed towards Entire Home/Apt listings, which make up 75.2% of the 161 active rentals. This indicates strong guest preference for privacy and space.
- Looking at the property type distribution in City of Troy, Apartment/Condo properties are the most common (83.9%), reflecting the local real estate landscape.
- The presence of 5.6% Hotel/Boutique listings indicates integration with traditional hospitality.
- Smaller segments like others, outdoor/unique (combined 1.2%) offer potential for unique stay experiences.
City of Troy Airbnb Room Capacity Analysis (2026): Bedroom Distribution
Distribution of Listings by Number of Bedrooms
Room Capacity Insights for City of Troy
- The dominant room capacity in City of Troy is 1 bedroom listings, making up 29.2% of the market. This suggests a strong demand for properties suitable for couples or solo travelers.
- Together, 1 bedroom and 2 bedrooms properties represent 55.3% of the active Airbnb listings in City of Troy, indicating a high concentration in these sizes.
City of Troy Vacation Rental Guest Capacity Trends (2026)
Distribution of Listings by Guest Capacity
Guest Capacity Insights for City of Troy
- The most common guest capacity trend in City of Troy vacation rentals is listings accommodating 2 guests (18%). This suggests the primary traveler segment is likely couples or solo travelers.
- Properties designed for 2 guests and 3 guests dominate the City of Troy STR market, accounting for 34.8% of listings.
- 21.1% of properties accommodate 6+ guests, serving the market segment for larger families or group travel in City of Troy.
- On average, properties in City of Troy are equipped to host 3.1 guests.
City of Troy Airbnb Booking Patterns (2026): Available vs. Booked Days
Available Days Distribution
Booked Days Distribution
Booking Pattern Insights for City of Troy
- The most common availability pattern in City of Troy falls within the 181-270 days range, representing 37.3% of listings. This suggests many properties have significant open periods on their calendars.
- Approximately 72.1% of listings show high availability (181+ days open annually), indicating potential for increased bookings or specific owner usage patterns.
- For booked days, the 91-180 days range is most frequent in City of Troy (37.3%), reflecting common guest stay durations or potential owner blocking patterns.
- A notable 29.2% of properties secure long booking periods (181+ days booked per year), highlighting successful long-term rental strategies or significant owner usage.
City of Troy Airbnb Minimum Stay Requirements Analysis
Distribution of Listings by Minimum Night Requirement
1 Night
46 listings
28.6% of total
2 Nights
44 listings
27.3% of total
3 Nights
7 listings
4.3% of total
4-6 Nights
7 listings
4.3% of total
7-29 Nights
20 listings
12.4% of total
30+ Nights
37 listings
23% of total
Key Insights
- The most prevalent minimum stay requirement in City of Troy is 1 Night, adopted by 28.6% of listings. This highlights the market's preference for shorter, flexible bookings.
- A significant segment (23%) caters to monthly stays (30+ nights) in City of Troy, pointing to opportunities in the extended-stay market.
Recommendations
- Align with the market by considering a 1 Night minimum stay, as 28.6% of City of Troy hosts use this setting.
- If feasible, allowing 1-night stays, especially midweek or during low season, could capture last-minute bookings, as only 28.6% currently do.
- Explore offering discounts for stays of 30+ nights to attract the 23% of the market seeking extended stays.
- Adjust minimum nights based on seasonality – potentially shorter during low season and longer during peak demand periods in City of Troy.
City of Troy Airbnb Cancellation Policy Trends Analysis (2026)
Limited
1 listings
0.6% of total
Flexible
47 listings
29.2% of total
Moderate
38 listings
23.6% of total
Firm
42 listings
26.1% of total
Strict
33 listings
20.5% of total
Cancellation Policy Insights for City of Troy
- The prevailing Airbnb cancellation policy trend in City of Troy is Flexible, used by 29.2% of listings.
- There's a relatively balanced mix between guest-friendly (52.8%) and stricter (46.6%) policies, offering choices for different guest needs.
Recommendations for Hosts
- Consider adopting a Flexible policy to align with the 29.2% market standard in City of Troy.
- Regularly review your cancellation policy against competitors and market demand shifts in City of Troy.
City of Troy STR Booking Lead Time Analysis (2026)
Average Booking Lead Time by Month
Booking Lead Time Insights for City of Troy
- The overall average booking lead time for vacation rentals in City of Troy is 32 days.
- Guests book furthest in advance for stays during May (average 49 days), likely coinciding with peak travel demand or local events.
- The shortest booking windows occur for stays in February (average 13 days), indicating more last-minute travel plans during this time.
- Seasonally, Summer (41 days avg.) sees the longest lead times, while Winter (19 days avg.) has the shortest, reflecting typical travel planning cycles.
Recommendations for Hosts
- Use the overall average lead time (32 days) as a baseline for your pricing and availability strategy in City of Troy.
- For May stays, consider implementing length-of-stay discounts or slightly higher rates for bookings made less than 49 days out to capitalize on advance planning.
- During February, focus on last-minute booking availability and promotions, as guests book with very short notice (13 days avg.).
- Target marketing efforts for the Summer season well in advance (at least 41 days) to capture early planners.
- Monitor your own booking lead times against these City of Troy averages to identify opportunities for dynamic pricing adjustments.
Popular & Essential Airbnb Amenities in City of Troy (2026)
Amenity Prevalence
Amenity Insights for City of Troy
- Essential amenities in City of Troy that guests expect include: Smoke alarm, Wifi, Carbon monoxide alarm, Heating. Lacking these (any) could significantly impact bookings.
- Popular amenities like Kitchen, Air conditioning, TV are common but not universal. Offering these can provide a competitive edge.
Recommendations for Hosts
- Ensure your listing includes all essential amenities for City of Troy: Smoke alarm, Wifi, Carbon monoxide alarm, Heating.
- Prioritize adding missing essentials: Carbon monoxide alarm, Heating.
- Consider adding popular differentiators like Kitchen or Air conditioning to increase appeal.
- Highlight unique or less common amenities you offer (e.g., hot tub, dedicated workspace, EV charger) in your listing description and photos.
- Regularly check competitor amenities in City of Troy to stay competitive.
City of Troy Airbnb Guest Demographics & Profile Analysis (2026)
Guest Profile Summary for City of Troy
- The typical guest profile for Airbnb in City of Troy consists of primarily domestic travelers (94%), often arriving from nearby New York, typically belonging to the Post-2000s (Gen Z/Alpha) group (50%), primarily speaking English or Spanish.
- Domestic travelers account for 93.8% of guests.
- Key international markets include United States (93.8%) and Canada (1.8%).
- Top languages spoken are English (66.6%) followed by Spanish (12.2%).
- A significant demographic segment is the Post-2000s (Gen Z/Alpha) group, representing 50% of guests.
Recommendations for Hosts
- Target domestic marketing efforts towards travelers from New York and Boston.
- Tailor amenities and listing descriptions to appeal to the dominant Post-2000s (Gen Z/Alpha) demographic (e.g., highlight fast WiFi, smart home features, local guides).
- Highlight unique local experiences or amenities relevant to the primary guest profile.
- Consider seasonal promotions aligned with peak travel times for key origin markets.
Nearby Short-Term Rental Market Comparison
How does the City of Troy Airbnb market stack up against its neighbors? Compare key performance metrics like average monthly revenue, ADR, and occupancy rates in surrounding areas to understand the broader regional STR landscape.
| Market | Active Properties | Monthly Revenue | Daily Rate | Avg. Occupancy |
|---|---|---|---|---|
| Middletown Springs | 13 | $6,843 | $507.55 | 32% |
| Pomfret | 15 | $6,549 | $502.74 | 45% |
| Town of Kingston | 10 | $6,470 | $473.76 | 49% |
| Frankford Township | 11 | $6,329 | $505.19 | 41% |
| Fort Ann | 35 | $6,238 | $790.41 | 37% |
| Town of East Hampton | 1,327 | $5,945 | $986.02 | 36% |
| Hanover | 33 | $5,826 | $1189.51 | 41% |
| Town of Monroe | 22 | $5,690 | $720.52 | 37% |
| Town of Ancram | 22 | $5,616 | $512.55 | 38% |
| Town of Schodack | 11 | $5,158 | $555.89 | 29% |