City of Poughkeepsie Airbnb Market Analysis 2026: Short Term Rental Data & Vacation Rental Statistics in New York, United States
Is Airbnb profitable in City of Poughkeepsie in 2026? Explore comprehensive Airbnb analytics for City of Poughkeepsie, New York, United States to uncover income potential. This 2026 STR market report for City of Poughkeepsie, based on AirROI data from February 2025 to January 2026, reveals key trends in the niche market of 65 active listings.
Whether you're considering an Airbnb investment in City of Poughkeepsie, optimizing your existing vacation rental, or exploring rental arbitrage opportunities, understanding the City of Poughkeepsie Airbnb data is crucial. Leveraging the low regulation environment is key to maximizing your short term rental income potential. Let's dive into the specifics.
Key City of Poughkeepsie Airbnb Performance Metrics Overview
Monthly Airbnb Revenue Variations & Income Potential in City of Poughkeepsie (2026)
Understanding the monthly revenue variations for Airbnb listings in City of Poughkeepsie is key to maximizing your short term rental income potential. Seasonality significantly impacts earnings. Our analysis, based on data from the past 12 months, shows that the peak revenue month for STRs in City of Poughkeepsie is typically July, while February often presents the lowest earnings, highlighting opportunities for strategic pricing adjustments during shoulder and low seasons. Explore the typical Airbnb income in City of Poughkeepsie across different performance tiers:
- Best-in-class properties (Top 10%) achieve $6,014+ monthly, often utilizing dynamic pricing and superior guest experiences.
- Strong performing properties (Top 25%) earn $3,685 or more, indicating effective management and desirable locations/amenities.
- Typical properties (Median) generate around $2,008 per month, representing the average market performance.
- Entry-level properties (Bottom 25%) see earnings around $824, often with potential for optimization.
Average Monthly Airbnb Earnings Trend in City of Poughkeepsie
City of Poughkeepsie Airbnb Occupancy Rate Trends (2026)
Maximize your bookings by understanding the City of Poughkeepsie STR occupancy trends. Seasonal demand shifts significantly influence how often properties are booked. Typically, Julysees the highest demand (peak season occupancy), while February experiences the lowest (low season). Effective strategies, like adjusting minimum stays or offering promotions, can boost occupancy during slower periods. Here's how different property tiers perform in City of Poughkeepsie:
- Best-in-class properties (Top 10%) achieve 82%+ occupancy, indicating high desirability and potentially optimized availability.
- Strong performing properties (Top 25%) maintain 62% or higher occupancy, suggesting good market fit and guest satisfaction.
- Typical properties (Median) have an occupancy rate around 39%.
- Entry-level properties (Bottom 25%) average 20% occupancy, potentially facing higher vacancy.
Average Monthly Occupancy Rate Trend in City of Poughkeepsie
Average Daily Rate (ADR) Airbnb Trends in City of Poughkeepsie (2026)
Effective short term rental pricing strategy in City of Poughkeepsie involves understanding monthly ADR fluctuations. The Average Daily Rate (ADR) for Airbnb in City of Poughkeepsie typically peaks in October and dips lowest during February. Leveraging Airbnb dynamic pricing tools or strategies based on this seasonality can significantly boost revenue. Here's a look at the typical nightly rates achieved:
- Best-in-class properties (Top 10%) command rates of $334+ per night, often due to premium features or locations.
- Strong performing properties (Top 25%) achieve nightly rates of $205 or more.
- Typical properties (Median) charge around $156 per night.
- Entry-level properties (Bottom 25%) earn around $112 per night.
Average Daily Rate (ADR) Trend by Month in City of Poughkeepsie
Get Live City of Poughkeepsie Market Intelligence 👇

Explore Real-time Analytics
Airbnb Seasonality Analysis & Trends in City of Poughkeepsie (2026)
Peak Season (July, August, October)
- Revenue averages $3,540 per month
- Occupancy rates average 47.6%
- Daily rates average $203
Shoulder Season
- Revenue averages $2,751 per month
- Occupancy maintains around 41.0%
- Daily rates hold near $199
Low Season (February, March, April)
- Revenue drops to average $1,968 per month
- Occupancy decreases to average 39.0%
- Daily rates adjust to average $168
Seasonality Insights for City of Poughkeepsie
- The Airbnb seasonality in City of Poughkeepsie shows highly seasonal trends requiring careful strategy. While the sections above show seasonal averages, it's also insightful to look at the extremes:
- During the high season, the absolute peak month showcases City of Poughkeepsie's highest earning potential, with monthly revenues capable of climbing to $3,634, occupancy reaching a high of 48.8%, and ADRs peaking at $214.
- Conversely, the slowest single month of the year, typically falling within the low season, marks the market's lowest point. In this month, revenue might dip to $1,628, occupancy could drop to 37.0%, and ADRs may adjust down to $166.
- Understanding both the seasonal averages and these monthly peaks and troughs in revenue, occupancy, and ADR is crucial for maximizing your Airbnb profit potential in City of Poughkeepsie.
Seasonal Strategies for Maximizing Profit
- Peak Season: Maximize revenue through premium pricing and potentially longer minimum stays. Ensure high availability.
- Low Season: Offer competitive pricing, special promotions (e.g., extended stay discounts), and flexible cancellation policies. Target off-season travelers like remote workers or budget-conscious guests.
- Shoulder Seasons: Implement dynamic pricing that balances peak and low rates. Target weekend travelers or specific events. Offer slightly more flexible terms than peak season.
- Regularly analyze your own performance against these City of Poughkeepsie seasonality benchmarks and adjust your pricing and availability strategy accordingly.
Best Areas for Airbnb Investment in City of Poughkeepsie (2026)
Exploring the top neighborhoods for short-term rentals in City of Poughkeepsie? This section highlights key areas, outlining why they are attractive for hosts and guests, along with notable local attractions. Consider these locations based on your target guest profile and investment strategy.
| Neighborhood / Area | Why Host Here? (Target Guests & Appeal) | Key Attractions & Landmarks |
|---|---|---|
| Downtown Poughkeepsie | The heart of the city with revitalized waterfront views, cultural attractions, and bustling restaurants. Ideal for guests seeking a vibrant urban experience close to the Hudson River. | Walkway Over the Hudson, Poughkeepsie Waterfront Market, Mid-Hudson Children's Museum, Bardavon 1869 Opera House, Locust Grove Estate |
| College Hill | Home to Vassar College, this area boasts historic charm and a collegiate atmosphere. Attracts families, alumni, and visitors of the college looking for nearby accommodations. | Vassar College, Vassar Farm and Ecological Preserve, Frances Lehman Loeb Art Center, The Center for the Arts |
| Hudson River Waterfront | Stunning views of the river and a relaxed atmosphere. Perfect for visitors who enjoy outdoor activities like walking, biking, and dining by the water. | Hudson River Greenway, Poughkeepsie Boat House, Riverfront Park, Canoe and Kayak rentals |
| Marist College Area | Close to Marist College, this neighborhood is popular among families visiting students and young professionals seeking a lively community vibe. | Marist College, Rondout Creek, Riverfront Park, Poughkeepsie Galleria |
| Wappingers Falls | Just a short drive from Poughkeepsie, this scenic village features charming shops and close access to nature, attracting guests who prefer a quieter stay. | The Wappingers Falls, Breweries and local wineries, Bannen Park, Fallkill Park |
| Highland | Located across the river, Highland provides a peaceful retreat with access to outdoor adventures and historical sites, ideal for visitors looking to explore beyond the city. | Walkway Over the Hudson, Tony Williams Park, The Highland Diner |
| Tivoli | A quaint, artsy village known for its vibrant arts community and proximity to Bard College, ideal for arts enthusiasts and guests seeking a unique, small-town feel. | Bard College, Tivoli Artist's Coop, The Corner |
| Poughkeepsie Northside | A residential area with great access to local eateries and parks. Appeals to visitors interested in a neighborhood experience with easy access to downtown. | Algonquin Park, Family-friendly parks, Local cafes and diners |
Understanding Airbnb License Requirements & STR Laws in City of Poughkeepsie (2026)
While City of Poughkeepsie, New York, United States currently shows low STR regulations, specific Airbnb license requirements might still exist or change. Always verify the latest short term rental regulations and Airbnb license requirements directly with local government authorities for City of Poughkeepsie to ensure full compliance before hosting.
(Source: AirROI data, 2026, finding no licensed listings among those analyzed)
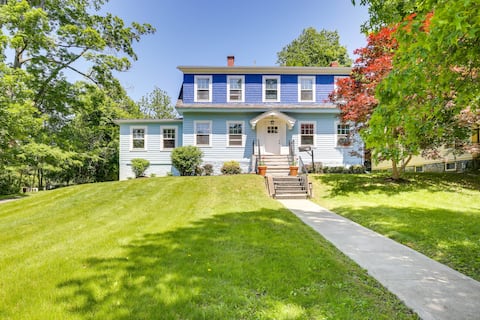
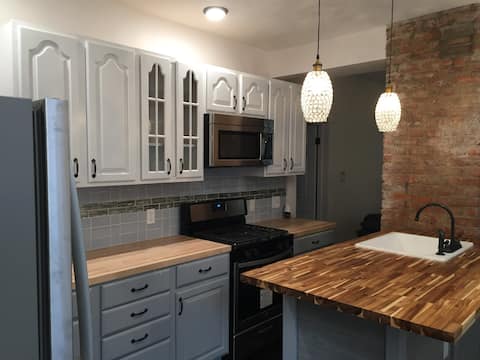
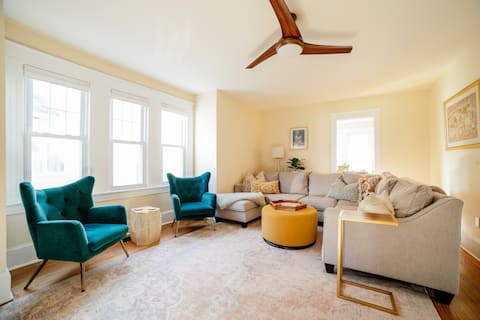
Top Performing Airbnb Properties in City of Poughkeepsie (2026)
Benchmark your potential! Explore examples of top-performing Airbnb properties in City of Poughkeepsiebased on Trailing Twelve Month (TTM) revenue. Analyze their characteristics, revenue, occupancy rate, and ADR to understand what drives success in this market.

Rosehill 1861 | Historic 4BR. Garden Oasis & Sauna
Entire Place • 4 bedrooms

Historic Spacious Home 5 bed/2 bath
Entire Place • 5 bedrooms
Historic Poughkeepsie Home Near Arlington & Vassar
Entire Place • 4 bedrooms

4BR|2Bath|King Beds|Walk to Marist|CIA|Pet|Parking
Entire Place • 4 bedrooms
Walk Across the Hudson + Marist Vassar CIA
Entire Place • 3 bedrooms
Charming 3 Bedroom Home - Near Vassar, Marist
Entire Place • 3 bedrooms
Note: Performance varies based on location, size, amenities, seasonality, and management quality. Data reflects the past 12 months.
Top Performing Airbnb Hosts in City of Poughkeepsie (2026)
Learn from the best! This table showcases top-performing Airbnb hosts in City of Poughkeepsie based on the number of properties managed and estimated total revenue over the past year. Analyze their scale and performance metrics.
| Host Name | Properties | Grossing Revenue | Stay Reviews | Avg Rating |
|---|---|---|---|---|
| Mitchell Lee | 1 | $149,310 | 23 | 4.96/5.0 |
| Amy & Lloyd | 4 | $133,269 | 595 | 4.97/5.0 |
| Christina | 4 | $105,797 | 322 | 4.63/5.0 |
| Chris | 3 | $99,020 | 224 | 4.94/5.0 |
| Allison | 1 | $86,031 | 23 | 4.87/5.0 |
| Evolve | 1 | $80,171 | 18 | 4.72/5.0 |
| Claudia | 1 | $74,307 | 101 | 4.96/5.0 |
| Cecilia | 1 | $71,394 | 76 | 5.00/5.0 |
| Joann | 3 | $63,347 | 133 | 4.97/5.0 |
| Heather | 1 | $57,878 | 54 | 4.93/5.0 |
Analyzing the strategies of top hosts, such as their property selection, pricing, and guest communication, can offer valuable lessons for optimizing your own Airbnb operations in City of Poughkeepsie.
Dive Deeper: Advanced City of Poughkeepsie STR Market Data (2026)
Ready to unlock more insights? AirROI provides access to advanced metrics and comprehensive Airbnb data for City of Poughkeepsie. Explore detailed analytics beyond this report to refine your investment strategy, optimize pricing, and maximize your vacation rental profits.
Explore Advanced MetricsCity of Poughkeepsie Short-Term Rental Market Composition (2026): Property & Room Types
Room Type Distribution
Property Type Distribution
Market Composition Insights for City of Poughkeepsie
- The City of Poughkeepsie Airbnb market composition is heavily skewed towards Entire Home/Apt listings, which make up 78.5% of the 65 active rentals. This indicates strong guest preference for privacy and space.
- Looking at the property type distribution in City of Poughkeepsie, Apartment/Condo properties are the most common (47.7%), reflecting the local real estate landscape.
- Houses represent a significant 43.1% portion, catering likely to families or larger groups.
- The presence of 6.2% Hotel/Boutique listings indicates integration with traditional hospitality.
- Smaller segments like others (combined 3.1%) offer potential for unique stay experiences.
City of Poughkeepsie Airbnb Room Capacity Analysis (2026): Bedroom Distribution
Distribution of Listings by Number of Bedrooms
Room Capacity Insights for City of Poughkeepsie
- The dominant room capacity in City of Poughkeepsie is 1 bedroom listings, making up 26.2% of the market. This suggests a strong demand for properties suitable for couples or solo travelers.
- Together, 1 bedroom and 2 bedrooms properties represent 50.8% of the active Airbnb listings in City of Poughkeepsie, indicating a high concentration in these sizes.
- A significant 23.1% of listings offer 3+ bedrooms, catering to larger groups and families seeking more space in City of Poughkeepsie.
City of Poughkeepsie Vacation Rental Guest Capacity Trends (2026)
Distribution of Listings by Guest Capacity
Guest Capacity Insights for City of Poughkeepsie
- The most common guest capacity trend in City of Poughkeepsie vacation rentals is listings accommodating 4 guests (23.1%). This suggests the primary traveler segment is likely small families or groups.
- Properties designed for 4 guests and 2 guests dominate the City of Poughkeepsie STR market, accounting for 43.1% of listings.
- 24.6% of properties accommodate 6+ guests, serving the market segment for larger families or group travel in City of Poughkeepsie.
- On average, properties in City of Poughkeepsie are equipped to host 3.5 guests.
City of Poughkeepsie Airbnb Booking Patterns (2026): Available vs. Booked Days
Available Days Distribution
Booked Days Distribution
Booking Pattern Insights for City of Poughkeepsie
- The most common availability pattern in City of Poughkeepsie falls within the 271-366 days range, representing 49.2% of listings. This suggests many properties have significant open periods on their calendars.
- Approximately 75.4% of listings show high availability (181+ days open annually), indicating potential for increased bookings or specific owner usage patterns.
- For booked days, the 31-90 days range is most frequent in City of Poughkeepsie (29.2%), reflecting common guest stay durations or potential owner blocking patterns.
- A notable 27.7% of properties secure long booking periods (181+ days booked per year), highlighting successful long-term rental strategies or significant owner usage.
City of Poughkeepsie Airbnb Minimum Stay Requirements Analysis
Distribution of Listings by Minimum Night Requirement
1 Night
30 listings
46.2% of total
2 Nights
14 listings
21.5% of total
3 Nights
3 listings
4.6% of total
4-6 Nights
1 listings
1.5% of total
7-29 Nights
1 listings
1.5% of total
30+ Nights
16 listings
24.6% of total
Key Insights
- The most prevalent minimum stay requirement in City of Poughkeepsie is 1 Night, adopted by 46.2% of listings. This highlights the market's preference for shorter, flexible bookings.
- A strong majority (67.7%) of the City of Poughkeepsie Airbnb data shows acceptance of very short stays (1-2 nights), indicating a dynamic, high-turnover market.
- A significant segment (24.6%) caters to monthly stays (30+ nights) in City of Poughkeepsie, pointing to opportunities in the extended-stay market.
Recommendations
- Align with the market by considering a 1 Night minimum stay, as 46.2% of City of Poughkeepsie hosts use this setting.
- Explore offering discounts for stays of 30+ nights to attract the 24.6% of the market seeking extended stays.
- Adjust minimum nights based on seasonality – potentially shorter during low season and longer during peak demand periods in City of Poughkeepsie.
City of Poughkeepsie Airbnb Cancellation Policy Trends Analysis (2026)
Super Strict 30 Days
1 listings
1.5% of total
Flexible
15 listings
23.1% of total
Moderate
22 listings
33.8% of total
Firm
19 listings
29.2% of total
Strict
8 listings
12.3% of total
Cancellation Policy Insights for City of Poughkeepsie
- The prevailing Airbnb cancellation policy trend in City of Poughkeepsie is Moderate, used by 33.8% of listings.
- There's a relatively balanced mix between guest-friendly (56.9%) and stricter (41.5%) policies, offering choices for different guest needs.
Recommendations for Hosts
- Consider adopting a Moderate policy to align with the 33.8% market standard in City of Poughkeepsie.
- Using a Strict policy might deter some guests, as only 12.3% of listings use it. Evaluate if potential revenue protection outweighs possible lower booking rates.
- Regularly review your cancellation policy against competitors and market demand shifts in City of Poughkeepsie.
City of Poughkeepsie STR Booking Lead Time Analysis (2026)
Average Booking Lead Time by Month
Booking Lead Time Insights for City of Poughkeepsie
- The overall average booking lead time for vacation rentals in City of Poughkeepsie is 44 days.
- Guests book furthest in advance for stays during May (average 80 days), likely coinciding with peak travel demand or local events.
- The shortest booking windows occur for stays in January (average 22 days), indicating more last-minute travel plans during this time.
- Seasonally, Fall (55 days avg.) sees the longest lead times, while Winter (28 days avg.) has the shortest, reflecting typical travel planning cycles.
Recommendations for Hosts
- Use the overall average lead time (44 days) as a baseline for your pricing and availability strategy in City of Poughkeepsie.
- For May stays, consider implementing length-of-stay discounts or slightly higher rates for bookings made less than 80 days out to capitalize on advance planning.
- Target marketing efforts for the Fall season well in advance (at least 55 days) to capture early planners.
- Monitor your own booking lead times against these City of Poughkeepsie averages to identify opportunities for dynamic pricing adjustments.
Popular & Essential Airbnb Amenities in City of Poughkeepsie (2026)
Amenity Prevalence
Amenity Insights for City of Poughkeepsie
- Essential amenities in City of Poughkeepsie that guests expect include: Wifi, Carbon monoxide alarm, Air conditioning, Smoke alarm, Fire extinguisher, Hangers, Heating. Lacking these (any) could significantly impact bookings.
- Popular amenities like Hot water, Refrigerator, Hair dryer are common but not universal. Offering these can provide a competitive edge.
Recommendations for Hosts
- Ensure your listing includes all essential amenities for City of Poughkeepsie: Wifi, Carbon monoxide alarm, Air conditioning, Smoke alarm, Fire extinguisher, Hangers, Heating.
- Prioritize adding missing essentials: Carbon monoxide alarm, Air conditioning, Smoke alarm, Fire extinguisher, Hangers, Heating.
- Consider adding popular differentiators like Hot water or Refrigerator to increase appeal.
- Highlight unique or less common amenities you offer (e.g., hot tub, dedicated workspace, EV charger) in your listing description and photos.
- Regularly check competitor amenities in City of Poughkeepsie to stay competitive.
City of Poughkeepsie Airbnb Guest Demographics & Profile Analysis (2026)
Guest Profile Summary for City of Poughkeepsie
- The typical guest profile for Airbnb in City of Poughkeepsie consists of primarily domestic travelers (93%), often arriving from nearby New York, typically belonging to the Post-2000s (Gen Z/Alpha) group (50%), primarily speaking English or Spanish.
- Domestic travelers account for 93.3% of guests.
- Key international markets include United States (93.3%) and United Kingdom (1.4%).
- Top languages spoken are English (64.1%) followed by Spanish (13%).
- A significant demographic segment is the Post-2000s (Gen Z/Alpha) group, representing 50% of guests.
Recommendations for Hosts
- Target domestic marketing efforts towards travelers from New York and Philadelphia.
- Tailor amenities and listing descriptions to appeal to the dominant Post-2000s (Gen Z/Alpha) demographic (e.g., highlight fast WiFi, smart home features, local guides).
- Highlight unique local experiences or amenities relevant to the primary guest profile.
- Consider seasonal promotions aligned with peak travel times for key origin markets.
Nearby Short-Term Rental Market Comparison
How does the City of Poughkeepsie Airbnb market stack up against its neighbors? Compare key performance metrics like average monthly revenue, ADR, and occupancy rates in surrounding areas to understand the broader regional STR landscape.
| Market | Active Properties | Monthly Revenue | Daily Rate | Avg. Occupancy |
|---|---|---|---|---|
| Town of Kingston | 10 | $6,470 | $473.76 | 49% |
| Frankford Township | 11 | $6,329 | $505.19 | 41% |
| Sag Harbor | 15 | $6,129 | $1280.84 | 40% |
| Town of East Hampton | 1,327 | $5,945 | $986.02 | 36% |
| Spring Lake Heights | 16 | $5,785 | $725.20 | 40% |
| Town of Monroe | 22 | $5,690 | $720.52 | 37% |
| Town of Southampton | 1,201 | $5,620 | $1002.45 | 33% |
| Town of Ancram | 22 | $5,616 | $512.55 | 38% |
| Southampton | 19 | $5,405 | $1456.43 | 30% |
| Neptune City | 12 | $5,299 | $531.14 | 45% |