Buffalo Airbnb Market Analysis 2026: Short Term Rental Data & Vacation Rental Statistics in New York, United States
Is Airbnb profitable in Buffalo in 2026? Explore comprehensive Airbnb analytics for Buffalo, New York, United States to uncover income potential. This 2026 STR market report for Buffalo, based on AirROI data from February 2025 to January 2026, reveals key trends in the market of 773 active listings.
Whether you're considering an Airbnb investment in Buffalo, optimizing your existing vacation rental, or exploring rental arbitrage opportunities, understanding the Buffalo Airbnb data is crucial. Leveraging the low regulation environment is key to maximizing your short term rental income potential. Let's dive into the specifics.
Key Buffalo Airbnb Performance Metrics Overview
Monthly Airbnb Revenue Variations & Income Potential in Buffalo (2026)
Understanding the monthly revenue variations for Airbnb listings in Buffalo is key to maximizing your short term rental income potential. Seasonality significantly impacts earnings. Our analysis, based on data from the past 12 months, shows that the peak revenue month for STRs in Buffalo is typically July, while February often presents the lowest earnings, highlighting opportunities for strategic pricing adjustments during shoulder and low seasons. Explore the typical Airbnb income in Buffalo across different performance tiers:
- Best-in-class properties (Top 10%) achieve $4,861+ monthly, often utilizing dynamic pricing and superior guest experiences.
- Strong performing properties (Top 25%) earn $3,233 or more, indicating effective management and desirable locations/amenities.
- Typical properties (Median) generate around $2,036 per month, representing the average market performance.
- Entry-level properties (Bottom 25%) see earnings around $1,128, often with potential for optimization.
Average Monthly Airbnb Earnings Trend in Buffalo
Buffalo Airbnb Occupancy Rate Trends (2026)
Maximize your bookings by understanding the Buffalo STR occupancy trends. Seasonal demand shifts significantly influence how often properties are booked. Typically, Julysees the highest demand (peak season occupancy), while January experiences the lowest (low season). Effective strategies, like adjusting minimum stays or offering promotions, can boost occupancy during slower periods. Here's how different property tiers perform in Buffalo:
- Best-in-class properties (Top 10%) achieve 80%+ occupancy, indicating high desirability and potentially optimized availability.
- Strong performing properties (Top 25%) maintain 64% or higher occupancy, suggesting good market fit and guest satisfaction.
- Typical properties (Median) have an occupancy rate around 43%.
- Entry-level properties (Bottom 25%) average 23% occupancy, potentially facing higher vacancy.
Average Monthly Occupancy Rate Trend in Buffalo
Average Daily Rate (ADR) Airbnb Trends in Buffalo (2026)
Effective short term rental pricing strategy in Buffalo involves understanding monthly ADR fluctuations. The Average Daily Rate (ADR) for Airbnb in Buffalo typically peaks in September and dips lowest during February. Leveraging Airbnb dynamic pricing tools or strategies based on this seasonality can significantly boost revenue. Here's a look at the typical nightly rates achieved:
- Best-in-class properties (Top 10%) command rates of $301+ per night, often due to premium features or locations.
- Strong performing properties (Top 25%) achieve nightly rates of $208 or more.
- Typical properties (Median) charge around $143 per night.
- Entry-level properties (Bottom 25%) earn around $98 per night.
Average Daily Rate (ADR) Trend by Month in Buffalo
Get Live Buffalo Market Intelligence 👇

Explore Real-time Analytics
Airbnb Seasonality Analysis & Trends in Buffalo (2026)
Peak Season (July, August, September)
- Revenue averages $3,353 per month
- Occupancy rates average 54.1%
- Daily rates average $184
Shoulder Season
- Revenue averages $2,502 per month
- Occupancy maintains around 43.5%
- Daily rates hold near $176
Low Season (January, February, March)
- Revenue drops to average $1,728 per month
- Occupancy decreases to average 37.3%
- Daily rates adjust to average $159
Seasonality Insights for Buffalo
- The Airbnb seasonality in Buffalo shows highly seasonal trends requiring careful strategy. While the sections above show seasonal averages, it's also insightful to look at the extremes:
- During the high season, the absolute peak month showcases Buffalo's highest earning potential, with monthly revenues capable of climbing to $3,688, occupancy reaching a high of 57.3%, and ADRs peaking at $186.
- Conversely, the slowest single month of the year, typically falling within the low season, marks the market's lowest point. In this month, revenue might dip to $1,595, occupancy could drop to 32.5%, and ADRs may adjust down to $152.
- Understanding both the seasonal averages and these monthly peaks and troughs in revenue, occupancy, and ADR is crucial for maximizing your Airbnb profit potential in Buffalo.
Seasonal Strategies for Maximizing Profit
- Peak Season: Maximize revenue through premium pricing and potentially longer minimum stays. Ensure high availability.
- Low Season: Offer competitive pricing, special promotions (e.g., extended stay discounts), and flexible cancellation policies. Target off-season travelers like remote workers or budget-conscious guests.
- Shoulder Seasons: Implement dynamic pricing that balances peak and low rates. Target weekend travelers or specific events. Offer slightly more flexible terms than peak season.
- Regularly analyze your own performance against these Buffalo seasonality benchmarks and adjust your pricing and availability strategy accordingly.
Best Areas for Airbnb Investment in Buffalo (2026)
Exploring the top neighborhoods for short-term rentals in Buffalo? This section highlights key areas, outlining why they are attractive for hosts and guests, along with notable local attractions. Consider these locations based on your target guest profile and investment strategy.
| Neighborhood / Area | Why Host Here? (Target Guests & Appeal) | Key Attractions & Landmarks |
|---|---|---|
| Downtown Buffalo | The bustling heart of the city, known for its proximity to business centers, restaurants, and cultural attractions. Ideal for both business travelers and tourists seeking a city experience. | Canalside, Buffalo Riverworks, KeyBank Center, Coca-Cola Field, Buffalo and Erie County Naval & Military Park |
| Allentown | A historic district with vibrant street life, known for its arts and cultural scene. Attracts young professionals and families wanting a community feel with access to entertainment and events. | Albright-Knox Art Gallery, Allentown Art Festival, Buffalo Historical Society, Tifft Nature Preserve |
| Elmwood Village | A charming neighborhood with boutique shops, cafes, and restaurants. Known for its walkability and community vibe, making it popular among tourists and locals alike. | Elmwood Village Farmer's Market, Buffalo State College, Shea's Performing Arts Center, Buffalo Museum of Science |
| North Buffalo | A residential area that offers a mix of cultures, parks, and proximity to the university. Great for families and travelers seeking a quieter stay with access to local amenities. | Delaware Park, Buffalo Zoo, Bidwell Parkway, North Park Theatre |
| Canalside | A revitalized waterfront area that features parks, restaurants, and entertainment venues. Perfect for tourists looking for outdoor activities and scenic views of the water. | Canalside Park, Buffalo's Outer Harbor, Great Lakes Maritime Museum |
| South Buffalo | A family-friendly neighborhood with a rich history and strong community ties. Popular for those wanting to experience local culture and Irish heritage festivals. | Cazenovia Park, South Park, Buffalo Riverworks |
| West Side | A diverse area known for its cultural richness and variety of ethnic cuisine. Attracts food lovers and those interested in experiencing different cultures. | Buffalo's Historic West Side, Elmwood Avenue shops, Cultural Festivals, Food Markets |
| Fort Erie (near Buffalo) | Just across the border in Canada, offers additional options for travelers visiting the Buffalo area. Known for its own attractions, making it a good alternative for visitors. | Old Fort Erie, Niagara Parks, Crystal Beach |
Understanding Airbnb License Requirements & STR Laws in Buffalo (2026)
While Buffalo, New York, United States currently shows low STR regulations, specific Airbnb license requirements might still exist or change. Always verify the latest short term rental regulations and Airbnb license requirements directly with local government authorities for Buffalo to ensure full compliance before hosting.
(Source: AirROI data, 2026, based on 8% licensed listings)
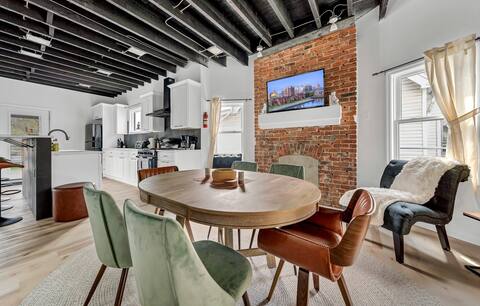
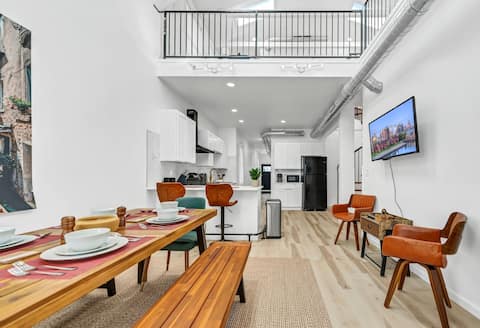
Top Performing Airbnb Properties in Buffalo (2026)
Benchmark your potential! Explore examples of top-performing Airbnb properties in Buffalobased on Trailing Twelve Month (TTM) revenue. Analyze their characteristics, revenue, occupancy rate, and ADR to understand what drives success in this market.

Massive Architecturally Amazing Grand Victorian
Entire Place • 7 bedrooms
Tasteful Full Home Dtown Buffalo
Entire Place • 8 bedrooms

Living Large Downtown
Entire Place • 6 bedrooms
Stylish & Roomy Full House Dtwn
Entire Place • 7 bedrooms

Walkable Elmwood Cottage, No Chores 4Bath 4BR 4Car
Entire Place • 4 bedrooms

Walk Score 90 Parking Fast Wi-Fi
Entire Place • 6 bedrooms
Note: Performance varies based on location, size, amenities, seasonality, and management quality. Data reflects the past 12 months.
Top Performing Airbnb Hosts in Buffalo (2026)
Learn from the best! This table showcases top-performing Airbnb hosts in Buffalo based on the number of properties managed and estimated total revenue over the past year. Analyze their scale and performance metrics.
| Host Name | Properties | Grossing Revenue | Stay Reviews | Avg Rating |
|---|---|---|---|---|
| Owen | 9 | $589,975 | 494 | 4.87/5.0 |
| James | 23 | $563,768 | 317 | 4.77/5.0 |
| Faryal | 10 | $409,584 | 1439 | 4.81/5.0 |
| Linda And Jonathan | 9 | $339,491 | 950 | 4.75/5.0 |
| Jaclyn | 6 | $320,201 | 572 | 4.94/5.0 |
| Salvatory | 10 | $310,756 | 300 | 4.93/5.0 |
| Sandra & Ward | 11 | $306,547 | 1664 | 4.84/5.0 |
| David | 7 | $302,112 | 713 | 4.73/5.0 |
| Justin | 4 | $292,046 | 182 | 4.81/5.0 |
| Darren | 4 | $275,189 | 756 | 4.86/5.0 |
Analyzing the strategies of top hosts, such as their property selection, pricing, and guest communication, can offer valuable lessons for optimizing your own Airbnb operations in Buffalo.
Dive Deeper: Advanced Buffalo STR Market Data (2026)
Ready to unlock more insights? AirROI provides access to advanced metrics and comprehensive Airbnb data for Buffalo. Explore detailed analytics beyond this report to refine your investment strategy, optimize pricing, and maximize your vacation rental profits.
Explore Advanced MetricsBuffalo Short-Term Rental Market Composition (2026): Property & Room Types
Room Type Distribution
Property Type Distribution
Market Composition Insights for Buffalo
- The Buffalo Airbnb market composition is heavily skewed towards Entire Home/Apt listings, which make up 89.4% of the 773 active rentals. This indicates strong guest preference for privacy and space.
- Looking at the property type distribution in Buffalo, Apartment/Condo properties are the most common (59.6%), reflecting the local real estate landscape.
- Houses represent a significant 35.3% portion, catering likely to families or larger groups.
- Smaller segments like hotel/boutique, others, unique stays, outdoor/unique (combined 5.0%) offer potential for unique stay experiences.
Buffalo Airbnb Room Capacity Analysis (2026): Bedroom Distribution
Distribution of Listings by Number of Bedrooms
Room Capacity Insights for Buffalo
- The dominant room capacity in Buffalo is 3 bedrooms listings, making up 27.8% of the market. This suggests a strong demand for properties suitable for families or small groups.
- Together, 3 bedrooms and 2 bedrooms properties represent 53.2% of the active Airbnb listings in Buffalo, indicating a high concentration in these sizes.
- A significant 41.8% of listings offer 3+ bedrooms, catering to larger groups and families seeking more space in Buffalo.
Buffalo Vacation Rental Guest Capacity Trends (2026)
Distribution of Listings by Guest Capacity
Guest Capacity Insights for Buffalo
- The most common guest capacity trend in Buffalo vacation rentals is listings accommodating 8+ guests (21.3%). This suggests the primary traveler segment is likely larger groups.
- Properties designed for 8+ guests and 6 guests dominate the Buffalo STR market, accounting for 41.9% of listings.
- 46.0% of properties accommodate 6+ guests, serving the market segment for larger families or group travel in Buffalo.
- On average, properties in Buffalo are equipped to host 4.7 guests.
Buffalo Airbnb Booking Patterns (2026): Available vs. Booked Days
Available Days Distribution
Booked Days Distribution
Booking Pattern Insights for Buffalo
- The most common availability pattern in Buffalo falls within the 271-366 days range, representing 41.3% of listings. This suggests many properties have significant open periods on their calendars.
- Approximately 75.2% of listings show high availability (181+ days open annually), indicating potential for increased bookings or specific owner usage patterns.
- For booked days, the 91-180 days range is most frequent in Buffalo (35.1%), reflecting common guest stay durations or potential owner blocking patterns.
- A notable 26.0% of properties secure long booking periods (181+ days booked per year), highlighting successful long-term rental strategies or significant owner usage.
Buffalo Airbnb Minimum Stay Requirements Analysis
Distribution of Listings by Minimum Night Requirement
1 Night
219 listings
28.4% of total
2 Nights
197 listings
25.5% of total
3 Nights
20 listings
2.6% of total
4-6 Nights
25 listings
3.2% of total
7-29 Nights
48 listings
6.2% of total
30+ Nights
263 listings
34.1% of total
Key Insights
- The most prevalent minimum stay requirement in Buffalo is 30+ Nights, adopted by 34.1% of listings. This highlights the market's preference for longer commitments.
- A significant segment (34.1%) caters to monthly stays (30+ nights) in Buffalo, pointing to opportunities in the extended-stay market.
Recommendations
- Align with the market by considering a 30+ Nights minimum stay, as 34.1% of Buffalo hosts use this setting.
- If feasible, allowing 1-night stays, especially midweek or during low season, could capture last-minute bookings, as only 28.4% currently do.
- Explore offering discounts for stays of 30+ nights to attract the 34.1% of the market seeking extended stays.
- Adjust minimum nights based on seasonality – potentially shorter during low season and longer during peak demand periods in Buffalo.
Buffalo Airbnb Cancellation Policy Trends Analysis (2026)
Super Strict 30 Days
5 listings
0.6% of total
Limited
9 listings
1.2% of total
Super Strict 60 Days
3 listings
0.4% of total
Flexible
142 listings
18.4% of total
Moderate
216 listings
28% of total
Firm
265 listings
34.3% of total
Strict
132 listings
17.1% of total
Cancellation Policy Insights for Buffalo
- The prevailing Airbnb cancellation policy trend in Buffalo is Firm, used by 34.3% of listings.
- A majority (51.4%) of hosts in Buffalo utilize Firm or Strict policies, indicating a market where hosts prioritize booking security.
Recommendations for Hosts
- Consider adopting a Firm policy to align with the 34.3% market standard in Buffalo.
- Regularly review your cancellation policy against competitors and market demand shifts in Buffalo.
Buffalo STR Booking Lead Time Analysis (2026)
Average Booking Lead Time by Month
Booking Lead Time Insights for Buffalo
- The overall average booking lead time for vacation rentals in Buffalo is 38 days.
- Guests book furthest in advance for stays during November (average 55 days), likely coinciding with peak travel demand or local events.
- The shortest booking windows occur for stays in March (average 23 days), indicating more last-minute travel plans during this time.
- Seasonally, Fall (52 days avg.) sees the longest lead times, while Spring (33 days avg.) has the shortest, reflecting typical travel planning cycles.
Recommendations for Hosts
- Use the overall average lead time (38 days) as a baseline for your pricing and availability strategy in Buffalo.
- For November stays, consider implementing length-of-stay discounts or slightly higher rates for bookings made less than 55 days out to capitalize on advance planning.
- Target marketing efforts for the Fall season well in advance (at least 52 days) to capture early planners.
- Monitor your own booking lead times against these Buffalo averages to identify opportunities for dynamic pricing adjustments.
Popular & Essential Airbnb Amenities in Buffalo (2026)
Amenity Prevalence
Amenity Insights for Buffalo
- Essential amenities in Buffalo that guests expect include: Wifi, Smoke alarm, Carbon monoxide alarm, Heating, TV. Lacking these (any) could significantly impact bookings.
- Popular amenities like Air conditioning, Kitchen, Hot water are common but not universal. Offering these can provide a competitive edge.
Recommendations for Hosts
- Ensure your listing includes all essential amenities for Buffalo: Wifi, Smoke alarm, Carbon monoxide alarm, Heating, TV.
- Prioritize adding missing essentials: Wifi, Smoke alarm, Carbon monoxide alarm, Heating, TV.
- Consider adding popular differentiators like Air conditioning or Kitchen to increase appeal.
- Highlight unique or less common amenities you offer (e.g., hot tub, dedicated workspace, EV charger) in your listing description and photos.
- Regularly check competitor amenities in Buffalo to stay competitive.
Buffalo Airbnb Guest Demographics & Profile Analysis (2026)
Guest Profile Summary for Buffalo
- The typical guest profile for Airbnb in Buffalo consists of primarily domestic travelers (86%), often arriving from nearby New York, typically belonging to the Post-2000s (Gen Z/Alpha) group (50%), primarily speaking English or Spanish.
- Domestic travelers account for 85.9% of guests.
- Key international markets include United States (85.9%) and Canada (7.1%).
- Top languages spoken are English (66.1%) followed by Spanish (11%).
- A significant demographic segment is the Post-2000s (Gen Z/Alpha) group, representing 50% of guests.
Recommendations for Hosts
- Target domestic marketing efforts towards travelers from New York and Buffalo.
- Tailor amenities and listing descriptions to appeal to the dominant Post-2000s (Gen Z/Alpha) demographic (e.g., highlight fast WiFi, smart home features, local guides).
- Highlight unique local experiences or amenities relevant to the primary guest profile.
- Consider seasonal promotions aligned with peak travel times for key origin markets.
Nearby Short-Term Rental Market Comparison
How does the Buffalo Airbnb market stack up against its neighbors? Compare key performance metrics like average monthly revenue, ADR, and occupancy rates in surrounding areas to understand the broader regional STR landscape.
| Market | Active Properties | Monthly Revenue | Daily Rate | Avg. Occupancy |
|---|---|---|---|---|
| Rushville | 16 | $5,126 | $656.66 | 41% |
| Town of Mansfield | 61 | $4,782 | $517.31 | 32% |
| Town of Porter | 22 | $4,724 | $331.03 | 54% |
| Town of Canandaigua | 79 | $4,714 | $488.12 | 42% |
| Eldred Township | 11 | $4,386 | $482.25 | 38% |
| Town of Pulteney | 66 | $4,252 | $428.50 | 43% |
| Town of Elma | 11 | $3,973 | $445.95 | 44% |
| Pine Creek Township | 10 | $3,889 | $230.94 | 57% |
| Naples | 27 | $3,676 | $464.76 | 40% |
| Town of West Seneca | 19 | $3,674 | $277.29 | 47% |