Brooklyn Airbnb Market Analysis 2026: Short Term Rental Data & Vacation Rental Statistics in New York, United States
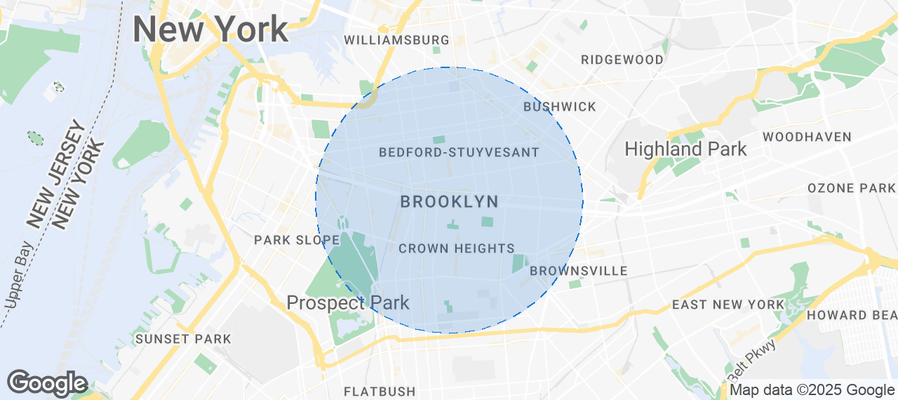
Is Airbnb profitable in Brooklyn in 2026? Explore comprehensive Airbnb analytics for Brooklyn, New York, United States to uncover income potential. This 2026 STR market report for Brooklyn, based on AirROI data from February 2025 to January 2026, reveals key trends in the niche market of 139 active listings.
Whether you're considering an Airbnb investment in Brooklyn, optimizing your existing vacation rental, or exploring rental arbitrage opportunities, understanding the Brooklyn Airbnb data is crucial. Navigating the high regulation landscape is key to maximizing your short term rental income potential. Let's dive into the specifics.
Key Brooklyn Airbnb Performance Metrics Overview
Monthly Airbnb Revenue Variations & Income Potential in Brooklyn (2026)
Understanding the monthly revenue variations for Airbnb listings in Brooklyn is key to maximizing your short term rental income potential. Seasonality significantly impacts earnings. Our analysis, based on data from the past 12 months, shows that the peak revenue month for STRs in Brooklyn is typically December, while May often presents the lowest earnings, highlighting opportunities for strategic pricing adjustments during shoulder and low seasons. Explore the typical Airbnb income in Brooklyn across different performance tiers:
- Best-in-class properties (Top 10%) achieve $6,746+ monthly, often utilizing dynamic pricing and superior guest experiences.
- Strong performing properties (Top 25%) earn $3,932 or more, indicating effective management and desirable locations/amenities.
- Typical properties (Median) generate around $2,118 per month, representing the average market performance.
- Entry-level properties (Bottom 25%) see earnings around $943, often with potential for optimization.
Average Monthly Airbnb Earnings Trend in Brooklyn
Brooklyn Airbnb Occupancy Rate Trends (2026)
Maximize your bookings by understanding the Brooklyn STR occupancy trends. Seasonal demand shifts significantly influence how often properties are booked. Typically, Junesees the highest demand (peak season occupancy), while May experiences the lowest (low season). Effective strategies, like adjusting minimum stays or offering promotions, can boost occupancy during slower periods. Here's how different property tiers perform in Brooklyn:
- Best-in-class properties (Top 10%) achieve 81%+ occupancy, indicating high desirability and potentially optimized availability.
- Strong performing properties (Top 25%) maintain 70% or higher occupancy, suggesting good market fit and guest satisfaction.
- Typical properties (Median) have an occupancy rate around 54%.
- Entry-level properties (Bottom 25%) average 31% occupancy, potentially facing higher vacancy.
Average Monthly Occupancy Rate Trend in Brooklyn
Average Daily Rate (ADR) Airbnb Trends in Brooklyn (2026)
Effective short term rental pricing strategy in Brooklyn involves understanding monthly ADR fluctuations. The Average Daily Rate (ADR) for Airbnb in Brooklyn typically peaks in December and dips lowest during August. Leveraging Airbnb dynamic pricing tools or strategies based on this seasonality can significantly boost revenue. Here's a look at the typical nightly rates achieved:
- Best-in-class properties (Top 10%) command rates of $311+ per night, often due to premium features or locations.
- Strong performing properties (Top 25%) achieve nightly rates of $202 or more.
- Typical properties (Median) charge around $128 per night.
- Entry-level properties (Bottom 25%) earn around $66 per night.
Average Daily Rate (ADR) Trend by Month in Brooklyn
Get Live Brooklyn Market Intelligence 👇
Explore Real-time Analytics
Airbnb Seasonality Analysis & Trends in Brooklyn (2026)
Peak Season (December, October, June)
- Revenue averages $4,142 per month
- Occupancy rates average 62.4%
- Daily rates average $180
Shoulder Season
- Revenue averages $2,483 per month
- Occupancy maintains around 44.5%
- Daily rates hold near $160
Low Season (February, March, April)
- Revenue drops to average $0 per month
- Occupancy decreases to average 0.0%
- Daily rates adjust to average $145
Seasonality Insights for Brooklyn
- The Airbnb seasonality in Brooklyn shows highly seasonal trends requiring careful strategy. While the sections above show seasonal averages, it's also insightful to look at the extremes:
- During the high season, the absolute peak month showcases Brooklyn's highest earning potential, with monthly revenues capable of climbing to $4,791, occupancy reaching a high of 67.6%, and ADRs peaking at $199.
- Conversely, the slowest single month of the year, typically falling within the low season, marks the market's lowest point. In this month, revenue might dip to $0, occupancy could drop to 0.0%, and ADRs may adjust down to $136.
- Understanding both the seasonal averages and these monthly peaks and troughs in revenue, occupancy, and ADR is crucial for maximizing your Airbnb profit potential in Brooklyn.
Seasonal Strategies for Maximizing Profit
- Peak Season: Maximize revenue through premium pricing and potentially longer minimum stays. Ensure high availability.
- Low Season: Offer competitive pricing, special promotions (e.g., extended stay discounts), and flexible cancellation policies. Target off-season travelers like remote workers or budget-conscious guests.
- Shoulder Seasons: Implement dynamic pricing that balances peak and low rates. Target weekend travelers or specific events. Offer slightly more flexible terms than peak season.
- Regularly analyze your own performance against these Brooklyn seasonality benchmarks and adjust your pricing and availability strategy accordingly.
Best Areas for Airbnb Investment in Brooklyn (2026)
Exploring the top neighborhoods for short-term rentals in Brooklyn? This section highlights key areas, outlining why they are attractive for hosts and guests, along with notable local attractions. Consider these locations based on your target guest profile and investment strategy.
| Neighborhood / Area | Why Host Here? (Target Guests & Appeal) | Key Attractions & Landmarks |
|---|---|---|
| Williamsburg | Trendy neighborhood known for its vibrant arts scene, nightlife, and waterfront parks. Attracts young professionals and tourists looking for a lively atmosphere with plenty of restaurants and bars. | Domino Park, Brooklyn Brewery, Smorgasburg, Music venues, East River State Park |
| DUMBO | Iconic area with stunning waterfront views of Manhattan, cobblestone streets, and a mix of art galleries, boutique shops, and tech startups. Highly sought after for its picturesque setting and accessibility to Manhattan. | Brooklyn Bridge Park, St. Ann's Warehouse, Jane's Carousel, DUMBO Arts Festival, Fulton Ferry Landing |
| Park Slope | Family-friendly neighborhood known for its beautiful brownstones, tree-lined streets, and proximity to Prospect Park. Popular with families and those seeking a suburban feel in the city. | Prospect Park, Brooklyn Museum, Brooklyn Botanic Garden, 5th Avenue shopping, Park Slope Food Coop |
| Greenpoint | Quaint and residential area with a strong Polish community and a burgeoning food scene. Appeals to those looking for a more authentic Brooklyn experience with unique bars and eateries. | Transmitter Park, Greenpoint Coffee House, Cardona's Bakery, The Brooklyn Transit Museum, Newtown Creek |
| Bushwick | Artistic and up-and-coming neighborhood known for its street art, warehouses, and hip culture. Attractive for younger travelers and creative professionals. | Bushwick Collective Street Art, Roberta's Pizza, Littleneck, Lumen Festival, Street art tours |
| Brooklyn Heights | Historic neighborhood with stunning brownstones and waterfront views of Manhattan. Popular among tourists for its charm and proximity to attractions. | Brooklyn Heights Promenade, Brooklyn Historical Society, Montague Street shopping, Plymouth Church, Cadman Plaza Park |
| Crown Heights | Diverse neighborhood known for its rich cultural history and vibrant community. Offers a mix of cultural attractions and close proximity to Prospect Park. | Brooklyn Botanic Garden, Prospect Park, Eastern Parkway, Cultural Institutions, Local eateries |
| Fort Greene | Cultural and historic center with a mix of parks, cultural institutions, and a strong community vibe. Ideal for those who enjoy arts and outdoor activities. | Fort Greene Park, Brooklyn Academy of Music, Prince Street, Cultural landmarks, Local markets |
Understanding Airbnb License Requirements & STR Laws in Brooklyn (2026)
Yes, Brooklyn, New York, United States enforces high STR regulations. Obtaining a license and ensuring compliance is almost certainly required according to current 2026 STR laws. Always verify the latest short term rental regulations and Airbnb license requirements directly with local government authorities for Brooklyn to ensure full compliance before hosting.
(Source: AirROI data, 2026, based on 32% licensed listings)
Top Performing Airbnb Properties in Brooklyn (2026)
Benchmark your potential! Explore examples of top-performing Airbnb properties in Brooklynbased on Trailing Twelve Month (TTM) revenue. Analyze their characteristics, revenue, occupancy rate, and ADR to understand what drives success in this market.
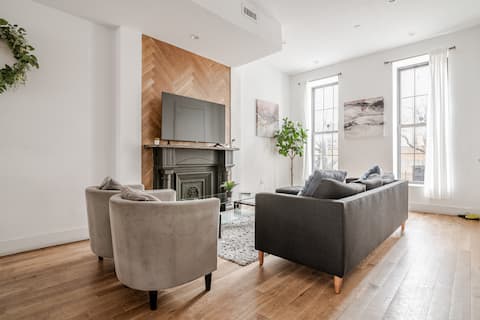
Spacious Townhouse in Brooklyn
Entire Place • 4 bedrooms
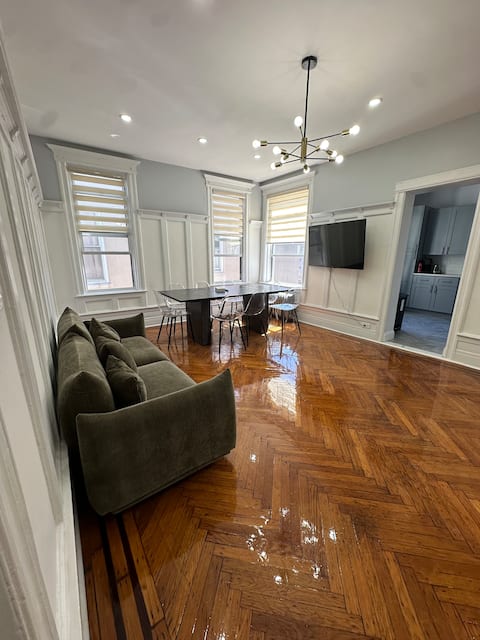
Beautiful Brooklyn brownstone! 1 block from Subway
Entire Place • 4 bedrooms
Brooklyn Crown Heights: Cozy Private Home
Entire Place • 4 bedrooms
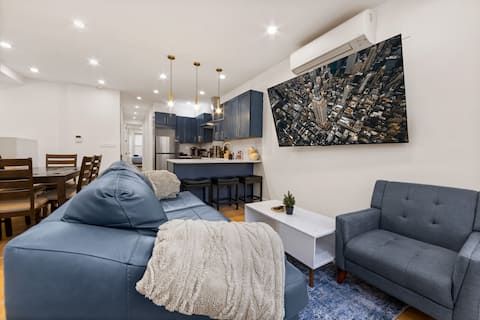
2BR Combined Getaway in Brooklyn
Entire Place • 2 bedrooms

Beautiful Brooklyn brownstone! 1 block from Subway
Entire Place • 3 bedrooms
Perfect Brooklyn Duo Escape
Entire Place • 2 bedrooms
Note: Performance varies based on location, size, amenities, seasonality, and management quality. Data reflects the past 12 months.
Top Performing Airbnb Hosts in Brooklyn (2026)
Learn from the best! This table showcases top-performing Airbnb hosts in Brooklyn based on the number of properties managed and estimated total revenue over the past year. Analyze their scale and performance metrics.
| Host Name | Properties | Grossing Revenue | Stay Reviews | Avg Rating |
|---|---|---|---|---|
| Emily And Saul | 11 | $466,985 | 158 | 4.26/5.0 |
| Tawhid | 2 | $205,649 | 26 | 4.25/5.0 |
| Mushka | 1 | $100,927 | 32 | 4.94/5.0 |
| Israel | 1 | $87,414 | 46 | 4.59/5.0 |
| Imrul | 6 | $86,551 | 9 | 5.00/5.0 |
| Ricky | 7 | $86,010 | 46 | 4.74/5.0 |
| Yisroel | 1 | $74,851 | 27 | 4.85/5.0 |
| Shmuel | 1 | $55,725 | 21 | 4.90/5.0 |
| Shera | 2 | $53,140 | 41 | 4.88/5.0 |
| Amber | 1 | $44,881 | 3 | 5.00/5.0 |
Analyzing the strategies of top hosts, such as their property selection, pricing, and guest communication, can offer valuable lessons for optimizing your own Airbnb operations in Brooklyn.
Dive Deeper: Advanced Brooklyn STR Market Data (2026)
Ready to unlock more insights? AirROI provides access to advanced metrics and comprehensive Airbnb data for Brooklyn. Explore detailed analytics beyond this report to refine your investment strategy, optimize pricing, and maximize your vacation rental profits.
Explore Advanced MetricsBrooklyn Short-Term Rental Market Composition (2026): Property & Room Types
Room Type Distribution
Property Type Distribution
Market Composition Insights for Brooklyn
- The Brooklyn Airbnb market composition is heavily skewed towards Entire Home/Apt listings, which make up 48.2% of the 139 active rentals. This indicates strong guest preference for privacy and space.
- However, a notable 47.5% share for Private Rooms suggests opportunities for budget-conscious travelers or hosts renting out spare rooms.
- Looking at the property type distribution in Brooklyn, Apartment/Condo properties are the most common (74.8%), reflecting the local real estate landscape.
- Houses represent a significant 23% portion, catering likely to families or larger groups.
- Smaller segments like others, hotel/boutique (combined 2.1%) offer potential for unique stay experiences.
Brooklyn Airbnb Room Capacity Analysis (2026): Bedroom Distribution
Distribution of Listings by Number of Bedrooms
Room Capacity Insights for Brooklyn
- The dominant room capacity in Brooklyn is 2 bedrooms listings, making up 20.1% of the market. This suggests a strong demand for properties suitable for couples or solo travelers.
- Together, 2 bedrooms and 1 bedroom properties represent 39.5% of the active Airbnb listings in Brooklyn, indicating a high concentration in these sizes.
- Listings with 3+ bedrooms (8.6%) represent a smaller niche, potentially indicating an underserved market for larger group accommodations in Brooklyn.
Brooklyn Vacation Rental Guest Capacity Trends (2026)
Distribution of Listings by Guest Capacity
Guest Capacity Insights for Brooklyn
- The most common guest capacity trend in Brooklyn vacation rentals is listings accommodating 2 guests (15.8%). This suggests the primary traveler segment is likely couples or solo travelers.
- Properties designed for 2 guests and 4 guests dominate the Brooklyn STR market, accounting for 30.2% of listings.
- On average, properties in Brooklyn are equipped to host 1.8 guests.
Brooklyn Airbnb Booking Patterns (2026): Available vs. Booked Days
Available Days Distribution
Booked Days Distribution
Booking Pattern Insights for Brooklyn
- The most common availability pattern in Brooklyn falls within the 271-366 days range, representing 54% of listings. This suggests many properties have significant open periods on their calendars.
- Approximately 90.7% of listings show high availability (181+ days open annually), indicating potential for increased bookings or specific owner usage patterns.
- For booked days, the 31-90 days range is most frequent in Brooklyn (41%), reflecting common guest stay durations or potential owner blocking patterns.
- A notable 9.4% of properties secure long booking periods (181+ days booked per year), highlighting successful long-term rental strategies or significant owner usage.
Brooklyn Airbnb Minimum Stay Requirements Analysis
Distribution of Listings by Minimum Night Requirement
1 Night
15 listings
10.8% of total
2 Nights
4 listings
2.9% of total
3 Nights
1 listings
0.7% of total
4-6 Nights
3 listings
2.2% of total
7-29 Nights
7 listings
5% of total
30+ Nights
109 listings
78.4% of total
Key Insights
- The most prevalent minimum stay requirement in Brooklyn is 30+ Nights, adopted by 78.4% of listings. This highlights the market's preference for longer commitments.
- Very short stays (1-2 nights) are less common (13.7%), suggesting hosts prefer slightly longer bookings to optimize turnover.
- A significant segment (78.4%) caters to monthly stays (30+ nights) in Brooklyn, pointing to opportunities in the extended-stay market.
Recommendations
- Align with the market by considering a 30+ Nights minimum stay, as 78.4% of Brooklyn hosts use this setting.
- If feasible, allowing 1-night stays, especially midweek or during low season, could capture last-minute bookings, as only 10.8% currently do.
- Explore offering discounts for stays of 30+ nights to attract the 78.4% of the market seeking extended stays.
- Adjust minimum nights based on seasonality – potentially shorter during low season and longer during peak demand periods in Brooklyn.
Brooklyn Airbnb Cancellation Policy Trends Analysis (2026)
Limited
10 listings
7.2% of total
Flexible
60 listings
43.2% of total
Moderate
18 listings
12.9% of total
Firm
38 listings
27.3% of total
Strict
13 listings
9.4% of total
Cancellation Policy Insights for Brooklyn
- The prevailing Airbnb cancellation policy trend in Brooklyn is Flexible, used by 43.2% of listings.
- There's a relatively balanced mix between guest-friendly (56.1%) and stricter (36.7%) policies, offering choices for different guest needs.
- Strict cancellation policies are quite rare (9.4%), potentially making listings with this policy less competitive unless justified by high demand or property type.
Recommendations for Hosts
- Consider adopting a Flexible policy to align with the 43.2% market standard in Brooklyn.
- Using a Strict policy might deter some guests, as only 9.4% of listings use it. Evaluate if potential revenue protection outweighs possible lower booking rates.
- Regularly review your cancellation policy against competitors and market demand shifts in Brooklyn.
Brooklyn STR Booking Lead Time Analysis (2026)
Average Booking Lead Time by Month
Booking Lead Time Insights for Brooklyn
- The overall average booking lead time for vacation rentals in Brooklyn is 17 days.
- Guests book furthest in advance for stays during October (average 33 days), likely coinciding with peak travel demand or local events.
- The shortest booking windows occur for stays in April (average 0 days), indicating more last-minute travel plans during this time.
- Seasonally, Fall (29 days avg.) sees the longest lead times, while Spring (0 days avg.) has the shortest, reflecting typical travel planning cycles.
Recommendations for Hosts
- Use the overall average lead time (17 days) as a baseline for your pricing and availability strategy in Brooklyn.
- For October stays, consider implementing length-of-stay discounts or slightly higher rates for bookings made less than 33 days out to capitalize on advance planning.
- During April, focus on last-minute booking availability and promotions, as guests book with very short notice (0 days avg.).
- Target marketing efforts for the Fall season well in advance (at least 29 days) to capture early planners.
- Monitor your own booking lead times against these Brooklyn averages to identify opportunities for dynamic pricing adjustments.
Popular & Essential Airbnb Amenities in Brooklyn (2026)
Amenity Prevalence
Amenity Insights for Brooklyn
- Essential amenities in Brooklyn that guests expect include: Wifi, Smoke alarm. Lacking these (any) could significantly impact bookings.
- Popular amenities like Air conditioning, Kitchen, Heating are common but not universal. Offering these can provide a competitive edge.
Recommendations for Hosts
- Ensure your listing includes all essential amenities for Brooklyn: Wifi, Smoke alarm.
- Prioritize adding missing essentials: Wifi, Smoke alarm.
- Consider adding popular differentiators like Air conditioning or Kitchen to increase appeal.
- Highlight unique or less common amenities you offer (e.g., hot tub, dedicated workspace, EV charger) in your listing description and photos.
- Regularly check competitor amenities in Brooklyn to stay competitive.
Brooklyn Airbnb Guest Demographics & Profile Analysis (2026)
Guest Profile Summary for Brooklyn
- The typical guest profile for Airbnb in Brooklyn consists of primarily domestic travelers (71%), often arriving from nearby New York, typically belonging to the Post-2000s (Gen Z/Alpha) group (50%), primarily speaking English or Spanish.
- Domestic travelers account for 70.7% of guests.
- Key international markets include United States (70.7%) and United Kingdom (4%).
- Top languages spoken are English (52.3%) followed by Spanish (16.5%).
- A significant demographic segment is the Post-2000s (Gen Z/Alpha) group, representing 50% of guests.
Recommendations for Hosts
- Target domestic marketing efforts towards travelers from New York and Los Angeles.
- Tailor amenities and listing descriptions to appeal to the dominant Post-2000s (Gen Z/Alpha) demographic (e.g., highlight fast WiFi, smart home features, local guides).
- Highlight unique local experiences or amenities relevant to the primary guest profile.
- Consider seasonal promotions aligned with peak travel times for key origin markets.
Nearby Short-Term Rental Market Comparison
How does the Brooklyn Airbnb market stack up against its neighbors? Compare key performance metrics like average monthly revenue, ADR, and occupancy rates in surrounding areas to understand the broader regional STR landscape.
| Market | Active Properties | Monthly Revenue | Daily Rate | Avg. Occupancy |
|---|---|---|---|---|
| Town of Kingston | 10 | $6,470 | $473.76 | 49% |
| Frankford Township | 11 | $6,329 | $505.19 | 41% |
| Sag Harbor | 15 | $6,129 | $1280.84 | 40% |
| Town of East Hampton | 1,327 | $5,945 | $986.02 | 36% |
| Spring Lake Heights | 16 | $5,785 | $725.20 | 40% |
| Town of Monroe | 22 | $5,690 | $720.52 | 37% |
| Town of Southampton | 1,201 | $5,620 | $1002.45 | 33% |
| Stone Harbor | 42 | $5,467 | $785.22 | 39% |
| Southampton | 19 | $5,405 | $1456.43 | 30% |
| Neptune City | 12 | $5,299 | $531.14 | 45% |