Somers Airbnb Market Analysis 2026: Short Term Rental Data & Vacation Rental Statistics in Montana, United States
Is Airbnb profitable in Somers in 2026? Explore comprehensive Airbnb analytics for Somers, Montana, United States to uncover income potential. This 2026 STR market report for Somers, based on AirROI data from February 2025 to January 2026, reveals key trends in the niche market of 77 active listings.
Whether you're considering an Airbnb investment in Somers, optimizing your existing vacation rental, or exploring rental arbitrage opportunities, understanding the Somers Airbnb data is crucial. Leveraging the low regulation environment is key to maximizing your short term rental income potential. Let's dive into the specifics.
Key Somers Airbnb Performance Metrics Overview
Monthly Airbnb Revenue Variations & Income Potential in Somers (2026)
Understanding the monthly revenue variations for Airbnb listings in Somers is key to maximizing your short term rental income potential. Seasonality significantly impacts earnings. Our analysis, based on data from the past 12 months, shows that the peak revenue month for STRs in Somers is typically July, while February often presents the lowest earnings, highlighting opportunities for strategic pricing adjustments during shoulder and low seasons. Explore the typical Airbnb income in Somers across different performance tiers:
- Best-in-class properties (Top 10%) achieve $9,590+ monthly, often utilizing dynamic pricing and superior guest experiences.
- Strong performing properties (Top 25%) earn $5,318 or more, indicating effective management and desirable locations/amenities.
- Typical properties (Median) generate around $3,184 per month, representing the average market performance.
- Entry-level properties (Bottom 25%) see earnings around $1,643, often with potential for optimization.
Average Monthly Airbnb Earnings Trend in Somers
Somers Airbnb Occupancy Rate Trends (2026)
Maximize your bookings by understanding the Somers STR occupancy trends. Seasonal demand shifts significantly influence how often properties are booked. Typically, Julysees the highest demand (peak season occupancy), while March experiences the lowest (low season). Effective strategies, like adjusting minimum stays or offering promotions, can boost occupancy during slower periods. Here's how different property tiers perform in Somers:
- Best-in-class properties (Top 10%) achieve 68%+ occupancy, indicating high desirability and potentially optimized availability.
- Strong performing properties (Top 25%) maintain 55% or higher occupancy, suggesting good market fit and guest satisfaction.
- Typical properties (Median) have an occupancy rate around 36%.
- Entry-level properties (Bottom 25%) average 21% occupancy, potentially facing higher vacancy.
Average Monthly Occupancy Rate Trend in Somers
Average Daily Rate (ADR) Airbnb Trends in Somers (2026)
Effective short term rental pricing strategy in Somers involves understanding monthly ADR fluctuations. The Average Daily Rate (ADR) for Airbnb in Somers typically peaks in July and dips lowest during February. Leveraging Airbnb dynamic pricing tools or strategies based on this seasonality can significantly boost revenue. Here's a look at the typical nightly rates achieved:
- Best-in-class properties (Top 10%) command rates of $788+ per night, often due to premium features or locations.
- Strong performing properties (Top 25%) achieve nightly rates of $442 or more.
- Typical properties (Median) charge around $277 per night.
- Entry-level properties (Bottom 25%) earn around $186 per night.
Average Daily Rate (ADR) Trend by Month in Somers
Get Live Somers Market Intelligence 👇

Explore Real-time Analytics
Airbnb Seasonality Analysis & Trends in Somers (2026)
Peak Season (July, August, June)
- Revenue averages $9,101 per month
- Occupancy rates average 62.7%
- Daily rates average $439
Shoulder Season
- Revenue averages $4,179 per month
- Occupancy maintains around 35.5%
- Daily rates hold near $390
Low Season (January, February, March)
- Revenue drops to average $1,744 per month
- Occupancy decreases to average 23.0%
- Daily rates adjust to average $362
Seasonality Insights for Somers
- The Airbnb seasonality in Somers shows highly seasonal trends requiring careful strategy. While the sections above show seasonal averages, it's also insightful to look at the extremes:
- During the high season, the absolute peak month showcases Somers's highest earning potential, with monthly revenues capable of climbing to $10,604, occupancy reaching a high of 68.5%, and ADRs peaking at $446.
- Conversely, the slowest single month of the year, typically falling within the low season, marks the market's lowest point. In this month, revenue might dip to $1,382, occupancy could drop to 22.3%, and ADRs may adjust down to $352.
- Understanding both the seasonal averages and these monthly peaks and troughs in revenue, occupancy, and ADR is crucial for maximizing your Airbnb profit potential in Somers.
Seasonal Strategies for Maximizing Profit
- Peak Season: Maximize revenue through premium pricing and potentially longer minimum stays. Ensure high availability.
- Low Season: Offer competitive pricing, special promotions (e.g., extended stay discounts), and flexible cancellation policies. Target off-season travelers like remote workers or budget-conscious guests.
- Shoulder Seasons: Implement dynamic pricing that balances peak and low rates. Target weekend travelers or specific events. Offer slightly more flexible terms than peak season.
- Regularly analyze your own performance against these Somers seasonality benchmarks and adjust your pricing and availability strategy accordingly.
Best Areas for Airbnb Investment in Somers (2026)
Exploring the top neighborhoods for short-term rentals in Somers? This section highlights key areas, outlining why they are attractive for hosts and guests, along with notable local attractions. Consider these locations based on your target guest profile and investment strategy.
| Neighborhood / Area | Why Host Here? (Target Guests & Appeal) | Key Attractions & Landmarks |
|---|---|---|
| Flathead Lake Area | The largest natural lake in the western US, known for its picturesque views and recreational activities. A great spot for water sports, fishing, and enjoying nature. | Flathead Lake, Wild Horse Island, Marina parks, Fishing access points, State parks surrounding the lake |
| Glacier National Park | A world-renowned national park known for its stunning landscapes, hiking trails, and diverse wildlife. A major destination for outdoor enthusiasts. | Going-to-the-Sun Road, Many Glacier, Glacier Hiking Trails, Logan Pass, St. Mary Lake |
| Somers Town | A quaint town on the shores of Flathead Lake, perfect for families and couples seeking a quiet getaway. The local community and charm attract visitors year-round. | Somers Beach, Local dining, Community events, Lake access, Nearby hiking |
| Kalispell | The largest city in the Flathead Valley, it provides urban amenities and is close to many attractions, making it ideal for visitors wanting convenience. | Hockaday Museum of Art, Kalispell Farmers Market, Arts and cultural events, Shopping and dining options, Nearby Flathead Lake |
| Whitefish | A popular resort town known for skiing in winter and its vibrant downtown full of shops and restaurants. It draws both winter sports enthusiasts and summer tourists. | Whitefish Mountain Resort, Whitefish Lake, Downtown Whitefish shops and dining, Hiking trails, Summer music festivals |
| Bigfork | A charming small town on the northeast shore of Flathead Lake, known for its arts scene and beautiful waterfront. Attractive to those looking for a peaceful retreat. | Bigfork Summer Playhouse, Wild Horse Island State Park, Art galleries, Local boutiques, Waterfront parks |
| Lakeside | A scenic community on Flathead Lake with beautiful views and outdoor activities. Ideal for those looking for relaxation and water-related activities. | Lakeside Beach, Lake water sports, Local eateries, Nature trails, Picnic areas |
| Polson | Located at the southern end of Flathead Lake, Polson is the gateway to the Mission Mountains, providing outdoor adventure opportunities and local culture. | Polson Flathead Historical Museum, Kerr Dam, Moose Country Bar & Grill, Flathead Lake State Park, Mission Mountain Tribal Wildlife Area |
Understanding Airbnb License Requirements & STR Laws in Somers (2026)
While Somers, Montana, United States currently shows low STR regulations, specific Airbnb license requirements might still exist or change. Always verify the latest short term rental regulations and Airbnb license requirements directly with local government authorities for Somers to ensure full compliance before hosting.
(Source: AirROI data, 2026, finding no licensed listings among those analyzed)
Top Performing Airbnb Properties in Somers (2026)
Benchmark your potential! Explore examples of top-performing Airbnb properties in Somersbased on Trailing Twelve Month (TTM) revenue. Analyze their characteristics, revenue, occupancy rate, and ADR to understand what drives success in this market.
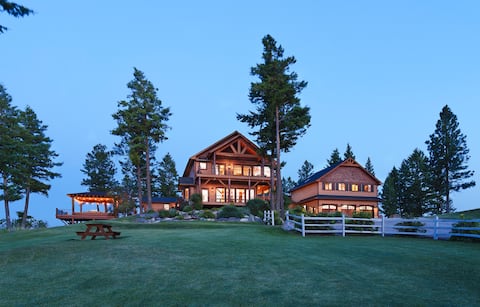
Luxury Lake View Mountain Escape
Entire Place • 6 bedrooms

6BR Lakeside Luxury | Close to Skiing | Sauna&Spa
Entire Place • 6 bedrooms
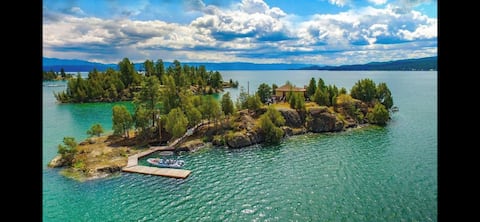
PRIVATE ISLAND On Gorgeous Flathead Lake Montana!!
Entire Place • 4 bedrooms
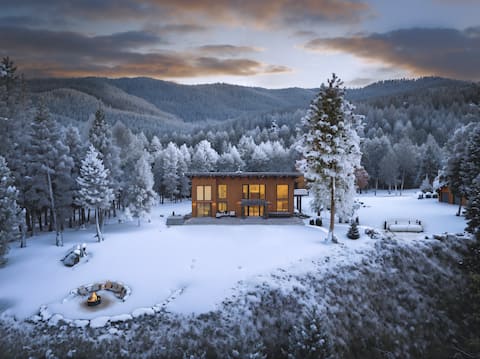
Flathead Lake | Hot Tub, Fire Pit & Forest Views
Entire Place • 5 bedrooms

Enjoy winter on Flathead Lake-monthly discounts!
Entire Place • 4 bedrooms
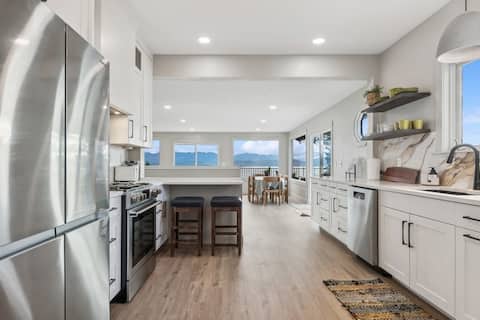
Breathtaking views of Flathead Lake
Entire Place • 6 bedrooms
Note: Performance varies based on location, size, amenities, seasonality, and management quality. Data reflects the past 12 months.
Top Performing Airbnb Hosts in Somers (2026)
Learn from the best! This table showcases top-performing Airbnb hosts in Somers based on the number of properties managed and estimated total revenue over the past year. Analyze their scale and performance metrics.
| Host Name | Properties | Grossing Revenue | Stay Reviews | Avg Rating |
|---|---|---|---|---|
| Kaci Vacation Flathead | 1 | $270,906 | 18 | 5.00/5.0 |
| Jeff And Bridget | 1 | $213,897 | 26 | 4.96/5.0 |
| Dess | 1 | $192,662 | 32 | 5.00/5.0 |
| Cheryl | 3 | $187,483 | 241 | 4.93/5.0 |
| Wander | 1 | $171,299 | 15 | 5.00/5.0 |
| Aja | 4 | $147,548 | 49 | 4.89/5.0 |
| Linda | 4 | $146,308 | 715 | 5.00/5.0 |
| Gearhart | 3 | $143,258 | 204 | 4.91/5.0 |
| Tia | 4 | $122,032 | 69 | 4.99/5.0 |
| Bruce | 5 | $100,532 | 104 | 4.97/5.0 |
Analyzing the strategies of top hosts, such as their property selection, pricing, and guest communication, can offer valuable lessons for optimizing your own Airbnb operations in Somers.
Dive Deeper: Advanced Somers STR Market Data (2026)
Ready to unlock more insights? AirROI provides access to advanced metrics and comprehensive Airbnb data for Somers. Explore detailed analytics beyond this report to refine your investment strategy, optimize pricing, and maximize your vacation rental profits.
Explore Advanced MetricsSomers Short-Term Rental Market Composition (2026): Property & Room Types
Room Type Distribution
Property Type Distribution
Market Composition Insights for Somers
- The Somers Airbnb market composition is heavily skewed towards Entire Home/Apt listings, which make up 89.6% of the 77 active rentals. This indicates strong guest preference for privacy and space.
- Looking at the property type distribution in Somers, House properties are the most common (50.6%), reflecting the local real estate landscape.
- Houses represent a significant 50.6% portion, catering likely to families or larger groups.
- The presence of 13% Hotel/Boutique listings indicates integration with traditional hospitality.
- Smaller segments like unique stays, others (combined 3.9%) offer potential for unique stay experiences.
Somers Airbnb Room Capacity Analysis (2026): Bedroom Distribution
Distribution of Listings by Number of Bedrooms
Room Capacity Insights for Somers
- The dominant room capacity in Somers is 1 bedroom listings, making up 39% of the market. This suggests a strong demand for properties suitable for couples or solo travelers.
- Together, 1 bedroom and 3 bedrooms properties represent 61.1% of the active Airbnb listings in Somers, indicating a high concentration in these sizes.
- A significant 42.9% of listings offer 3+ bedrooms, catering to larger groups and families seeking more space in Somers.
Somers Vacation Rental Guest Capacity Trends (2026)
Distribution of Listings by Guest Capacity
Guest Capacity Insights for Somers
- The most common guest capacity trend in Somers vacation rentals is listings accommodating 8+ guests (29.9%). This suggests the primary traveler segment is likely larger groups.
- Properties designed for 8+ guests and 2 guests dominate the Somers STR market, accounting for 58.5% of listings.
- 48.1% of properties accommodate 6+ guests, serving the market segment for larger families or group travel in Somers.
- On average, properties in Somers are equipped to host 5.0 guests.
Somers Airbnb Booking Patterns (2026): Available vs. Booked Days
Available Days Distribution
Booked Days Distribution
Booking Pattern Insights for Somers
- The most common availability pattern in Somers falls within the 271-366 days range, representing 50.6% of listings. This suggests many properties have significant open periods on their calendars.
- Approximately 90.9% of listings show high availability (181+ days open annually), indicating potential for increased bookings or specific owner usage patterns.
- For booked days, the 91-180 days range is most frequent in Somers (42.9%), reflecting common guest stay durations or potential owner blocking patterns.
- A notable 9.1% of properties secure long booking periods (181+ days booked per year), highlighting successful long-term rental strategies or significant owner usage.
Somers Airbnb Minimum Stay Requirements Analysis
Distribution of Listings by Minimum Night Requirement
1 Night
13 listings
16.9% of total
2 Nights
16 listings
20.8% of total
3 Nights
6 listings
7.8% of total
4-6 Nights
7 listings
9.1% of total
30+ Nights
35 listings
45.5% of total
Key Insights
- The most prevalent minimum stay requirement in Somers is 30+ Nights, adopted by 45.5% of listings. This highlights the market's preference for longer commitments.
- A significant segment (45.5%) caters to monthly stays (30+ nights) in Somers, pointing to opportunities in the extended-stay market.
Recommendations
- Align with the market by considering a 30+ Nights minimum stay, as 45.5% of Somers hosts use this setting.
- If feasible, allowing 1-night stays, especially midweek or during low season, could capture last-minute bookings, as only 16.9% currently do.
- Explore offering discounts for stays of 30+ nights to attract the 45.5% of the market seeking extended stays.
- Adjust minimum nights based on seasonality – potentially shorter during low season and longer during peak demand periods in Somers.
Somers Airbnb Cancellation Policy Trends Analysis (2026)
Super Strict 30 Days
6 listings
7.8% of total
Limited
2 listings
2.6% of total
Super Strict 60 Days
5 listings
6.5% of total
Flexible
17 listings
22.1% of total
Moderate
9 listings
11.7% of total
Firm
29 listings
37.7% of total
Strict
9 listings
11.7% of total
Cancellation Policy Insights for Somers
- The prevailing Airbnb cancellation policy trend in Somers is Firm, used by 37.7% of listings.
- There's a relatively balanced mix between guest-friendly (33.8%) and stricter (49.4%) policies, offering choices for different guest needs.
Recommendations for Hosts
- Consider adopting a Firm policy to align with the 37.7% market standard in Somers.
- Using a Strict policy might deter some guests, as only 11.7% of listings use it. Evaluate if potential revenue protection outweighs possible lower booking rates.
- Regularly review your cancellation policy against competitors and market demand shifts in Somers.
Somers STR Booking Lead Time Analysis (2026)
Average Booking Lead Time by Month
Booking Lead Time Insights for Somers
- The overall average booking lead time for vacation rentals in Somers is 75 days.
- Guests book furthest in advance for stays during July (average 112 days), likely coinciding with peak travel demand or local events.
- The shortest booking windows occur for stays in February (average 26 days), indicating more last-minute travel plans during this time.
- Seasonally, Summer (98 days avg.) sees the longest lead times, while Winter (33 days avg.) has the shortest, reflecting typical travel planning cycles.
Recommendations for Hosts
- Use the overall average lead time (75 days) as a baseline for your pricing and availability strategy in Somers.
- For July stays, consider implementing length-of-stay discounts or slightly higher rates for bookings made less than 112 days out to capitalize on advance planning.
- Target marketing efforts for the Summer season well in advance (at least 98 days) to capture early planners.
- Monitor your own booking lead times against these Somers averages to identify opportunities for dynamic pricing adjustments.
Popular & Essential Airbnb Amenities in Somers (2026)
Amenity Prevalence
Amenity Insights for Somers
- Essential amenities in Somers that guests expect include: Free parking on premises. Lacking these (this) could significantly impact bookings.
- Popular amenities like Hot water, Dishes and silverware, Smoke alarm are common but not universal. Offering these can provide a competitive edge.
- Warning: Wifi is not universally provided but is considered essential globally. Ensure reliable Wifi is offered.
Recommendations for Hosts
- Ensure your listing includes all essential amenities for Somers: Free parking on premises.
- Prioritize adding missing essentials: Free parking on premises.
- Consider adding popular differentiators like Hot water or Dishes and silverware to increase appeal.
- Highlight unique or less common amenities you offer (e.g., hot tub, dedicated workspace, EV charger) in your listing description and photos.
- Regularly check competitor amenities in Somers to stay competitive.
Somers Airbnb Guest Demographics & Profile Analysis (2026)
Guest Profile Summary for Somers
- The typical guest profile for Airbnb in Somers consists of primarily domestic travelers (96%), often arriving from nearby Bozeman, typically belonging to the Post-2000s (Gen Z/Alpha) group (50%), primarily speaking English or Spanish.
- Domestic travelers account for 95.6% of guests.
- Key international markets include United States (95.6%) and Canada (1.5%).
- Top languages spoken are English (78.9%) followed by Spanish (8.6%).
- A significant demographic segment is the Post-2000s (Gen Z/Alpha) group, representing 50% of guests.
Recommendations for Hosts
- Target domestic marketing efforts towards travelers from Bozeman and Phoenix.
- Tailor amenities and listing descriptions to appeal to the dominant Post-2000s (Gen Z/Alpha) demographic (e.g., highlight fast WiFi, smart home features, local guides).
- Highlight unique local experiences or amenities relevant to the primary guest profile.
- Consider seasonal promotions aligned with peak travel times for key origin markets.
Nearby Short-Term Rental Market Comparison
How does the Somers Airbnb market stack up against its neighbors? Compare key performance metrics like average monthly revenue, ADR, and occupancy rates in surrounding areas to understand the broader regional STR landscape.
| Market | Active Properties | Monthly Revenue | Daily Rate | Avg. Occupancy |
|---|---|---|---|---|
| West Glacier | 90 | $4,297 | $391.29 | 58% |
| Whitefish | 1,037 | $3,994 | $450.24 | 40% |
| Lakeside | 141 | $3,201 | $416.76 | 40% |
| Area B (Lake Koocanusa) | 25 | $3,156 | $426.19 | 40% |
| Babb | 63 | $3,127 | $282.03 | 60% |
| Area A (Upper Flathead/Elk Valley) | 230 | $3,082 | $286.60 | 41% |
| Dayton | 14 | $3,049 | $418.01 | 44% |
| Columbia Falls | 569 | $3,030 | $317.64 | 50% |
| Martin City | 51 | $3,021 | $256.01 | 56% |
| Polson | 140 | $2,880 | $362.31 | 44% |