Missoula Airbnb Market Analysis 2026: Short Term Rental Data & Vacation Rental Statistics in Montana, United States
Is Airbnb profitable in Missoula in 2026? Explore comprehensive Airbnb analytics for Missoula, Montana, United States to uncover income potential. This 2026 STR market report for Missoula, based on AirROI data from February 2025 to January 2026, reveals key trends in the market of 560 active listings.
Whether you're considering an Airbnb investment in Missoula, optimizing your existing vacation rental, or exploring rental arbitrage opportunities, understanding the Missoula Airbnb data is crucial. Navigating the high regulation landscape is key to maximizing your short term rental income potential. Let's dive into the specifics.
Key Missoula Airbnb Performance Metrics Overview
Monthly Airbnb Revenue Variations & Income Potential in Missoula (2026)
Understanding the monthly revenue variations for Airbnb listings in Missoula is key to maximizing your short term rental income potential. Seasonality significantly impacts earnings. Our analysis, based on data from the past 12 months, shows that the peak revenue month for STRs in Missoula is typically July, while January often presents the lowest earnings, highlighting opportunities for strategic pricing adjustments during shoulder and low seasons. Explore the typical Airbnb income in Missoula across different performance tiers:
- Best-in-class properties (Top 10%) achieve $6,151+ monthly, often utilizing dynamic pricing and superior guest experiences.
- Strong performing properties (Top 25%) earn $4,222 or more, indicating effective management and desirable locations/amenities.
- Typical properties (Median) generate around $2,667 per month, representing the average market performance.
- Entry-level properties (Bottom 25%) see earnings around $1,614, often with potential for optimization.
Average Monthly Airbnb Earnings Trend in Missoula
Missoula Airbnb Occupancy Rate Trends (2026)
Maximize your bookings by understanding the Missoula STR occupancy trends. Seasonal demand shifts significantly influence how often properties are booked. Typically, Julysees the highest demand (peak season occupancy), while January experiences the lowest (low season). Effective strategies, like adjusting minimum stays or offering promotions, can boost occupancy during slower periods. Here's how different property tiers perform in Missoula:
- Best-in-class properties (Top 10%) achieve 80%+ occupancy, indicating high desirability and potentially optimized availability.
- Strong performing properties (Top 25%) maintain 68% or higher occupancy, suggesting good market fit and guest satisfaction.
- Typical properties (Median) have an occupancy rate around 49%.
- Entry-level properties (Bottom 25%) average 31% occupancy, potentially facing higher vacancy.
Average Monthly Occupancy Rate Trend in Missoula
Average Daily Rate (ADR) Airbnb Trends in Missoula (2026)
Effective short term rental pricing strategy in Missoula involves understanding monthly ADR fluctuations. The Average Daily Rate (ADR) for Airbnb in Missoula typically peaks in June and dips lowest during February. Leveraging Airbnb dynamic pricing tools or strategies based on this seasonality can significantly boost revenue. Here's a look at the typical nightly rates achieved:
- Best-in-class properties (Top 10%) command rates of $374+ per night, often due to premium features or locations.
- Strong performing properties (Top 25%) achieve nightly rates of $266 or more.
- Typical properties (Median) charge around $176 per night.
- Entry-level properties (Bottom 25%) earn around $123 per night.
Average Daily Rate (ADR) Trend by Month in Missoula
Get Live Missoula Market Intelligence 👇

Explore Real-time Analytics
Airbnb Seasonality Analysis & Trends in Missoula (2026)
Peak Season (July, August, June)
- Revenue averages $4,858 per month
- Occupancy rates average 63.9%
- Daily rates average $234
Shoulder Season
- Revenue averages $3,154 per month
- Occupancy maintains around 47.7%
- Daily rates hold near $214
Low Season (January, February, March)
- Revenue drops to average $1,911 per month
- Occupancy decreases to average 37.0%
- Daily rates adjust to average $190
Seasonality Insights for Missoula
- The Airbnb seasonality in Missoula shows highly seasonal trends requiring careful strategy. While the sections above show seasonal averages, it's also insightful to look at the extremes:
- During the high season, the absolute peak month showcases Missoula's highest earning potential, with monthly revenues capable of climbing to $5,174, occupancy reaching a high of 66.7%, and ADRs peaking at $237.
- Conversely, the slowest single month of the year, typically falling within the low season, marks the market's lowest point. In this month, revenue might dip to $1,763, occupancy could drop to 30.1%, and ADRs may adjust down to $184.
- Understanding both the seasonal averages and these monthly peaks and troughs in revenue, occupancy, and ADR is crucial for maximizing your Airbnb profit potential in Missoula.
Seasonal Strategies for Maximizing Profit
- Peak Season: Maximize revenue through premium pricing and potentially longer minimum stays. Ensure high availability.
- Low Season: Offer competitive pricing, special promotions (e.g., extended stay discounts), and flexible cancellation policies. Target off-season travelers like remote workers or budget-conscious guests.
- Shoulder Seasons: Implement dynamic pricing that balances peak and low rates. Target weekend travelers or specific events. Offer slightly more flexible terms than peak season.
- Regularly analyze your own performance against these Missoula seasonality benchmarks and adjust your pricing and availability strategy accordingly.
Best Areas for Airbnb Investment in Missoula (2026)
Exploring the top neighborhoods for short-term rentals in Missoula? This section highlights key areas, outlining why they are attractive for hosts and guests, along with notable local attractions. Consider these locations based on your target guest profile and investment strategy.
| Neighborhood / Area | Why Host Here? (Target Guests & Appeal) | Key Attractions & Landmarks |
|---|---|---|
| Downtown Missoula | The vibrant heart of the city with a mix of local shops, restaurants, and cultural spots. Popular for travelers looking for convenience and a lively atmosphere. | Missoula Art Museum, Caras Park, Montana Natural History Center, Historic Wilma Theatre, Brewery District |
| University District | Home to the University of Montana, this area attracts students and families. Great for long-term stays and proximity to campus events. | University of Montana, Missoula College, Fort Missoula, Clark Fork River, Hellgate Canyon |
| East Missoula | A quieter residential area that offers a more suburban feel while still being close to the city. Ideal for families and those seeking tranquility. | Rattlesnake National Recreation Area, Burlington Northern Railroad Historic Trail, East Missoula Community Park |
| South Hills | This area features beautiful views, hiking trails, and is popular with outdoor enthusiasts and families. | Lolo National Forest, Kim Williams Trail, Mount Jumbo, South Hills Golf |
| North Missoula | An up-and-coming area with new developments and a growing number of attractions. Appeals to younger travelers and those on a budget. | Northside Park, Blackfoot River, Keenan's Neighborhood Park |
| Mullan Road | Known for its proximity to recreational opportunities, including hiking and fishing spots. Attractive for those looking to enjoy nature. | Lolo Creek, Glacial Lake Missoula, Mullan Road historical sites |
| Westside | A diverse neighborhood with unique local businesses and more affordable lodging options, perfect for budget travelers looking for local flavor. | Missoula Valley, Community Gardens, Local Breweries, Parks and Recreation areas |
| Fairview | A residential neighborhood that offers a quieter atmosphere while providing easy access to the downtown and the surrounding nature. | Van Buren Park, Missoula Country Club, fairview trails |
Understanding Airbnb License Requirements & STR Laws in Missoula (2026)
Yes, Missoula, Montana, United States enforces high STR regulations. Obtaining a license and ensuring compliance is almost certainly required according to current 2026 STR laws. Always verify the latest short term rental regulations and Airbnb license requirements directly with local government authorities for Missoula to ensure full compliance before hosting.
(Source: AirROI data, 2026, based on 77% licensed listings)
Top Performing Airbnb Properties in Missoula (2026)
Benchmark your potential! Explore examples of top-performing Airbnb properties in Missoulabased on Trailing Twelve Month (TTM) revenue. Analyze their characteristics, revenue, occupancy rate, and ADR to understand what drives success in this market.
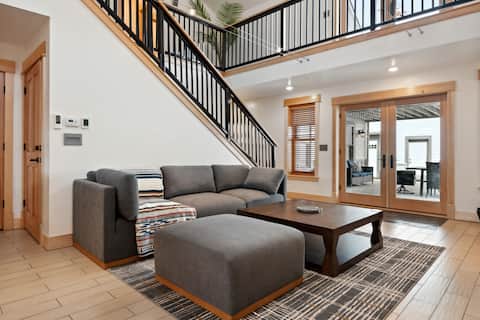
Campus Cove in U-District Indoor POOL
Entire Place • 4 bedrooms
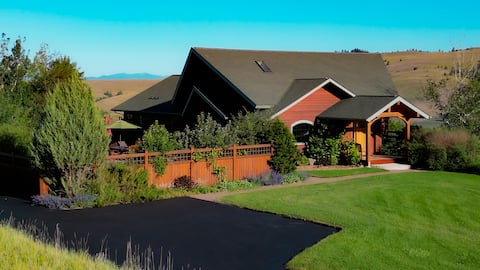
Glacier Getaway-True Vacation Home-Amazing Vistas
Entire Place • 4 bedrooms
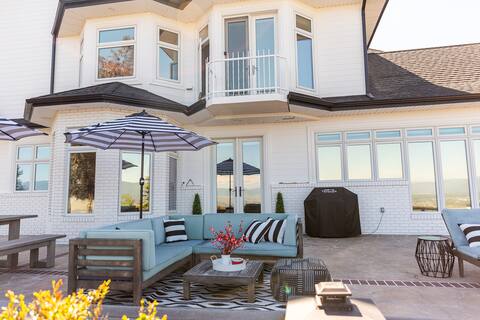
Views for Days! Welcome to the Missoula Lookout 🏔
Entire Place • 5 bedrooms

Fairway Family Retreat
Entire Place • 4 bedrooms
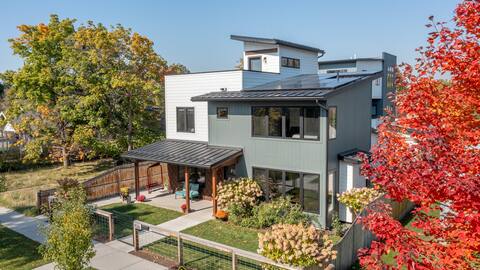
Hydrangea House - Missoula Parade of Homes Winner
Entire Place • 5 bedrooms
Modern Farmhouse - Missoula Parade of Homes Winner
Entire Place • 3 bedrooms
Note: Performance varies based on location, size, amenities, seasonality, and management quality. Data reflects the past 12 months.
Top Performing Airbnb Hosts in Missoula (2026)
Learn from the best! This table showcases top-performing Airbnb hosts in Missoula based on the number of properties managed and estimated total revenue over the past year. Analyze their scale and performance metrics.
| Host Name | Properties | Grossing Revenue | Stay Reviews | Avg Rating |
|---|---|---|---|---|
| Greg | 32 | $1,273,513 | 2605 | 4.96/5.0 |
| Jennifer | 14 | $478,967 | 1593 | 4.96/5.0 |
| Courtney | 6 | $386,248 | 1099 | 4.93/5.0 |
| Garden City Stays | 8 | $367,892 | 2555 | 4.92/5.0 |
| Scott And Rachel | 4 | $336,851 | 581 | 4.99/5.0 |
| Plum Property Management | 9 | $309,497 | 240 | 4.82/5.0 |
| Erin | 8 | $299,349 | 721 | 4.88/5.0 |
| Brendan & Kristin | 6 | $240,963 | 779 | 4.96/5.0 |
| Laura | 6 | $211,207 | 1294 | 4.94/5.0 |
| Angela | 1 | $208,904 | 35 | 5.00/5.0 |
Analyzing the strategies of top hosts, such as their property selection, pricing, and guest communication, can offer valuable lessons for optimizing your own Airbnb operations in Missoula.
Dive Deeper: Advanced Missoula STR Market Data (2026)
Ready to unlock more insights? AirROI provides access to advanced metrics and comprehensive Airbnb data for Missoula. Explore detailed analytics beyond this report to refine your investment strategy, optimize pricing, and maximize your vacation rental profits.
Explore Advanced MetricsMissoula Short-Term Rental Market Composition (2026): Property & Room Types
Room Type Distribution
Property Type Distribution
Market Composition Insights for Missoula
- The Missoula Airbnb market composition is heavily skewed towards Entire Home/Apt listings, which make up 90.7% of the 560 active rentals. This indicates strong guest preference for privacy and space.
- Looking at the property type distribution in Missoula, House properties are the most common (55.9%), reflecting the local real estate landscape.
- Houses represent a significant 55.9% portion, catering likely to families or larger groups.
- The presence of 6.3% Hotel/Boutique listings indicates integration with traditional hospitality.
- Smaller segments like outdoor/unique, unique stays (combined 2.7%) offer potential for unique stay experiences.
Missoula Airbnb Room Capacity Analysis (2026): Bedroom Distribution
Distribution of Listings by Number of Bedrooms
Room Capacity Insights for Missoula
- The dominant room capacity in Missoula is 2 bedrooms listings, making up 28.7% of the market. This suggests a strong demand for properties suitable for couples or solo travelers.
- Together, 2 bedrooms and 1 bedroom properties represent 57.3% of the active Airbnb listings in Missoula, indicating a high concentration in these sizes.
- A significant 29.1% of listings offer 3+ bedrooms, catering to larger groups and families seeking more space in Missoula.
Missoula Vacation Rental Guest Capacity Trends (2026)
Distribution of Listings by Guest Capacity
Guest Capacity Insights for Missoula
- The most common guest capacity trend in Missoula vacation rentals is listings accommodating 4 guests (26.1%). This suggests the primary traveler segment is likely small families or groups.
- Properties designed for 4 guests and 2 guests dominate the Missoula STR market, accounting for 47.9% of listings.
- 32.3% of properties accommodate 6+ guests, serving the market segment for larger families or group travel in Missoula.
- On average, properties in Missoula are equipped to host 4.2 guests.
Missoula Airbnb Booking Patterns (2026): Available vs. Booked Days
Available Days Distribution
Booked Days Distribution
Booking Pattern Insights for Missoula
- The most common availability pattern in Missoula falls within the 181-270 days range, representing 45.7% of listings. This suggests many properties have significant open periods on their calendars.
- Approximately 67.7% of listings show high availability (181+ days open annually), indicating potential for increased bookings or specific owner usage patterns.
- For booked days, the 91-180 days range is most frequent in Missoula (45.7%), reflecting common guest stay durations or potential owner blocking patterns.
- A notable 33.6% of properties secure long booking periods (181+ days booked per year), highlighting successful long-term rental strategies or significant owner usage.
Missoula Airbnb Minimum Stay Requirements Analysis
Distribution of Listings by Minimum Night Requirement
1 Night
168 listings
30.1% of total
2 Nights
112 listings
20% of total
3 Nights
18 listings
3.2% of total
4-6 Nights
16 listings
2.9% of total
7-29 Nights
57 listings
10.2% of total
30+ Nights
188 listings
33.6% of total
Key Insights
- The most prevalent minimum stay requirement in Missoula is 30+ Nights, adopted by 33.6% of listings. This highlights the market's preference for longer commitments.
- A significant segment (33.6%) caters to monthly stays (30+ nights) in Missoula, pointing to opportunities in the extended-stay market.
Recommendations
- Align with the market by considering a 30+ Nights minimum stay, as 33.6% of Missoula hosts use this setting.
- Explore offering discounts for stays of 30+ nights to attract the 33.6% of the market seeking extended stays.
- Adjust minimum nights based on seasonality – potentially shorter during low season and longer during peak demand periods in Missoula.
Missoula Airbnb Cancellation Policy Trends Analysis (2026)
Super Strict 30 Days
7 listings
1.3% of total
Limited
5 listings
0.9% of total
Flexible
164 listings
29.3% of total
Moderate
173 listings
30.9% of total
Firm
171 listings
30.5% of total
Strict
40 listings
7.1% of total
Cancellation Policy Insights for Missoula
- The prevailing Airbnb cancellation policy trend in Missoula is Moderate, used by 30.9% of listings.
- There's a relatively balanced mix between guest-friendly (60.2%) and stricter (37.6%) policies, offering choices for different guest needs.
- Strict cancellation policies are quite rare (7.1%), potentially making listings with this policy less competitive unless justified by high demand or property type.
Recommendations for Hosts
- Consider adopting a Moderate policy to align with the 30.9% market standard in Missoula.
- Using a Strict policy might deter some guests, as only 7.1% of listings use it. Evaluate if potential revenue protection outweighs possible lower booking rates.
- Regularly review your cancellation policy against competitors and market demand shifts in Missoula.
Missoula STR Booking Lead Time Analysis (2026)
Average Booking Lead Time by Month
Booking Lead Time Insights for Missoula
- The overall average booking lead time for vacation rentals in Missoula is 55 days.
- Guests book furthest in advance for stays during July (average 83 days), likely coinciding with peak travel demand or local events.
- The shortest booking windows occur for stays in February (average 24 days), indicating more last-minute travel plans during this time.
- Seasonally, Summer (74 days avg.) sees the longest lead times, while Winter (32 days avg.) has the shortest, reflecting typical travel planning cycles.
Recommendations for Hosts
- Use the overall average lead time (55 days) as a baseline for your pricing and availability strategy in Missoula.
- For July stays, consider implementing length-of-stay discounts or slightly higher rates for bookings made less than 83 days out to capitalize on advance planning.
- Target marketing efforts for the Summer season well in advance (at least 74 days) to capture early planners.
- Monitor your own booking lead times against these Missoula averages to identify opportunities for dynamic pricing adjustments.
Popular & Essential Airbnb Amenities in Missoula (2026)
Amenity Prevalence
Amenity Insights for Missoula
- Essential amenities in Missoula that guests expect include: Wifi, Smoke alarm, Heating. Lacking these (any) could significantly impact bookings.
- Popular amenities like Hot water, Coffee maker, Dishes and silverware are common but not universal. Offering these can provide a competitive edge.
Recommendations for Hosts
- Ensure your listing includes all essential amenities for Missoula: Wifi, Smoke alarm, Heating.
- Prioritize adding missing essentials: Wifi, Smoke alarm, Heating.
- Consider adding popular differentiators like Hot water or Coffee maker to increase appeal.
- Highlight unique or less common amenities you offer (e.g., hot tub, dedicated workspace, EV charger) in your listing description and photos.
- Regularly check competitor amenities in Missoula to stay competitive.
Missoula Airbnb Guest Demographics & Profile Analysis (2026)
Guest Profile Summary for Missoula
- The typical guest profile for Airbnb in Missoula consists of primarily domestic travelers (97%), often arriving from nearby Missoula, typically belonging to the Post-2000s (Gen Z/Alpha) group (50%), primarily speaking English or Spanish.
- Domestic travelers account for 96.7% of guests.
- Key international markets include United States (96.7%) and Canada (1.3%).
- Top languages spoken are English (76.4%) followed by Spanish (10.6%).
- A significant demographic segment is the Post-2000s (Gen Z/Alpha) group, representing 50% of guests.
Recommendations for Hosts
- Target domestic marketing efforts towards travelers from Missoula and Bozeman.
- Tailor amenities and listing descriptions to appeal to the dominant Post-2000s (Gen Z/Alpha) demographic (e.g., highlight fast WiFi, smart home features, local guides).
- Highlight unique local experiences or amenities relevant to the primary guest profile.
- Consider seasonal promotions aligned with peak travel times for key origin markets.
Nearby Short-Term Rental Market Comparison
How does the Missoula Airbnb market stack up against its neighbors? Compare key performance metrics like average monthly revenue, ADR, and occupancy rates in surrounding areas to understand the broader regional STR landscape.
| Market | Active Properties | Monthly Revenue | Daily Rate | Avg. Occupancy |
|---|---|---|---|---|
| Missoula County | 14 | $3,521 | $446.45 | 37% |
| Dayton | 14 | $3,049 | $418.01 | 44% |
| Polson | 140 | $2,880 | $362.31 | 44% |
| Rollins | 16 | $2,785 | $680.57 | 45% |
| Polaris | 10 | $2,681 | $282.37 | 39% |
| Trout Creek | 15 | $2,662 | $294.19 | 42% |
| Philipsburg | 58 | $2,566 | $242.77 | 41% |
| Anaconda | 102 | $2,565 | $278.27 | 39% |
| Hamilton | 130 | $2,480 | $265.73 | 39% |
| Saint Regis | 11 | $2,385 | $300.01 | 36% |