Marion Airbnb Market Analysis 2025: Short Term Rental Data & Vacation Rental Statistics in Montana, United States
Is Airbnb profitable in Marion in 2025? Explore comprehensive Airbnb analytics for Marion, Montana, United States to uncover income potential. This 2025 STR market report for Marion, based on AirROI data from September 2024 to August 2025, reveals key trends in the niche market of 18 active listings.
Whether you're considering an Airbnb investment in Marion, optimizing your existing vacation rental, or exploring rental arbitrage opportunities, understanding the Marion Airbnb data is crucial. Leveraging the low regulation environment is key to maximizing your short term rental income potential. Let's dive into the specifics.
Key Marion Airbnb Performance Metrics Overview
Monthly Airbnb Revenue Variations & Income Potential in Marion (2025)
Understanding the monthly revenue variations for Airbnb listings in Marion is key to maximizing your short term rental income potential. Seasonality significantly impacts earnings. Our analysis, based on data from the past 12 months, shows that the peak revenue month for STRs in Marion is typically November, while March often presents the lowest earnings, highlighting opportunities for strategic pricing adjustments during shoulder and low seasons. Explore the typical Airbnb income in Marion across different performance tiers:
- Best-in-class properties (Top 10%) achieve $8,164+ monthly, often utilizing dynamic pricing and superior guest experiences.
- Strong performing properties (Top 25%) earn $5,921 or more, indicating effective management and desirable locations/amenities.
- Typical properties (Median) generate around $2,299 per month, representing the average market performance.
- Entry-level properties (Bottom 25%) see earnings around $719, often with potential for optimization.
Average Monthly Airbnb Earnings Trend in Marion
Marion Airbnb Occupancy Rate Trends (2025)
Maximize your bookings by understanding the Marion STR occupancy trends. Seasonal demand shifts significantly influence how often properties are booked. Typically, Novembersees the highest demand (peak season occupancy), while March experiences the lowest (low season). Effective strategies, like adjusting minimum stays or offering promotions, can boost occupancy during slower periods. Here's how different property tiers perform in Marion:
- Best-in-class properties (Top 10%) achieve 60%+ occupancy, indicating high desirability and potentially optimized availability.
- Strong performing properties (Top 25%) maintain 48% or higher occupancy, suggesting good market fit and guest satisfaction.
- Typical properties (Median) have an occupancy rate around 19%.
- Entry-level properties (Bottom 25%) average 11% occupancy, potentially facing higher vacancy.
Average Monthly Occupancy Rate Trend in Marion
Average Daily Rate (ADR) Airbnb Trends in Marion (2025)
Effective short term rental pricing strategy in Marion involves understanding monthly ADR fluctuations. The Average Daily Rate (ADR) for Airbnb in Marion typically peaks in August and dips lowest during February. Leveraging Airbnb dynamic pricing tools or strategies based on this seasonality can significantly boost revenue. Here's a look at the typical nightly rates achieved:
- Best-in-class properties (Top 10%) command rates of $910+ per night, often due to premium features or locations.
- Strong performing properties (Top 25%) achieve nightly rates of $475 or more.
- Typical properties (Median) charge around $187 per night.
- Entry-level properties (Bottom 25%) earn around $142 per night.
Average Daily Rate (ADR) Trend by Month in Marion
Get Live Marion Market Intelligence 👇

Explore Real-time Analytics
Airbnb Seasonality Analysis & Trends in Marion (2025)
Peak Season (November, December, January)
- Revenue averages $7,321 per month
- Occupancy rates average 38.0%
- Daily rates average $388
Shoulder Season
- Revenue averages $3,095 per month
- Occupancy maintains around 31.7%
- Daily rates hold near $438
Low Season (February, March, May)
- Revenue drops to average $1,313 per month
- Occupancy decreases to average 17.3%
- Daily rates adjust to average $403
Seasonality Insights for Marion
- The Airbnb seasonality in Marion shows highly seasonal trends requiring careful strategy. While the sections above show seasonal averages, it's also insightful to look at the extremes:
- During the high season, the absolute peak month showcases Marion's highest earning potential, with monthly revenues capable of climbing to $9,350, occupancy reaching a high of 48.4%, and ADRs peaking at $468.
- Conversely, the slowest single month of the year, typically falling within the low season, marks the market's lowest point. In this month, revenue might dip to $474, occupancy could drop to 8.6%, and ADRs may adjust down to $380.
- Understanding both the seasonal averages and these monthly peaks and troughs in revenue, occupancy, and ADR is crucial for maximizing your Airbnb profit potential in Marion.
Seasonal Strategies for Maximizing Profit
- Peak Season: Maximize revenue through premium pricing and potentially longer minimum stays. Ensure high availability.
- Low Season: Offer competitive pricing, special promotions (e.g., extended stay discounts), and flexible cancellation policies. Target off-season travelers like remote workers or budget-conscious guests.
- Shoulder Seasons: Implement dynamic pricing that balances peak and low rates. Target weekend travelers or specific events. Offer slightly more flexible terms than peak season.
- Regularly analyze your own performance against these Marion seasonality benchmarks and adjust your pricing and availability strategy accordingly.
Best Areas for Airbnb Investment in Marion (2025)
Exploring the top neighborhoods for short-term rentals in Marion? This section highlights key areas, outlining why they are attractive for hosts and guests, along with notable local attractions. Consider these locations based on your target guest profile and investment strategy.
| Neighborhood / Area | Why Host Here? (Target Guests & Appeal) | Key Attractions & Landmarks |
|---|---|---|
| Flathead Lake | The largest natural freshwater lake in the western United States. Known for its stunning scenery and outdoor activities, making it a top choice for tourists. | Flathead Lake State Park, Wild Horse Island, Swan Lake, Bigfork Village, Water sports, Fishing Charters |
| Glacier National Park | An iconic national park known for its breathtaking landscapes, hiking trails, and wildlife. A major draw for nature lovers and adventure seekers. | Going-to-the-Sun Road, Many Glacier, Lake McDonald, Logan Pass, Trail of the Cedars, Highline Trail |
| City of Polson | A charming community located at the southern tip of Flathead Lake, offering easy access to water activities and local amenities. Ideal for families and vacationers. | Polson Aquatic Center, Flathead Cherry Company, The People’s Center, Polson Bay Golf Course, Riverfront Park, Kerr Dam |
| Lakeside | A picturesque town on the western shore of Flathead Lake, popular for its serene environment and recreational options. Great for those seeking a peaceful getaway. | Lakeside Park, Boating and fishing spots, Biking trails, Lakeside Historical Society, Local dining options |
| St. Ignatius | A small, friendly town with rich Native American culture and history. Offers a unique cultural experience and access to outdoor recreation. | Bear Creek Rd, Mission Mountains, St. Ignatius Mission, Local artisan shops, Hiking trails |
| Yellow Bay | Known for its vineyard and wine production, Yellow Bay offers a vineyard experience along with outdoor activities on Flathead Lake. | Yellow Bay State Park, Local wineries, Boat rentals, Kayaking, Fishing spots |
| Somers | A small community on the shores of Flathead Lake, providing a relaxing atmosphere and beautiful views, making it attractive for tourists. | Somers Beach State Park, Walking trails, Lakeside dining, Local shops, Fishing and boating |
| Bigfork | A vibrant village nestled on Flathead Lake, filled with art galleries, theaters, and restaurants. A lively destination for weekend getaways. | Bigfork Village, Bigfork Summer Playhouse, Flathead Lake Brewing Company, Golf courses, Local art galleries |
Understanding Airbnb License Requirements & STR Laws in Marion (2025)
While Marion, Montana, United States currently shows low STR regulations, specific Airbnb license requirements might still exist or change. Always verify the latest short term rental regulations and Airbnb license requirements directly with local government authorities for Marion to ensure full compliance before hosting.
(Source: AirROI data, 2025, finding no licensed listings among those analyzed)
Top Performing Airbnb Properties in Marion (2025)
Benchmark your potential! Explore examples of top-performing Airbnb properties in Marionbased on Trailing Twelve Month (TTM) revenue. Analyze their characteristics, revenue, occupancy rate, and ADR to understand what drives success in this market.

JMJ Paradise Retreat LLC
Entire Place • 5 bedrooms

A little piece of heaven
Entire Place • 2 bedrooms
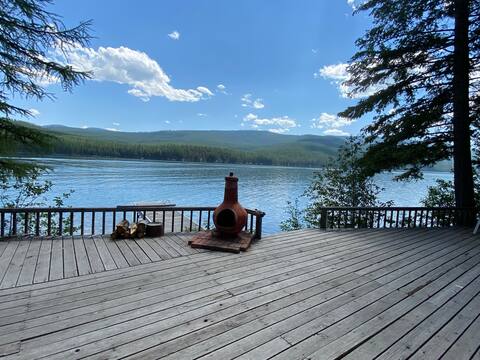
Montana Lake Retreat. Restore, relax, and enjoy.
Entire Place • 2 bedrooms

Beautiful Lakefront Home
Entire Place • 4 bedrooms
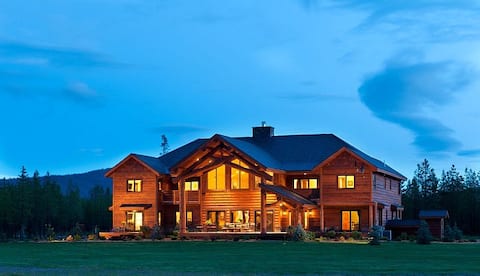
Luxurious lodge on a private airstrip
Entire Place • 6 bedrooms
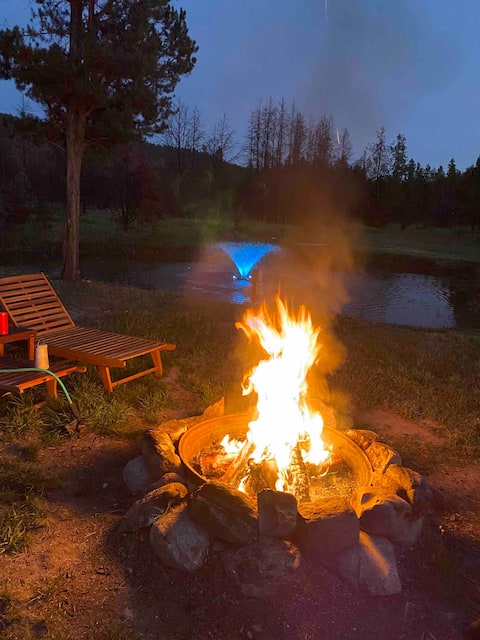
Wildlife river cabin
Entire Place • 2 bedrooms
Note: Performance varies based on location, size, amenities, seasonality, and management quality. Data reflects the past 12 months.
Top Performing Airbnb Hosts in Marion (2025)
Learn from the best! This table showcases top-performing Airbnb hosts in Marion based on the number of properties managed and estimated total revenue over the past year. Analyze their scale and performance metrics.
| Host Name | Properties | Grossing Revenue | Stay Reviews | Avg Rating |
|---|---|---|---|---|
| Joseph And Minerva | 1 | $106,353 | 34 | 5.00/5.0 |
| Sariah May | 1 | $49,006 | 37 | 4.97/5.0 |
| Erin | 1 | $32,855 | 24 | 4.96/5.0 |
| Chelsea | 1 | $23,986 | 3 | 5.00/5.0 |
| Tina | 2 | $20,045 | 73 | 4.99/5.0 |
| Tom | 1 | $19,151 | 3 | 5.00/5.0 |
| Alexis | 1 | $17,791 | 12 | 4.92/5.0 |
| Jen | 1 | $15,213 | 60 | 4.95/5.0 |
| Brittany | 1 | $15,178 | 12 | 4.50/5.0 |
| Edward Alan | 1 | $7,685 | 12 | 5.00/5.0 |
Analyzing the strategies of top hosts, such as their property selection, pricing, and guest communication, can offer valuable lessons for optimizing your own Airbnb operations in Marion.
Dive Deeper: Advanced Marion STR Market Data (2025)
Ready to unlock more insights? AirROI provides access to advanced metrics and comprehensive Airbnb data for Marion. Explore detailed analytics beyond this report to refine your investment strategy, optimize pricing, and maximize your vacation rental profits.
Explore Advanced MetricsMarion Short-Term Rental Market Composition (2025): Property & Room Types
Room Type Distribution
Property Type Distribution
Market Composition Insights for Marion
- The Marion Airbnb market composition is heavily skewed towards Entire Home/Apt listings, which make up 94.4% of the 18 active rentals. This indicates strong guest preference for privacy and space.
- Looking at the property type distribution in Marion, House properties are the most common (50%), reflecting the local real estate landscape.
- Houses represent a significant 50% portion, catering likely to families or larger groups.
- The presence of 5.6% Hotel/Boutique listings indicates integration with traditional hospitality.
Marion Airbnb Room Capacity Analysis (2025): Bedroom Distribution
Distribution of Listings by Number of Bedrooms
Room Capacity Insights for Marion
- The dominant room capacity in Marion is 2 bedrooms listings, making up 27.8% of the market. This suggests a strong demand for properties suitable for couples or solo travelers.
- Together, 2 bedrooms and 1 bedroom properties represent 55.6% of the active Airbnb listings in Marion, indicating a high concentration in these sizes.
- A significant 27.8% of listings offer 3+ bedrooms, catering to larger groups and families seeking more space in Marion.
Marion Vacation Rental Guest Capacity Trends (2025)
Distribution of Listings by Guest Capacity
Guest Capacity Insights for Marion
- The most common guest capacity trend in Marion vacation rentals is listings accommodating 4 guests (22.2%). This suggests the primary traveler segment is likely small families or groups.
- Properties designed for 4 guests and 6 guests dominate the Marion STR market, accounting for 44.4% of listings.
- 44.4% of properties accommodate 6+ guests, serving the market segment for larger families or group travel in Marion.
- On average, properties in Marion are equipped to host 4.9 guests.
Marion Airbnb Booking Patterns (2025): Available vs. Booked Days
Available Days Distribution
Booked Days Distribution
Booking Pattern Insights for Marion
- The most common availability pattern in Marion falls within the 271-366 days range, representing 77.8% of listings. This suggests many properties have significant open periods on their calendars.
- Approximately 100.0% of listings show high availability (181+ days open annually), indicating potential for increased bookings or specific owner usage patterns.
- For booked days, the 31-90 days range is most frequent in Marion (38.9%), reflecting common guest stay durations or potential owner blocking patterns.
Marion Airbnb Minimum Stay Requirements Analysis
Distribution of Listings by Minimum Night Requirement
1 Night
7 listings
38.9% of total
2 Nights
4 listings
22.2% of total
3 Nights
3 listings
16.7% of total
4-6 Nights
2 listings
11.1% of total
30+ Nights
2 listings
11.1% of total
Key Insights
- The most prevalent minimum stay requirement in Marion is 1 Night, adopted by 38.9% of listings. This highlights the market's preference for shorter, flexible bookings.
- A strong majority (61.1%) of the Marion Airbnb data shows acceptance of very short stays (1-2 nights), indicating a dynamic, high-turnover market.
- A significant segment (11.1%) caters to monthly stays (30+ nights) in Marion, pointing to opportunities in the extended-stay market.
Recommendations
- Align with the market by considering a 1 Night minimum stay, as 38.9% of Marion hosts use this setting.
- Explore offering discounts for stays of 30+ nights to attract the 11.1% of the market seeking extended stays.
- Adjust minimum nights based on seasonality – potentially shorter during low season and longer during peak demand periods in Marion.
Marion Airbnb Cancellation Policy Trends Analysis (2025)
Flexible
7 listings
38.9% of total
Moderate
2 listings
11.1% of total
Firm
4 listings
22.2% of total
Strict
5 listings
27.8% of total
Cancellation Policy Insights for Marion
- The prevailing Airbnb cancellation policy trend in Marion is Flexible, used by 38.9% of listings.
- There's a relatively balanced mix between guest-friendly (50.0%) and stricter (50.0%) policies, offering choices for different guest needs.
Recommendations for Hosts
- Consider adopting a Flexible policy to align with the 38.9% market standard in Marion.
- Regularly review your cancellation policy against competitors and market demand shifts in Marion.
Marion STR Booking Lead Time Analysis (2025)
Average Booking Lead Time by Month
Booking Lead Time Insights for Marion
- The overall average booking lead time for vacation rentals in Marion is 43 days.
- Guests book furthest in advance for stays during October (average 91 days), likely coinciding with peak travel demand or local events.
- The shortest booking windows occur for stays in November (average 1 days), indicating more last-minute travel plans during this time.
- Seasonally, Summer (56 days avg.) sees the longest lead times, while Winter (22 days avg.) has the shortest, reflecting typical travel planning cycles.
Recommendations for Hosts
- Use the overall average lead time (43 days) as a baseline for your pricing and availability strategy in Marion.
- For October stays, consider implementing length-of-stay discounts or slightly higher rates for bookings made less than 91 days out to capitalize on advance planning.
- During November, focus on last-minute booking availability and promotions, as guests book with very short notice (1 days avg.).
- Target marketing efforts for the Summer season well in advance (at least 56 days) to capture early planners.
- Monitor your own booking lead times against these Marion averages to identify opportunities for dynamic pricing adjustments.
Popular & Essential Airbnb Amenities in Marion (2025)
Amenity Prevalence
Amenity Insights for Marion
- Essential amenities in Marion that guests expect include: Free parking on premises. Lacking these (this) could significantly impact bookings.
- Popular amenities like Outdoor furniture, Wifi, Outdoor dining area are common but not universal. Offering these can provide a competitive edge.
- Warning: Wifi is not universally provided but is considered essential globally. Ensure reliable Wifi is offered.
Recommendations for Hosts
- Ensure your listing includes all essential amenities for Marion: Free parking on premises.
- Consider adding popular differentiators like Outdoor furniture or Wifi to increase appeal.
- Highlight unique or less common amenities you offer (e.g., hot tub, dedicated workspace, EV charger) in your listing description and photos.
- Regularly check competitor amenities in Marion to stay competitive.
Marion Airbnb Guest Demographics & Profile Analysis (2025)
Guest Profile Summary for Marion
- The typical guest profile for Airbnb in Marion consists of primarily domestic travelers (92%), often arriving from nearby Fort Myers, typically belonging to the Post-2000s (Gen Z/Alpha) group (50%), primarily speaking English or Spanish.
- Domestic travelers account for 92.3% of guests.
- Key international markets include United States (92.3%) and Spain (1.9%).
- Top languages spoken are English (67.9%) followed by Spanish (10.7%).
- A significant demographic segment is the Post-2000s (Gen Z/Alpha) group, representing 50% of guests.
Recommendations for Hosts
- Target domestic marketing efforts towards travelers from Fort Myers and Kalispell.
- Tailor amenities and listing descriptions to appeal to the dominant Post-2000s (Gen Z/Alpha) demographic (e.g., highlight fast WiFi, smart home features, local guides).
- Highlight unique local experiences or amenities relevant to the primary guest profile.
- Consider seasonal promotions aligned with peak travel times for key origin markets.
Nearby Short-Term Rental Market Comparison
How does the Marion Airbnb market stack up against its neighbors? Compare key performance metrics like average monthly revenue, ADR, and occupancy rates in surrounding areas to understand the broader regional STR landscape.
| Market | Active Properties | Monthly Revenue | Daily Rate | Avg. Occupancy |
|---|---|---|---|---|
| West Glacier | 79 | $4,441 | $408.98 | 56% |
| Whitefish | 1,004 | $3,693 | $425.93 | 39% |
| Babb | 58 | $3,280 | $283.31 | 59% |
| Lakeside | 129 | $3,276 | $409.36 | 40% |
| Area A (Upper Flathead/Elk Valley) | 240 | $3,116 | $280.49 | 44% |
| Trout Creek | 13 | $3,100 | $249.07 | 43% |
| Somers | 75 | $3,000 | $357.30 | 43% |
| Dayton | 16 | $2,958 | $411.87 | 38% |
| Martin City | 48 | $2,952 | $244.50 | 55% |
| Superior | 26 | $2,952 | $222.22 | 46% |