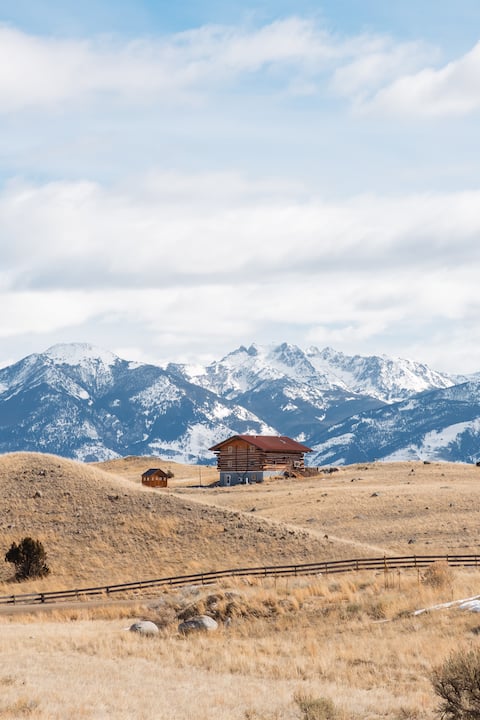
Emigrant Airbnb Market Analysis 2026: Short Term Rental Data & Vacation Rental Statistics in Montana, United States
Is Airbnb profitable in Emigrant in 2026? Explore comprehensive Airbnb analytics for Emigrant, Montana, United States to uncover income potential. This 2026 STR market report for Emigrant, based on AirROI data from February 2025 to January 2026, reveals key trends in the niche market of 113 active listings.
Whether you're considering an Airbnb investment in Emigrant, optimizing your existing vacation rental, or exploring rental arbitrage opportunities, understanding the Emigrant Airbnb data is crucial. Leveraging the low regulation environment is key to maximizing your short term rental income potential. Let's dive into the specifics.
Key Emigrant Airbnb Performance Metrics Overview
Monthly Airbnb Revenue Variations & Income Potential in Emigrant (2026)
Understanding the monthly revenue variations for Airbnb listings in Emigrant is key to maximizing your short term rental income potential. Seasonality significantly impacts earnings. Our analysis, based on data from the past 12 months, shows that the peak revenue month for STRs in Emigrant is typically July, while February often presents the lowest earnings, highlighting opportunities for strategic pricing adjustments during shoulder and low seasons. Explore the typical Airbnb income in Emigrant across different performance tiers:
- Best-in-class properties (Top 10%) achieve $12,299+ monthly, often utilizing dynamic pricing and superior guest experiences.
- Strong performing properties (Top 25%) earn $7,734 or more, indicating effective management and desirable locations/amenities.
- Typical properties (Median) generate around $4,347 per month, representing the average market performance.
- Entry-level properties (Bottom 25%) see earnings around $2,332, often with potential for optimization.
Average Monthly Airbnb Earnings Trend in Emigrant
Emigrant Airbnb Occupancy Rate Trends (2026)
Maximize your bookings by understanding the Emigrant STR occupancy trends. Seasonal demand shifts significantly influence how often properties are booked. Typically, Julysees the highest demand (peak season occupancy), while February experiences the lowest (low season). Effective strategies, like adjusting minimum stays or offering promotions, can boost occupancy during slower periods. Here's how different property tiers perform in Emigrant:
- Best-in-class properties (Top 10%) achieve 81%+ occupancy, indicating high desirability and potentially optimized availability.
- Strong performing properties (Top 25%) maintain 67% or higher occupancy, suggesting good market fit and guest satisfaction.
- Typical properties (Median) have an occupancy rate around 49%.
- Entry-level properties (Bottom 25%) average 32% occupancy, potentially facing higher vacancy.
Average Monthly Occupancy Rate Trend in Emigrant
Average Daily Rate (ADR) Airbnb Trends in Emigrant (2026)
Effective short term rental pricing strategy in Emigrant involves understanding monthly ADR fluctuations. The Average Daily Rate (ADR) for Airbnb in Emigrant typically peaks in July and dips lowest during February. Leveraging Airbnb dynamic pricing tools or strategies based on this seasonality can significantly boost revenue. Here's a look at the typical nightly rates achieved:
- Best-in-class properties (Top 10%) command rates of $712+ per night, often due to premium features or locations.
- Strong performing properties (Top 25%) achieve nightly rates of $516 or more.
- Typical properties (Median) charge around $317 per night.
- Entry-level properties (Bottom 25%) earn around $182 per night.
Average Daily Rate (ADR) Trend by Month in Emigrant
Get Live Emigrant Market Intelligence 👇

Explore Real-time Analytics
Airbnb Seasonality Analysis & Trends in Emigrant (2026)
Peak Season (July, June, August)
- Revenue averages $9,232 per month
- Occupancy rates average 69.9%
- Daily rates average $417
Shoulder Season
- Revenue averages $5,296 per month
- Occupancy maintains around 46.4%
- Daily rates hold near $381
Low Season (January, February, March)
- Revenue drops to average $3,123 per month
- Occupancy decreases to average 33.5%
- Daily rates adjust to average $348
Seasonality Insights for Emigrant
- The Airbnb seasonality in Emigrant shows highly seasonal trends requiring careful strategy. While the sections above show seasonal averages, it's also insightful to look at the extremes:
- During the high season, the absolute peak month showcases Emigrant's highest earning potential, with monthly revenues capable of climbing to $10,261, occupancy reaching a high of 75.1%, and ADRs peaking at $423.
- Conversely, the slowest single month of the year, typically falling within the low season, marks the market's lowest point. In this month, revenue might dip to $2,522, occupancy could drop to 30.8%, and ADRs may adjust down to $337.
- Understanding both the seasonal averages and these monthly peaks and troughs in revenue, occupancy, and ADR is crucial for maximizing your Airbnb profit potential in Emigrant.
Seasonal Strategies for Maximizing Profit
- Peak Season: Maximize revenue through premium pricing and potentially longer minimum stays. Ensure high availability.
- Low Season: Offer competitive pricing, special promotions (e.g., extended stay discounts), and flexible cancellation policies. Target off-season travelers like remote workers or budget-conscious guests.
- Shoulder Seasons: Implement dynamic pricing that balances peak and low rates. Target weekend travelers or specific events. Offer slightly more flexible terms than peak season.
- Regularly analyze your own performance against these Emigrant seasonality benchmarks and adjust your pricing and availability strategy accordingly.
Best Areas for Airbnb Investment in Emigrant (2026)
Exploring the top neighborhoods for short-term rentals in Emigrant? This section highlights key areas, outlining why they are attractive for hosts and guests, along with notable local attractions. Consider these locations based on your target guest profile and investment strategy.
| Neighborhood / Area | Why Host Here? (Target Guests & Appeal) | Key Attractions & Landmarks |
|---|---|---|
| Yellowstone National Park | One of the most famous national parks in the United States, attracting millions of visitors each year. Ideal for nature lovers and outdoor enthusiasts. | Old Faithful, Grand Prismatic Spring, Yellowstone Lake, Mammoth Hot Springs, Lamar Valley |
| Big Sky Resort | A premier ski destination known for its excellent slopes and breathtaking views. Draws winter sports enthusiasts and summer tourists seeking hiking and mountain biking. | Big Sky Ski Area, Lone Mountain, ziplining, golf courses, outdoor concerts |
| Bozeman | A charming college town with a vibrant cultural scene, great dining options, and access to surrounding outdoor activities. Popular for both visitors and locals. | Museum of the Rockies, Bozeman Hot Springs, Downtown Bozeman, Montana State University, Bridger Bowl Ski Area |
| Livingston | A quaint small town with a rich history and a gateway to Yellowstone. Offers a more laid-back atmosphere with arts and culture. | Yellowstone River, Livingston Depot Center, Sacajawea Park, Downtown Livingston, The Stockman Gallery |
| Gallatin Canyon | A scenic canyon that offers stunning views and access to outdoor activities such as hiking and fishing. Great for those seeking a getaway in nature. | Gallatin River, Hiking Trails, Fishing Spots, Scenic Drives, Wildlife Viewing |
| Paradise Valley | Known for its stunning landscapes and close proximity to natural hot springs. Attracts visitors looking for relaxation and adventure. | Chico Hot Springs, Natural Hot Springs, Scenic Views, Outdoor Activities, Wildlife |
| Custer Gallatin National Forest | A vast forest area surrounding Emigrant, perfect for hiking, camping, and enjoying nature. Popular for nature enthusiasts. | Hiking Trails, Camping Areas, Wildlife Viewing, Scenic Drives, Fishing Locations |
| Emigrant itself | A small, charming town with a friendly community. Great for those looking for a quiet retreat while still being near Yellowstone and outdoor activities. | Historic Emigrant, Proximity to Yellowstone, Local Shops, Fishing, Hiking |
Understanding Airbnb License Requirements & STR Laws in Emigrant (2026)
While Emigrant, Montana, United States currently shows low STR regulations, specific Airbnb license requirements might still exist or change. Always verify the latest short term rental regulations and Airbnb license requirements directly with local government authorities for Emigrant to ensure full compliance before hosting.
(Source: AirROI data, 2026, finding no licensed listings among those analyzed)
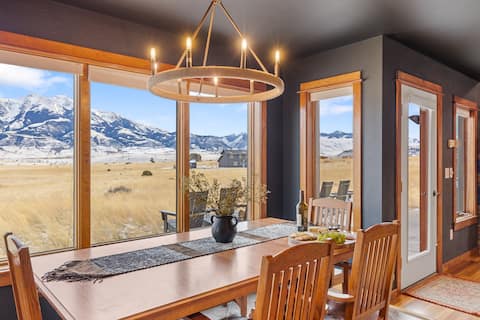
Top Performing Airbnb Properties in Emigrant (2026)
Benchmark your potential! Explore examples of top-performing Airbnb properties in Emigrantbased on Trailing Twelve Month (TTM) revenue. Analyze their characteristics, revenue, occupancy rate, and ADR to understand what drives success in this market.

Featured on Viral YouTube | Hot Tub + Epic Views
Entire Place • 3 bedrooms
Yellowstone Basecamp Lodge - Epic Mountain Views
Entire Place • 4 bedrooms

Cowboy Lake Lodge · close to Chico, private pond
Entire Place • 4 bedrooms
30 Miles to Yellowstone Hot Tub Game Room A/C
Entire Place • 3 bedrooms

Big Sky Views, Huge Hot Tub, 2 Fireplaces, Sauna
Entire Place • 4 bedrooms

Mountain Yurt, Condé Nast Luxe Yellowstone Escape
Entire Place • 1 bedroom
Note: Performance varies based on location, size, amenities, seasonality, and management quality. Data reflects the past 12 months.
Top Performing Airbnb Hosts in Emigrant (2026)
Learn from the best! This table showcases top-performing Airbnb hosts in Emigrant based on the number of properties managed and estimated total revenue over the past year. Analyze their scale and performance metrics.
| Host Name | Properties | Grossing Revenue | Stay Reviews | Avg Rating |
|---|---|---|---|---|
| Brooke | 7 | $796,072 | 257 | 4.98/5.0 |
| Tanya | 10 | $600,809 | 380 | 4.92/5.0 |
| Kameko | 3 | $496,591 | 401 | 4.97/5.0 |
| Nicolette | 16 | $430,402 | 5359 | 4.94/5.0 |
| Mountain Home | 8 | $414,679 | 186 | 4.77/5.0 |
| Evolve | 7 | $274,763 | 308 | 4.81/5.0 |
| Ciara | 2 | $223,976 | 85 | 4.99/5.0 |
| Ting Ting | 1 | $196,226 | 130 | 5.00/5.0 |
| Nicole | 2 | $172,800 | 59 | 4.79/5.0 |
| The Maddox | 2 | $154,974 | 23 | 4.68/5.0 |
Analyzing the strategies of top hosts, such as their property selection, pricing, and guest communication, can offer valuable lessons for optimizing your own Airbnb operations in Emigrant.
Dive Deeper: Advanced Emigrant STR Market Data (2026)
Ready to unlock more insights? AirROI provides access to advanced metrics and comprehensive Airbnb data for Emigrant. Explore detailed analytics beyond this report to refine your investment strategy, optimize pricing, and maximize your vacation rental profits.
Explore Advanced MetricsEmigrant Short-Term Rental Market Composition (2026): Property & Room Types
Room Type Distribution
Property Type Distribution
Market Composition Insights for Emigrant
- The Emigrant Airbnb market composition is heavily skewed towards Entire Home/Apt listings, which make up 85.8% of the 113 active rentals. This indicates strong guest preference for privacy and space.
- Looking at the property type distribution in Emigrant, House properties are the most common (68.1%), reflecting the local real estate landscape.
- Houses represent a significant 68.1% portion, catering likely to families or larger groups.
- Smaller segments like apartment/condo, hotel/boutique, others (combined 6.2%) offer potential for unique stay experiences.
Emigrant Airbnb Room Capacity Analysis (2026): Bedroom Distribution
Distribution of Listings by Number of Bedrooms
Room Capacity Insights for Emigrant
- The dominant room capacity in Emigrant is 3 bedrooms listings, making up 26.5% of the market. This suggests a strong demand for properties suitable for families or small groups.
- Together, 3 bedrooms and 2 bedrooms properties represent 49.5% of the active Airbnb listings in Emigrant, indicating a high concentration in these sizes.
- A significant 46.0% of listings offer 3+ bedrooms, catering to larger groups and families seeking more space in Emigrant.
Emigrant Vacation Rental Guest Capacity Trends (2026)
Distribution of Listings by Guest Capacity
Guest Capacity Insights for Emigrant
- The most common guest capacity trend in Emigrant vacation rentals is listings accommodating 8+ guests (33.6%). This suggests the primary traveler segment is likely larger groups.
- Properties designed for 8+ guests and 6 guests dominate the Emigrant STR market, accounting for 63.7% of listings.
- 66.4% of properties accommodate 6+ guests, serving the market segment for larger families or group travel in Emigrant.
- On average, properties in Emigrant are equipped to host 5.6 guests.
Emigrant Airbnb Booking Patterns (2026): Available vs. Booked Days
Available Days Distribution
Booked Days Distribution
Booking Pattern Insights for Emigrant
- The most common availability pattern in Emigrant falls within the 181-270 days range, representing 49.6% of listings. This suggests many properties have significant open periods on their calendars.
- Approximately 72.6% of listings show high availability (181+ days open annually), indicating potential for increased bookings or specific owner usage patterns.
- For booked days, the 91-180 days range is most frequent in Emigrant (51.3%), reflecting common guest stay durations or potential owner blocking patterns.
- A notable 27.5% of properties secure long booking periods (181+ days booked per year), highlighting successful long-term rental strategies or significant owner usage.
Emigrant Airbnb Minimum Stay Requirements Analysis
Distribution of Listings by Minimum Night Requirement
1 Night
24 listings
21.2% of total
2 Nights
26 listings
23% of total
3 Nights
13 listings
11.5% of total
4-6 Nights
5 listings
4.4% of total
30+ Nights
45 listings
39.8% of total
Key Insights
- The most prevalent minimum stay requirement in Emigrant is 30+ Nights, adopted by 39.8% of listings. This highlights the market's preference for longer commitments.
- A significant segment (39.8%) caters to monthly stays (30+ nights) in Emigrant, pointing to opportunities in the extended-stay market.
Recommendations
- Align with the market by considering a 30+ Nights minimum stay, as 39.8% of Emigrant hosts use this setting.
- If feasible, allowing 1-night stays, especially midweek or during low season, could capture last-minute bookings, as only 21.2% currently do.
- Explore offering discounts for stays of 30+ nights to attract the 39.8% of the market seeking extended stays.
- Adjust minimum nights based on seasonality – potentially shorter during low season and longer during peak demand periods in Emigrant.
Emigrant Airbnb Cancellation Policy Trends Analysis (2026)
Super Strict 60 Days
1 listings
0.9% of total
Super Strict 30 Days
3 listings
2.7% of total
Flexible
9 listings
8% of total
Moderate
17 listings
15% of total
Firm
40 listings
35.4% of total
Strict
43 listings
38.1% of total
Cancellation Policy Insights for Emigrant
- The prevailing Airbnb cancellation policy trend in Emigrant is Strict, used by 38.1% of listings.
- A majority (73.5%) of hosts in Emigrant utilize Firm or Strict policies, indicating a market where hosts prioritize booking security.
Recommendations for Hosts
- Consider adopting a Strict policy to align with the 38.1% market standard in Emigrant.
- With 38.1% using Strict terms, this is a viable option in Emigrant, particularly for high-value properties or during peak demand periods.
- Regularly review your cancellation policy against competitors and market demand shifts in Emigrant.
Emigrant STR Booking Lead Time Analysis (2026)
Average Booking Lead Time by Month
Booking Lead Time Insights for Emigrant
- The overall average booking lead time for vacation rentals in Emigrant is 77 days.
- Guests book furthest in advance for stays during June (average 103 days), likely coinciding with peak travel demand or local events.
- The shortest booking windows occur for stays in February (average 31 days), indicating more last-minute travel plans during this time.
- Seasonally, Summer (101 days avg.) sees the longest lead times, while Winter (38 days avg.) has the shortest, reflecting typical travel planning cycles.
Recommendations for Hosts
- Use the overall average lead time (77 days) as a baseline for your pricing and availability strategy in Emigrant.
- For June stays, consider implementing length-of-stay discounts or slightly higher rates for bookings made less than 103 days out to capitalize on advance planning.
- Target marketing efforts for the Summer season well in advance (at least 101 days) to capture early planners.
- Monitor your own booking lead times against these Emigrant averages to identify opportunities for dynamic pricing adjustments.
Popular & Essential Airbnb Amenities in Emigrant (2026)
Amenity Prevalence
Amenity Insights for Emigrant
- Essential amenities in Emigrant that guests expect include: Smoke alarm, Heating, Wifi, Free parking on premises, Fire extinguisher, Coffee maker, Hair dryer. Lacking these (any) could significantly impact bookings.
- Popular amenities like Microwave, Dishes and silverware, Refrigerator are common but not universal. Offering these can provide a competitive edge.
Recommendations for Hosts
- Ensure your listing includes all essential amenities for Emigrant: Smoke alarm, Heating, Wifi, Free parking on premises, Fire extinguisher, Coffee maker, Hair dryer.
- Prioritize adding missing essentials: Smoke alarm, Heating, Wifi, Free parking on premises, Fire extinguisher, Coffee maker, Hair dryer.
- Consider adding popular differentiators like Microwave or Dishes and silverware to increase appeal.
- Highlight unique or less common amenities you offer (e.g., hot tub, dedicated workspace, EV charger) in your listing description and photos.
- Regularly check competitor amenities in Emigrant to stay competitive.
Emigrant Airbnb Guest Demographics & Profile Analysis (2026)
Guest Profile Summary for Emigrant
- The typical guest profile for Airbnb in Emigrant consists of primarily domestic travelers (92%), often arriving from nearby Billings, typically belonging to the Post-2000s (Gen Z/Alpha) group (50%), primarily speaking English or Spanish.
- Domestic travelers account for 92.1% of guests.
- Key international markets include United States (92.1%) and Canada (2%).
- Top languages spoken are English (72.1%) followed by Spanish (10%).
- A significant demographic segment is the Post-2000s (Gen Z/Alpha) group, representing 50% of guests.
Recommendations for Hosts
- Target domestic marketing efforts towards travelers from Billings and Bozeman.
- Tailor amenities and listing descriptions to appeal to the dominant Post-2000s (Gen Z/Alpha) demographic (e.g., highlight fast WiFi, smart home features, local guides).
- Highlight unique local experiences or amenities relevant to the primary guest profile.
- Consider seasonal promotions aligned with peak travel times for key origin markets.
Nearby Short-Term Rental Market Comparison
How does the Emigrant Airbnb market stack up against its neighbors? Compare key performance metrics like average monthly revenue, ADR, and occupancy rates in surrounding areas to understand the broader regional STR landscape.
| Market | Active Properties | Monthly Revenue | Daily Rate | Avg. Occupancy |
|---|---|---|---|---|
| Big Sky | 1,016 | $5,418 | $769.30 | 36% |
| Gallatin Gateway | 53 | $4,600 | $477.28 | 45% |
| Island Park | 1,029 | $4,306 | $436.45 | 47% |
| Gardiner | 209 | $4,223 | $314.18 | 55% |
| Cooke City | 43 | $4,132 | $308.30 | 51% |
| Pray | 53 | $4,084 | $362.97 | 47% |
| West Yellowstone | 293 | $3,896 | $390.58 | 45% |
| Bozeman | 733 | $3,733 | $292.27 | 50% |
| Livingston | 355 | $3,305 | $322.10 | 47% |
| Red Lodge | 238 | $3,297 | $312.35 | 42% |