Browning Airbnb Market Analysis 2026: Short Term Rental Data & Vacation Rental Statistics in Montana, United States
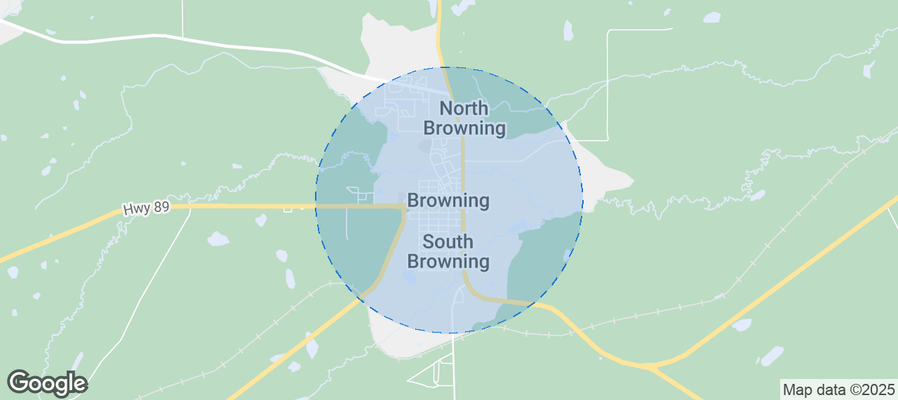
Is Airbnb profitable in Browning in 2026? Explore comprehensive Airbnb analytics for Browning, Montana, United States to uncover income potential. This 2026 STR market report for Browning, based on AirROI data from February 2025 to January 2026, reveals key trends in the niche market of 33 active listings.
Whether you're considering an Airbnb investment in Browning, optimizing your existing vacation rental, or exploring rental arbitrage opportunities, understanding the Browning Airbnb data is crucial. Leveraging the low regulation environment is key to maximizing your short term rental income potential. Let's dive into the specifics.
Key Browning Airbnb Performance Metrics Overview
Monthly Airbnb Revenue Variations & Income Potential in Browning (2026)
Understanding the monthly revenue variations for Airbnb listings in Browning is key to maximizing your short term rental income potential. Seasonality significantly impacts earnings. Our analysis, based on data from the past 12 months, shows that the peak revenue month for STRs in Browning is typically February, while December often presents the lowest earnings, highlighting opportunities for strategic pricing adjustments during shoulder and low seasons. Explore the typical Airbnb income in Browning across different performance tiers:
- Best-in-class properties (Top 10%) achieve $7,165+ monthly, often utilizing dynamic pricing and superior guest experiences.
- Strong performing properties (Top 25%) earn $5,293 or more, indicating effective management and desirable locations/amenities.
- Typical properties (Median) generate around $3,431 per month, representing the average market performance.
- Entry-level properties (Bottom 25%) see earnings around $1,998, often with potential for optimization.
Average Monthly Airbnb Earnings Trend in Browning
Browning Airbnb Occupancy Rate Trends (2026)
Maximize your bookings by understanding the Browning STR occupancy trends. Seasonal demand shifts significantly influence how often properties are booked. Typically, Februarysees the highest demand (peak season occupancy), while December experiences the lowest (low season). Effective strategies, like adjusting minimum stays or offering promotions, can boost occupancy during slower periods. Here's how different property tiers perform in Browning:
- Best-in-class properties (Top 10%) achieve 70%+ occupancy, indicating high desirability and potentially optimized availability.
- Strong performing properties (Top 25%) maintain 58% or higher occupancy, suggesting good market fit and guest satisfaction.
- Typical properties (Median) have an occupancy rate around 44%.
- Entry-level properties (Bottom 25%) average 32% occupancy, potentially facing higher vacancy.
Average Monthly Occupancy Rate Trend in Browning
Average Daily Rate (ADR) Airbnb Trends in Browning (2026)
Effective short term rental pricing strategy in Browning involves understanding monthly ADR fluctuations. The Average Daily Rate (ADR) for Airbnb in Browning typically peaks in January and dips lowest during February. Leveraging Airbnb dynamic pricing tools or strategies based on this seasonality can significantly boost revenue. Here's a look at the typical nightly rates achieved:
- Best-in-class properties (Top 10%) command rates of $448+ per night, often due to premium features or locations.
- Strong performing properties (Top 25%) achieve nightly rates of $319 or more.
- Typical properties (Median) charge around $199 per night.
- Entry-level properties (Bottom 25%) earn around $121 per night.
Average Daily Rate (ADR) Trend by Month in Browning
Get Live Browning Market Intelligence 👇
Explore Real-time Analytics
Airbnb Seasonality Analysis & Trends in Browning (2026)
Peak Season (February, July, April)
- Revenue averages $6,186 per month
- Occupancy rates average 62.9%
- Daily rates average $230
Shoulder Season
- Revenue averages $3,661 per month
- Occupancy maintains around 45.6%
- Daily rates hold near $237
Low Season (January, March, December)
- Revenue drops to average $999 per month
- Occupancy decreases to average 11.8%
- Daily rates adjust to average $238
Seasonality Insights for Browning
- The Airbnb seasonality in Browning shows highly seasonal trends requiring careful strategy. While the sections above show seasonal averages, it's also insightful to look at the extremes:
- During the high season, the absolute peak month showcases Browning's highest earning potential, with monthly revenues capable of climbing to $8,035, occupancy reaching a high of 75.0%, and ADRs peaking at $244.
- Conversely, the slowest single month of the year, typically falling within the low season, marks the market's lowest point. In this month, revenue might dip to $0, occupancy could drop to 0.0%, and ADRs may adjust down to $225.
- Understanding both the seasonal averages and these monthly peaks and troughs in revenue, occupancy, and ADR is crucial for maximizing your Airbnb profit potential in Browning.
Seasonal Strategies for Maximizing Profit
- Peak Season: Maximize revenue through premium pricing and potentially longer minimum stays. Ensure high availability.
- Low Season: Offer competitive pricing, special promotions (e.g., extended stay discounts), and flexible cancellation policies. Target off-season travelers like remote workers or budget-conscious guests.
- Shoulder Seasons: Implement dynamic pricing that balances peak and low rates. Target weekend travelers or specific events. Offer slightly more flexible terms than peak season.
- Regularly analyze your own performance against these Browning seasonality benchmarks and adjust your pricing and availability strategy accordingly.
Best Areas for Airbnb Investment in Browning (2026)
Exploring the top neighborhoods for short-term rentals in Browning? This section highlights key areas, outlining why they are attractive for hosts and guests, along with notable local attractions. Consider these locations based on your target guest profile and investment strategy.
| Neighborhood / Area | Why Host Here? (Target Guests & Appeal) | Key Attractions & Landmarks |
|---|---|---|
| Browning Downtown | Browning's central area with easy access to local shops, restaurants, and cultural attractions. Ideal for visitors looking to experience the local community and events. | Blackfeet Heritage Center, Browning Community Park, Cultural events, Local cuisine |
| Lewis and Clark Road | A scenic route that connects Browning to the surrounding natural beauty, attracting nature lovers and outdoor enthusiasts who seek access to adventure. | Glacier National Park, activities like hiking and camping, stunning mountain views |
| Two Medicine Lake | Located nearby Browning, this area offers breathtaking landscapes and outdoor activities. Great for nature-focused guests looking for tranquility and recreation. | Two Medicine Lake, hiking trails, wildlife viewing, photography opportunities |
| East Glacier Park | A small community that serves as a gateway to Glacier National Park, perfect for those wanting to explore the great outdoors while having cozy lodging. | Glacier National Park, Lodgepole Pine Forests, St. Mary Valley, excellent for fishing and hiking |
| Browning Indian Reservation | A culturally rich area that offers visitors a chance to learn about the Native American heritage and lifestyle, providing a unique experience. | Native American cultural sites, local events and activities, authentic cuisine experiences |
| Cut Bank | Another nearby town with historical significance and access routes to outdoor exploration. Good for travelers looking to stay in a quieter area. | Old Town Museum, natural hot springs, agricultural landscapes |
| St. Mary | Situated near the entrance to Glacier National Park, it attracts visitors looking to explore one of Montana's most beautiful parks while enjoying local accommodations. | Glacier National Park, St. Mary Falls, scenic driving along Going-to-the-Sun Road |
| Heart Butte | A small community that offers a more secluded stay with close ties to nature and local traditions, attracting those looking for a peaceful getaway. | traditional gatherings, local crafts, surrounding natural beauty |
Understanding Airbnb License Requirements & STR Laws in Browning (2026)
While Browning, Montana, United States currently shows low STR regulations, specific Airbnb license requirements might still exist or change. Always verify the latest short term rental regulations and Airbnb license requirements directly with local government authorities for Browning to ensure full compliance before hosting.
(Source: AirROI data, 2026, finding no licensed listings among those analyzed)
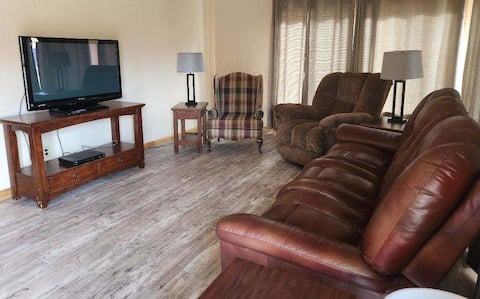
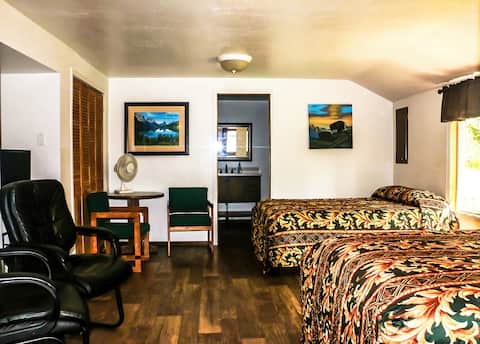
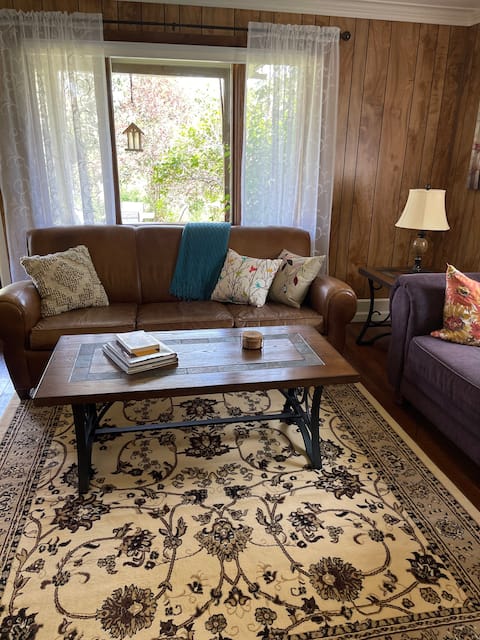
Top Performing Airbnb Properties in Browning (2026)
Benchmark your potential! Explore examples of top-performing Airbnb properties in Browningbased on Trailing Twelve Month (TTM) revenue. Analyze their characteristics, revenue, occupancy rate, and ADR to understand what drives success in this market.

Stunning 360° Views Near Glacier NP | Cozy Retreat
Entire Place • 3 bedrooms

Glacier Cabin w/ Stunning Views of the Rockies
Entire Place • 3 bedrooms

In the Midst of Glacier
Entire Place • 2 bedrooms
Riverhouse-Glacier Park-ST. Mary MT (2-night min)
Entire Place • 3 bedrooms
Wild Rose- Glacier Park-St. Mary MT (2-night min)
Entire Place • 1 bedroom
Black Crow Inn Comfortable Country Home by Glacier
Entire Place • 3 bedrooms
Note: Performance varies based on location, size, amenities, seasonality, and management quality. Data reflects the past 12 months.
Top Performing Airbnb Hosts in Browning (2026)
Learn from the best! This table showcases top-performing Airbnb hosts in Browning based on the number of properties managed and estimated total revenue over the past year. Analyze their scale and performance metrics.
| Host Name | Properties | Grossing Revenue | Stay Reviews | Avg Rating |
|---|---|---|---|---|
| Jackie | 4 | $166,880 | 65 | 4.46/5.0 |
| Lester | 3 | $116,214 | 96 | 4.70/5.0 |
| Teri | 3 | $93,734 | 184 | 4.95/5.0 |
| Jayson | 9 | $71,605 | 142 | 4.72/5.0 |
| T T M | 2 | $64,925 | 51 | 4.36/5.0 |
| James | 1 | $50,175 | 297 | 4.96/5.0 |
| Lv | 1 | $44,701 | 55 | 4.96/5.0 |
| Debbie | 1 | $41,333 | 105 | 4.90/5.0 |
| Molly Jo | 4 | $39,925 | 301 | 4.74/5.0 |
| Elaine | 1 | $37,620 | 146 | 4.91/5.0 |
Analyzing the strategies of top hosts, such as their property selection, pricing, and guest communication, can offer valuable lessons for optimizing your own Airbnb operations in Browning.
Dive Deeper: Advanced Browning STR Market Data (2026)
Ready to unlock more insights? AirROI provides access to advanced metrics and comprehensive Airbnb data for Browning. Explore detailed analytics beyond this report to refine your investment strategy, optimize pricing, and maximize your vacation rental profits.
Explore Advanced MetricsBrowning Short-Term Rental Market Composition (2026): Property & Room Types
Room Type Distribution
Property Type Distribution
Market Composition Insights for Browning
- The Browning Airbnb market composition is heavily skewed towards Entire Home/Apt listings, which make up 72.7% of the 33 active rentals. This indicates strong guest preference for privacy and space.
- Looking at the property type distribution in Browning, Outdoor/Unique properties are the most common (54.5%), reflecting the local real estate landscape.
- Houses represent a significant 30.3% portion, catering likely to families or larger groups.
- The presence of 9.1% Hotel/Boutique listings indicates integration with traditional hospitality.
Browning Airbnb Room Capacity Analysis (2026): Bedroom Distribution
Distribution of Listings by Number of Bedrooms
Room Capacity Insights for Browning
- The dominant room capacity in Browning is 1 bedroom listings, making up 39.4% of the market. This suggests a strong demand for properties suitable for couples or solo travelers.
- Together, 1 bedroom and 3 bedrooms properties represent 51.5% of the active Airbnb listings in Browning, indicating a high concentration in these sizes.
Browning Vacation Rental Guest Capacity Trends (2026)
Distribution of Listings by Guest Capacity
Guest Capacity Insights for Browning
- The most common guest capacity trend in Browning vacation rentals is listings accommodating 2 guests (33.3%). This suggests the primary traveler segment is likely couples or solo travelers.
- Properties designed for 2 guests and 4 guests dominate the Browning STR market, accounting for 51.5% of listings.
- 27.3% of properties accommodate 6+ guests, serving the market segment for larger families or group travel in Browning.
- On average, properties in Browning are equipped to host 3.4 guests.
Browning Airbnb Booking Patterns (2026): Available vs. Booked Days
Available Days Distribution
Booked Days Distribution
Booking Pattern Insights for Browning
- The most common availability pattern in Browning falls within the 271-366 days range, representing 57.6% of listings. This suggests many properties have significant open periods on their calendars.
- Approximately 97.0% of listings show high availability (181+ days open annually), indicating potential for increased bookings or specific owner usage patterns.
- For booked days, the 91-180 days range is most frequent in Browning (51.5%), reflecting common guest stay durations or potential owner blocking patterns.
- A notable 3.0% of properties secure long booking periods (181+ days booked per year), highlighting successful long-term rental strategies or significant owner usage.
Browning Airbnb Minimum Stay Requirements Analysis
Distribution of Listings by Minimum Night Requirement
1 Night
18 listings
54.5% of total
2 Nights
3 listings
9.1% of total
3 Nights
2 listings
6.1% of total
4-6 Nights
1 listings
3% of total
30+ Nights
9 listings
27.3% of total
Key Insights
- The most prevalent minimum stay requirement in Browning is 1 Night, adopted by 54.5% of listings. This highlights the market's preference for shorter, flexible bookings.
- A strong majority (63.6%) of the Browning Airbnb data shows acceptance of very short stays (1-2 nights), indicating a dynamic, high-turnover market.
- A significant segment (27.3%) caters to monthly stays (30+ nights) in Browning, pointing to opportunities in the extended-stay market.
Recommendations
- Align with the market by considering a 1 Night minimum stay, as 54.5% of Browning hosts use this setting.
- Explore offering discounts for stays of 30+ nights to attract the 27.3% of the market seeking extended stays.
- Adjust minimum nights based on seasonality – potentially shorter during low season and longer during peak demand periods in Browning.
Browning Airbnb Cancellation Policy Trends Analysis (2026)
Flexible
4 listings
12.1% of total
Moderate
14 listings
42.4% of total
Firm
8 listings
24.2% of total
Strict
7 listings
21.2% of total
Cancellation Policy Insights for Browning
- The prevailing Airbnb cancellation policy trend in Browning is Moderate, used by 42.4% of listings.
- There's a relatively balanced mix between guest-friendly (54.5%) and stricter (45.4%) policies, offering choices for different guest needs.
Recommendations for Hosts
- Consider adopting a Moderate policy to align with the 42.4% market standard in Browning.
- Regularly review your cancellation policy against competitors and market demand shifts in Browning.
Browning STR Booking Lead Time Analysis (2026)
Average Booking Lead Time by Month
Booking Lead Time Insights for Browning
- The overall average booking lead time for vacation rentals in Browning is 98 days.
- Guests book furthest in advance for stays during April (average 185 days), likely coinciding with peak travel demand or local events.
- The shortest booking windows occur for stays in March (average 0 days), indicating more last-minute travel plans during this time.
- Seasonally, Spring (106 days avg.) sees the longest lead times, while Winter (37 days avg.) has the shortest, reflecting typical travel planning cycles.
Recommendations for Hosts
- Use the overall average lead time (98 days) as a baseline for your pricing and availability strategy in Browning.
- For April stays, consider implementing length-of-stay discounts or slightly higher rates for bookings made less than 185 days out to capitalize on advance planning.
- During March, focus on last-minute booking availability and promotions, as guests book with very short notice (0 days avg.).
- Target marketing efforts for the Spring season well in advance (at least 106 days) to capture early planners.
- Monitor your own booking lead times against these Browning averages to identify opportunities for dynamic pricing adjustments.
Popular & Essential Airbnb Amenities in Browning (2026)
Amenity Prevalence
Amenity Insights for Browning
- Essential amenities in Browning that guests expect include: Free parking on premises. Lacking these (this) could significantly impact bookings.
- Popular amenities like Fire extinguisher, Heating, Smoke alarm are common but not universal. Offering these can provide a competitive edge.
- Warning: Wifi is not universally provided but is considered essential globally. Ensure reliable Wifi is offered.
Recommendations for Hosts
- Ensure your listing includes all essential amenities for Browning: Free parking on premises.
- Consider adding popular differentiators like Fire extinguisher or Heating to increase appeal.
- Highlight unique or less common amenities you offer (e.g., hot tub, dedicated workspace, EV charger) in your listing description and photos.
- Regularly check competitor amenities in Browning to stay competitive.
Browning Airbnb Guest Demographics & Profile Analysis (2026)
Guest Profile Summary for Browning
- The typical guest profile for Airbnb in Browning consists of primarily domestic travelers (95%), often arriving from nearby New York, typically belonging to the Post-2000s (Gen Z/Alpha) group (50%), primarily speaking English or Spanish.
- Domestic travelers account for 95.1% of guests.
- Key international markets include United States (95.1%) and Canada (1.8%).
- Top languages spoken are English (61.1%) followed by Spanish (10.3%).
- A significant demographic segment is the Post-2000s (Gen Z/Alpha) group, representing 50% of guests.
Recommendations for Hosts
- Target domestic marketing efforts towards travelers from New York and Los Angeles.
- Tailor amenities and listing descriptions to appeal to the dominant Post-2000s (Gen Z/Alpha) demographic (e.g., highlight fast WiFi, smart home features, local guides).
- Highlight unique local experiences or amenities relevant to the primary guest profile.
- Consider seasonal promotions aligned with peak travel times for key origin markets.
Nearby Short-Term Rental Market Comparison
How does the Browning Airbnb market stack up against its neighbors? Compare key performance metrics like average monthly revenue, ADR, and occupancy rates in surrounding areas to understand the broader regional STR landscape.
| Market | Active Properties | Monthly Revenue | Daily Rate | Avg. Occupancy |
|---|---|---|---|---|
| West Glacier | 90 | $4,297 | $391.29 | 58% |
| Whitefish | 1,037 | $3,994 | $450.24 | 40% |
| Somers | 77 | $3,484 | $405.79 | 46% |
| Lakeside | 141 | $3,201 | $416.76 | 40% |
| Babb | 63 | $3,127 | $282.03 | 60% |
| Dayton | 14 | $3,049 | $418.01 | 44% |
| Columbia Falls | 569 | $3,030 | $317.64 | 50% |
| Martin City | 51 | $3,021 | $256.01 | 56% |
| Polson | 140 | $2,880 | $362.31 | 44% |
| Kalispell | 537 | $2,806 | $289.46 | 47% |