Belt Airbnb Market Analysis 2025: Short Term Rental Data & Vacation Rental Statistics in Montana, United States
Is Airbnb profitable in Belt in 2025? Explore comprehensive Airbnb analytics for Belt, Montana, United States to uncover income potential. This 2025 STR market report for Belt, based on AirROI data from September 2024 to August 2025, reveals key trends in the niche market of 18 active listings.
Whether you're considering an Airbnb investment in Belt, optimizing your existing vacation rental, or exploring rental arbitrage opportunities, understanding the Belt Airbnb data is crucial. Leveraging the low regulation environment is key to maximizing your short term rental income potential. Let's dive into the specifics.
Key Belt Airbnb Performance Metrics Overview
Monthly Airbnb Revenue Variations & Income Potential in Belt (2025)
Understanding the monthly revenue variations for Airbnb listings in Belt is key to maximizing your short term rental income potential. Seasonality significantly impacts earnings. Our analysis, based on data from the past 12 months, shows that the peak revenue month for STRs in Belt is typically July, while January often presents the lowest earnings, highlighting opportunities for strategic pricing adjustments during shoulder and low seasons. Explore the typical Airbnb income in Belt across different performance tiers:
- Best-in-class properties (Top 10%) achieve $12,094+ monthly, often utilizing dynamic pricing and superior guest experiences.
- Strong performing properties (Top 25%) earn $5,866 or more, indicating effective management and desirable locations/amenities.
- Typical properties (Median) generate around $3,219 per month, representing the average market performance.
- Entry-level properties (Bottom 25%) see earnings around $1,489, often with potential for optimization.
Average Monthly Airbnb Earnings Trend in Belt
Belt Airbnb Occupancy Rate Trends (2025)
Maximize your bookings by understanding the Belt STR occupancy trends. Seasonal demand shifts significantly influence how often properties are booked. Typically, Septembersees the highest demand (peak season occupancy), while January experiences the lowest (low season). Effective strategies, like adjusting minimum stays or offering promotions, can boost occupancy during slower periods. Here's how different property tiers perform in Belt:
- Best-in-class properties (Top 10%) achieve 50%+ occupancy, indicating high desirability and potentially optimized availability.
- Strong performing properties (Top 25%) maintain 34% or higher occupancy, suggesting good market fit and guest satisfaction.
- Typical properties (Median) have an occupancy rate around 22%.
- Entry-level properties (Bottom 25%) average 14% occupancy, potentially facing higher vacancy.
Average Monthly Occupancy Rate Trend in Belt
Average Daily Rate (ADR) Airbnb Trends in Belt (2025)
Effective short term rental pricing strategy in Belt involves understanding monthly ADR fluctuations. The Average Daily Rate (ADR) for Airbnb in Belt typically peaks in June and dips lowest during March. Leveraging Airbnb dynamic pricing tools or strategies based on this seasonality can significantly boost revenue. Here's a look at the typical nightly rates achieved:
- Best-in-class properties (Top 10%) command rates of $1,392+ per night, often due to premium features or locations.
- Strong performing properties (Top 25%) achieve nightly rates of $936 or more.
- Typical properties (Median) charge around $465 per night.
- Entry-level properties (Bottom 25%) earn around $163 per night.
Average Daily Rate (ADR) Trend by Month in Belt
Get Live Belt Market Intelligence 👇

Explore Real-time Analytics
Airbnb Seasonality Analysis & Trends in Belt (2025)
Peak Season (July, August, September)
- Revenue averages $9,735 per month
- Occupancy rates average 39.3%
- Daily rates average $691
Shoulder Season
- Revenue averages $3,908 per month
- Occupancy maintains around 24.6%
- Daily rates hold near $615
Low Season (January, February, November)
- Revenue drops to average $2,478 per month
- Occupancy decreases to average 19.8%
- Daily rates adjust to average $496
Seasonality Insights for Belt
- The Airbnb seasonality in Belt shows highly seasonal trends requiring careful strategy. While the sections above show seasonal averages, it's also insightful to look at the extremes:
- During the high season, the absolute peak month showcases Belt's highest earning potential, with monthly revenues capable of climbing to $13,850, occupancy reaching a high of 45.4%, and ADRs peaking at $783.
- Conversely, the slowest single month of the year, typically falling within the low season, marks the market's lowest point. In this month, revenue might dip to $2,321, occupancy could drop to 17.2%, and ADRs may adjust down to $470.
- Understanding both the seasonal averages and these monthly peaks and troughs in revenue, occupancy, and ADR is crucial for maximizing your Airbnb profit potential in Belt.
Seasonal Strategies for Maximizing Profit
- Peak Season: Maximize revenue through premium pricing and potentially longer minimum stays. Ensure high availability.
- Low Season: Offer competitive pricing, special promotions (e.g., extended stay discounts), and flexible cancellation policies. Target off-season travelers like remote workers or budget-conscious guests.
- Shoulder Seasons: Implement dynamic pricing that balances peak and low rates. Target weekend travelers or specific events. Offer slightly more flexible terms than peak season.
- Regularly analyze your own performance against these Belt seasonality benchmarks and adjust your pricing and availability strategy accordingly.
Best Areas for Airbnb Investment in Belt (2025)
Exploring the top neighborhoods for short-term rentals in Belt? This section highlights key areas, outlining why they are attractive for hosts and guests, along with notable local attractions. Consider these locations based on your target guest profile and investment strategy.
| Neighborhood / Area | Why Host Here? (Target Guests & Appeal) | Key Attractions & Landmarks |
|---|---|---|
| Belt Creek Campground | A beautiful outdoor area offering camping and recreational activities. Perfect for nature lovers and families looking for outdoor experiences near waterfalls and hiking trails. | Belt Creek, Sluice Boxes State Park, Great Falls of the Missouri River, Photos of the scenic views, Nature trails |
| Belt Historic District | Known for its charming early 20th-century architecture, this area attracts visitors interested in history and small-town culture. Walking tours and local museums enhance the visitor experience. | Belt Museum, Historic buildings, Local shops, Community events, Historic walking tours |
| Mighty Mo Brewing Company | This local brewery attracts both locals and tourists looking for craft beer experience. It's a gathering place with plenty of events that draw visitors year-round. | Craft brewery tours, Beer tastings, Live music events, Local food trucks, Community events |
| Belt Park | A local community park that hosts many events and activities. It is ideal for families looking for a place to relax and have fun with kids. | Playground, Picnic areas, Sports fields, Walking paths, Community events |
| Great Falls | Located nearby, Great Falls offers larger city amenities including shopping, dining, and cultural attractions, making it a base for exploring the nearby rural areas. | Great Falls Convention Center, Paris Gibson Square Museum of Art, C.M. Russell Museum, Giant Springs State Park, River's Edge Trail |
| The Belt Line | A scenic cycling and walking trail that connects various parts of Belt and the surrounding area. Ideal for those looking to enjoy outdoor activities close to town. | Cycling trails, Walking paths, Scenic views, Access to local parks, Community events |
| Highwood Mountains | A beautiful mountain range offering outdoor activities like hiking, fishing, and wildlife viewing. Attracts adventure seekers and nature enthusiasts. | Hiking trails, Wildlife viewing, Scenic overlooks, Fishing spots, Camping areas |
| Local Events | Belt hosts several annual community events that draw visitors, making it an ideal area for Airbnb hosting during those times. | Belt Music Festival, Local Arts and Crafts Fair, Farmers Market, Community potlucks, Holiday celebrations |
Understanding Airbnb License Requirements & STR Laws in Belt (2025)
While Belt, Montana, United States currently shows low STR regulations, specific Airbnb license requirements might still exist or change. Always verify the latest short term rental regulations and Airbnb license requirements directly with local government authorities for Belt to ensure full compliance before hosting.
(Source: AirROI data, 2025, finding no licensed listings among those analyzed)
Top Performing Airbnb Properties in Belt (2025)
Benchmark your potential! Explore examples of top-performing Airbnb properties in Beltbased on Trailing Twelve Month (TTM) revenue. Analyze their characteristics, revenue, occupancy rate, and ADR to understand what drives success in this market.
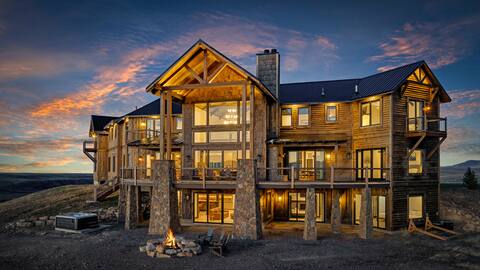
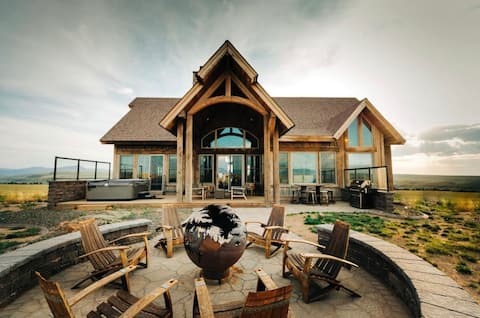
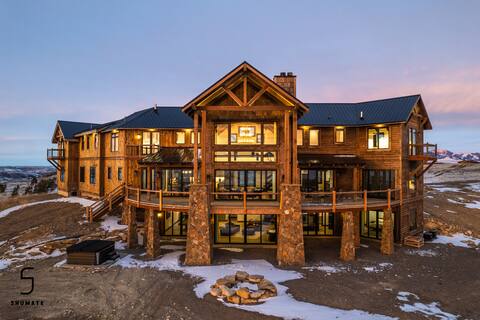
Belt Creek Lodge Hot Tub • Game Room • Fast Wi-Fi
Entire Place • 8 bedrooms

Lucky Man Ranch
Entire Place • 5 bedrooms

Wheelhouse Ranch
Entire Place • 4 bedrooms
Skywalker Ranch
Entire Place • 4 bedrooms
Sunset Ranch @ RBC
Entire Place • 8 bedrooms

'Free Spirit Ranch' w/ Hot Tub & Mountain Views
Entire Place • 4 bedrooms
Note: Performance varies based on location, size, amenities, seasonality, and management quality. Data reflects the past 12 months.
Top Performing Airbnb Hosts in Belt (2025)
Learn from the best! This table showcases top-performing Airbnb hosts in Belt based on the number of properties managed and estimated total revenue over the past year. Analyze their scale and performance metrics.
| Host Name | Properties | Grossing Revenue | Stay Reviews | Avg Rating |
|---|---|---|---|---|
| Haylie | 8 | $339,426 | 24 | 5.00/5.0 |
| John | 1 | $149,324 | 1 | Not Rated |
| Nadia | 1 | $42,665 | 3 | 5.00/5.0 |
| Evolve | 1 | $42,235 | 1 | Not Rated |
| Curtis | 1 | $30,664 | 13 | 5.00/5.0 |
| Mary Beth | 1 | $23,452 | 99 | 4.82/5.0 |
| Katie | 2 | $22,360 | 51 | 4.88/5.0 |
| Julie | 1 | $13,613 | 12 | 4.83/5.0 |
| Host #50853225 | 1 | $7,023 | 10 | 5.00/5.0 |
| Gentry | 1 | $3,179 | 1 | Not Rated |
Analyzing the strategies of top hosts, such as their property selection, pricing, and guest communication, can offer valuable lessons for optimizing your own Airbnb operations in Belt.
Dive Deeper: Advanced Belt STR Market Data (2025)
Ready to unlock more insights? AirROI provides access to advanced metrics and comprehensive Airbnb data for Belt. Explore detailed analytics beyond this report to refine your investment strategy, optimize pricing, and maximize your vacation rental profits.
Explore Advanced MetricsBelt Short-Term Rental Market Composition (2025): Property & Room Types
Room Type Distribution
Property Type Distribution
Market Composition Insights for Belt
- The Belt Airbnb market composition is heavily skewed towards Entire Home/Apt listings, which make up 94.4% of the 18 active rentals. This indicates strong guest preference for privacy and space.
- Looking at the property type distribution in Belt, Outdoor/Unique properties are the most common (50%), reflecting the local real estate landscape.
- Houses represent a significant 50% portion, catering likely to families or larger groups.
Belt Airbnb Room Capacity Analysis (2025): Bedroom Distribution
Distribution of Listings by Number of Bedrooms
Room Capacity Insights for Belt
- The dominant room capacity in Belt is 4 bedrooms listings, making up 33.3% of the market. This suggests a strong demand for properties suitable for families or small groups.
- Together, 4 bedrooms and 2 bedrooms properties represent 66.6% of the active Airbnb listings in Belt, indicating a high concentration in these sizes.
- A significant 61.1% of listings offer 3+ bedrooms, catering to larger groups and families seeking more space in Belt.
Belt Vacation Rental Guest Capacity Trends (2025)
Distribution of Listings by Guest Capacity
Guest Capacity Insights for Belt
- The most common guest capacity trend in Belt vacation rentals is listings accommodating 8+ guests (55.6%). This suggests the primary traveler segment is likely larger groups.
- Properties designed for 8+ guests and 4 guests dominate the Belt STR market, accounting for 83.4% of listings.
- 66.7% of properties accommodate 6+ guests, serving the market segment for larger families or group travel in Belt.
- On average, properties in Belt are equipped to host 6.2 guests.
Belt Airbnb Booking Patterns (2025): Available vs. Booked Days
Available Days Distribution
Booked Days Distribution
Booking Pattern Insights for Belt
- The most common availability pattern in Belt falls within the 271-366 days range, representing 83.3% of listings. This suggests many properties have significant open periods on their calendars.
- Approximately 100.0% of listings show high availability (181+ days open annually), indicating potential for increased bookings or specific owner usage patterns.
- For booked days, the 31-90 days range is most frequent in Belt (66.7%), reflecting common guest stay durations or potential owner blocking patterns.
Belt Airbnb Minimum Stay Requirements Analysis
Distribution of Listings by Minimum Night Requirement
1 Night
4 listings
23.5% of total
2 Nights
11 listings
64.7% of total
30+ Nights
2 listings
11.8% of total
Key Insights
- The most prevalent minimum stay requirement in Belt is 2 Nights, adopted by 64.7% of listings. This highlights the market's preference for shorter, flexible bookings.
- A strong majority (88.2%) of the Belt Airbnb data shows acceptance of very short stays (1-2 nights), indicating a dynamic, high-turnover market.
- A significant segment (11.8%) caters to monthly stays (30+ nights) in Belt, pointing to opportunities in the extended-stay market.
Recommendations
- Align with the market by considering a 2 Nights minimum stay, as 64.7% of Belt hosts use this setting.
- If feasible, allowing 1-night stays, especially midweek or during low season, could capture last-minute bookings, as only 23.5% currently do.
- Explore offering discounts for stays of 30+ nights to attract the 11.8% of the market seeking extended stays.
- Adjust minimum nights based on seasonality – potentially shorter during low season and longer during peak demand periods in Belt.
Belt Airbnb Cancellation Policy Trends Analysis (2025)
Super Strict 30 Days
1 listings
5.9% of total
Super Strict 60 Days
7 listings
41.2% of total
Flexible
3 listings
17.6% of total
Moderate
2 listings
11.8% of total
Firm
2 listings
11.8% of total
Strict
2 listings
11.8% of total
Cancellation Policy Insights for Belt
- The prevailing Airbnb cancellation policy trend in Belt is Super Strict 60 Days, used by 41.2% of listings.
- There's a relatively balanced mix between guest-friendly (29.4%) and stricter (23.6%) policies, offering choices for different guest needs.
Recommendations for Hosts
- Consider adopting a Super Strict 60 Days policy to align with the 41.2% market standard in Belt.
- Using a Strict policy might deter some guests, as only 11.8% of listings use it. Evaluate if potential revenue protection outweighs possible lower booking rates.
- Regularly review your cancellation policy against competitors and market demand shifts in Belt.
Belt STR Booking Lead Time Analysis (2025)
Average Booking Lead Time by Month
Booking Lead Time Insights for Belt
- The overall average booking lead time for vacation rentals in Belt is 89 days.
- Guests book furthest in advance for stays during May (average 135 days), likely coinciding with peak travel demand or local events.
- The shortest booking windows occur for stays in January (average 23 days), indicating more last-minute travel plans during this time.
- Seasonally, Summer (110 days avg.) sees the longest lead times, while Fall (60 days avg.) has the shortest, reflecting typical travel planning cycles.
Recommendations for Hosts
- Use the overall average lead time (89 days) as a baseline for your pricing and availability strategy in Belt.
- For May stays, consider implementing length-of-stay discounts or slightly higher rates for bookings made less than 135 days out to capitalize on advance planning.
- Target marketing efforts for the Summer season well in advance (at least 110 days) to capture early planners.
- Monitor your own booking lead times against these Belt averages to identify opportunities for dynamic pricing adjustments.
Popular & Essential Airbnb Amenities in Belt (2025)
Amenity Prevalence
Amenity Insights for Belt
- Essential amenities in Belt that guests expect include: Carbon monoxide alarm, Wifi, TV. Lacking these (any) could significantly impact bookings.
- Popular amenities like Smoke alarm, Free parking on premises, Washer are common but not universal. Offering these can provide a competitive edge.
Recommendations for Hosts
- Ensure your listing includes all essential amenities for Belt: Carbon monoxide alarm, Wifi, TV.
- Consider adding popular differentiators like Smoke alarm or Free parking on premises to increase appeal.
- Highlight unique or less common amenities you offer (e.g., hot tub, dedicated workspace, EV charger) in your listing description and photos.
- Regularly check competitor amenities in Belt to stay competitive.
Belt Airbnb Guest Demographics & Profile Analysis (2025)
Guest Profile Summary for Belt
- The typical guest profile for Airbnb in Belt consists of primarily domestic travelers (93%), often arriving from nearby Bozeman, typically belonging to the Post-2000s (Gen Z/Alpha) group (50%), primarily speaking English or Portuguese.
- Domestic travelers account for 92.6% of guests.
- Key international markets include United States (92.6%) and Brazil (7.4%).
- Top languages spoken are English (66.7%) followed by Portuguese (25%).
- A significant demographic segment is the Post-2000s (Gen Z/Alpha) group, representing 50% of guests.
Recommendations for Hosts
- Target domestic marketing efforts towards travelers from Bozeman and São Luís.
- Tailor amenities and listing descriptions to appeal to the dominant Post-2000s (Gen Z/Alpha) demographic (e.g., highlight fast WiFi, smart home features, local guides).
- Highlight unique local experiences or amenities relevant to the primary guest profile.
- Consider seasonal promotions aligned with peak travel times for key origin markets.
Nearby Short-Term Rental Market Comparison
How does the Belt Airbnb market stack up against its neighbors? Compare key performance metrics like average monthly revenue, ADR, and occupancy rates in surrounding areas to understand the broader regional STR landscape.
| Market | Active Properties | Monthly Revenue | Daily Rate | Avg. Occupancy |
|---|---|---|---|---|
| Clancy | 19 | $2,536 | $176.72 | 50% |
| East Helena | 11 | $2,326 | $170.10 | 59% |
| White Sulphur Springs | 33 | $2,321 | $216.52 | 39% |
| Townsend | 22 | $2,284 | $214.32 | 43% |
| Lewistown | 40 | $2,243 | $183.81 | 52% |
| Cascade | 51 | $1,979 | $321.83 | 37% |
| Fort Benton | 10 | $1,752 | $150.32 | 43% |
| Great Falls | 162 | $1,626 | $142.41 | 46% |
| Havre | 11 | $949 | $115.12 | 35% |
| Meagher County | 14 | $609 | $121.05 | 29% |