Versailles Airbnb Market Analysis 2026: Short Term Rental Data & Vacation Rental Statistics in Missouri, United States
Is Airbnb profitable in Versailles in 2026? Explore comprehensive Airbnb analytics for Versailles, Missouri, United States to uncover income potential. This 2026 STR market report for Versailles, based on AirROI data from February 2025 to January 2026, reveals key trends in the niche market of 24 active listings.
Whether you're considering an Airbnb investment in Versailles, optimizing your existing vacation rental, or exploring rental arbitrage opportunities, understanding the Versailles Airbnb data is crucial. Leveraging the low regulation environment is key to maximizing your short term rental income potential. Let's dive into the specifics.
Key Versailles Airbnb Performance Metrics Overview
Monthly Airbnb Revenue Variations & Income Potential in Versailles (2026)
Understanding the monthly revenue variations for Airbnb listings in Versailles is key to maximizing your short term rental income potential. Seasonality significantly impacts earnings. Our analysis, based on data from the past 12 months, shows that the peak revenue month for STRs in Versailles is typically July, while February often presents the lowest earnings, highlighting opportunities for strategic pricing adjustments during shoulder and low seasons. Explore the typical Airbnb income in Versailles across different performance tiers:
- Best-in-class properties (Top 10%) achieve $7,992+ monthly, often utilizing dynamic pricing and superior guest experiences.
- Strong performing properties (Top 25%) earn $3,054 or more, indicating effective management and desirable locations/amenities.
- Typical properties (Median) generate around $1,835 per month, representing the average market performance.
- Entry-level properties (Bottom 25%) see earnings around $716, often with potential for optimization.
Average Monthly Airbnb Earnings Trend in Versailles
Versailles Airbnb Occupancy Rate Trends (2026)
Maximize your bookings by understanding the Versailles STR occupancy trends. Seasonal demand shifts significantly influence how often properties are booked. Typically, Julysees the highest demand (peak season occupancy), while January experiences the lowest (low season). Effective strategies, like adjusting minimum stays or offering promotions, can boost occupancy during slower periods. Here's how different property tiers perform in Versailles:
- Best-in-class properties (Top 10%) achieve 58%+ occupancy, indicating high desirability and potentially optimized availability.
- Strong performing properties (Top 25%) maintain 42% or higher occupancy, suggesting good market fit and guest satisfaction.
- Typical properties (Median) have an occupancy rate around 26%.
- Entry-level properties (Bottom 25%) average 15% occupancy, potentially facing higher vacancy.
Average Monthly Occupancy Rate Trend in Versailles
Average Daily Rate (ADR) Airbnb Trends in Versailles (2026)
Effective short term rental pricing strategy in Versailles involves understanding monthly ADR fluctuations. The Average Daily Rate (ADR) for Airbnb in Versailles typically peaks in July and dips lowest during February. Leveraging Airbnb dynamic pricing tools or strategies based on this seasonality can significantly boost revenue. Here's a look at the typical nightly rates achieved:
- Best-in-class properties (Top 10%) command rates of $563+ per night, often due to premium features or locations.
- Strong performing properties (Top 25%) achieve nightly rates of $254 or more.
- Typical properties (Median) charge around $183 per night.
- Entry-level properties (Bottom 25%) earn around $103 per night.
Average Daily Rate (ADR) Trend by Month in Versailles
Get Live Versailles Market Intelligence 👇

Explore Real-time Analytics
Airbnb Seasonality Analysis & Trends in Versailles (2026)
Peak Season (July, August, June)
- Revenue averages $5,636 per month
- Occupancy rates average 40.9%
- Daily rates average $318
Shoulder Season
- Revenue averages $2,567 per month
- Occupancy maintains around 29.0%
- Daily rates hold near $250
Low Season (February, March, April)
- Revenue drops to average $1,282 per month
- Occupancy decreases to average 24.5%
- Daily rates adjust to average $210
Seasonality Insights for Versailles
- The Airbnb seasonality in Versailles shows highly seasonal trends requiring careful strategy. While the sections above show seasonal averages, it's also insightful to look at the extremes:
- During the high season, the absolute peak month showcases Versailles's highest earning potential, with monthly revenues capable of climbing to $8,052, occupancy reaching a high of 49.5%, and ADRs peaking at $324.
- Conversely, the slowest single month of the year, typically falling within the low season, marks the market's lowest point. In this month, revenue might dip to $982, occupancy could drop to 19.0%, and ADRs may adjust down to $204.
- Understanding both the seasonal averages and these monthly peaks and troughs in revenue, occupancy, and ADR is crucial for maximizing your Airbnb profit potential in Versailles.
Seasonal Strategies for Maximizing Profit
- Peak Season: Maximize revenue through premium pricing and potentially longer minimum stays. Ensure high availability.
- Low Season: Offer competitive pricing, special promotions (e.g., extended stay discounts), and flexible cancellation policies. Target off-season travelers like remote workers or budget-conscious guests.
- Shoulder Seasons: Implement dynamic pricing that balances peak and low rates. Target weekend travelers or specific events. Offer slightly more flexible terms than peak season.
- Regularly analyze your own performance against these Versailles seasonality benchmarks and adjust your pricing and availability strategy accordingly.
Best Areas for Airbnb Investment in Versailles (2026)
Exploring the top neighborhoods for short-term rentals in Versailles? This section highlights key areas, outlining why they are attractive for hosts and guests, along with notable local attractions. Consider these locations based on your target guest profile and investment strategy.
| Neighborhood / Area | Why Host Here? (Target Guests & Appeal) | Key Attractions & Landmarks |
|---|---|---|
| Downtown Versailles | The heart of Versailles with easy access to local shops, restaurants, and parks. Ideal for guests looking for convenience and a small-town charm. | Historic Courthouse, Landmark Restaurant, Versailles City Park |
| Lake of the Ozarks | A major recreational destination offering a plethora of outdoor activities, making it popular among tourists and nature lovers. | Lake of the Ozarks State Park, Ha Ha Tonka State Park, Dockside Restaurant and Grill |
| The Truman Lake Area | A favorite spot for fishing, boating, and camping, attracting outdoor enthusiasts year-round. | Truman Lake, Truman State Park, Fishing access points |
| Versailles City Park | A family-friendly area with playgrounds and picnic spots, perfect for families traveling with children. | Picnic areas, Children's playground, Walking trails |
| Golden Beach | A serene, quiet area near the water, perfect for guests looking for relaxation and natural beauty. | Quiet beaches, Nature trails, Scenic views |
| Local Wineries | Versailles is close to several wineries, making it a great destination for wine lovers and tasting tours. | Consumer Wine Company, Tasting tours, Vineyard views |
| Historical District | Rich in history and architecture, this area is great for guests interested in local history and heritage. | Historic buildings, Local museums, Cultural festivals |
| Farmers Market Area | A vibrant neighborhood where locals gather, offering fresh produce and handmade goods. A great spot for experiencing local culture. | Versailles Farmers Market, Local crafts, Seasonal events |
Understanding Airbnb License Requirements & STR Laws in Versailles (2026)
While Versailles, Missouri, United States currently shows low STR regulations, specific Airbnb license requirements might still exist or change. Always verify the latest short term rental regulations and Airbnb license requirements directly with local government authorities for Versailles to ensure full compliance before hosting.
(Source: AirROI data, 2026, based on 4% licensed listings)
Top Performing Airbnb Properties in Versailles (2026)
Benchmark your potential! Explore examples of top-performing Airbnb properties in Versaillesbased on Trailing Twelve Month (TTM) revenue. Analyze their characteristics, revenue, occupancy rate, and ADR to understand what drives success in this market.
Luxury Home w/ Boat & PWC Slip, Ramp, & Pool Table
Entire Place • 6 bedrooms

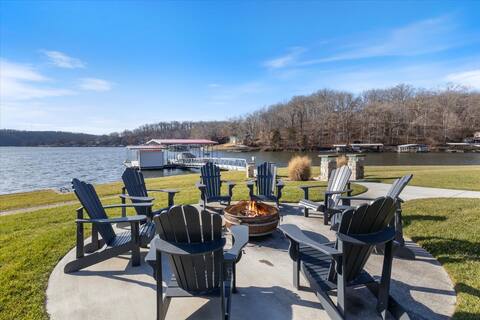
Huge Lakefront Yard, Private Dock - Amazing Views!
Entire Place • 6 bedrooms

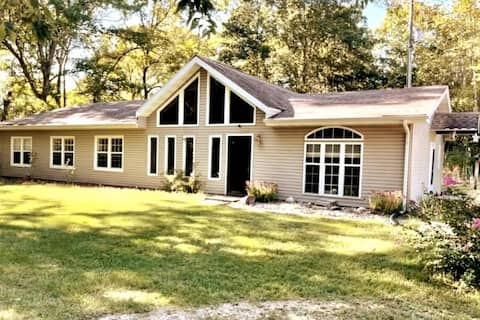
Pond Access & Fishing: 'Cedar Lodge' in Versailles
Entire Place • 4 bedrooms
The Loop Layover
Entire Place • 4 bedrooms
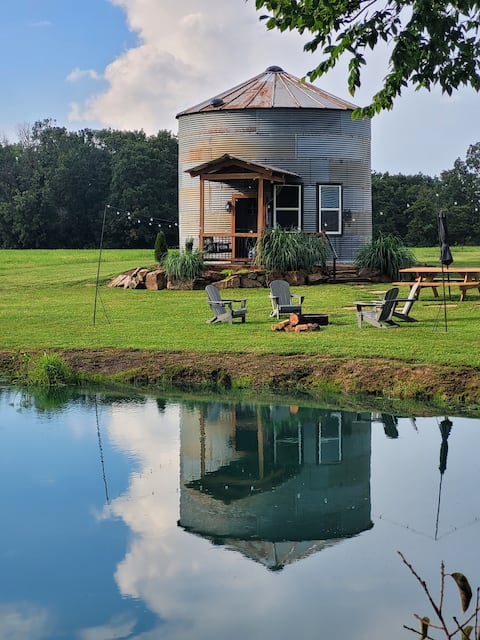
Cozy Cute Grain Bin Cabin, Highland Cows, Firepit
Entire Place • 1 bedroom

Cozy Cottage w/ Deck: Walk to Lake of the Ozarks!
Entire Place • 2 bedrooms
Note: Performance varies based on location, size, amenities, seasonality, and management quality. Data reflects the past 12 months.
Top Performing Airbnb Hosts in Versailles (2026)
Learn from the best! This table showcases top-performing Airbnb hosts in Versailles based on the number of properties managed and estimated total revenue over the past year. Analyze their scale and performance metrics.
| Host Name | Properties | Grossing Revenue | Stay Reviews | Avg Rating |
|---|---|---|---|---|
| Pamela Quinn | 2 | $274,460 | 26 | 4.90/5.0 |
| Evolve | 3 | $72,006 | 16 | 4.63/5.0 |
| Amanda | 2 | $57,053 | 202 | 4.99/5.0 |
| Carol | 1 | $35,949 | 40 | 4.93/5.0 |
| Henry | 2 | $24,122 | 47 | 4.84/5.0 |
| Abigail | 1 | $23,974 | 24 | 4.96/5.0 |
| Marlin And Grace | 2 | $23,905 | 42 | 4.86/5.0 |
| John | 1 | $20,067 | 92 | 5.00/5.0 |
| John | 2 | $19,852 | 5 | 4.67/5.0 |
| Kelci | 1 | $13,148 | 13 | 4.77/5.0 |
Analyzing the strategies of top hosts, such as their property selection, pricing, and guest communication, can offer valuable lessons for optimizing your own Airbnb operations in Versailles.
Dive Deeper: Advanced Versailles STR Market Data (2026)
Ready to unlock more insights? AirROI provides access to advanced metrics and comprehensive Airbnb data for Versailles. Explore detailed analytics beyond this report to refine your investment strategy, optimize pricing, and maximize your vacation rental profits.
Explore Advanced MetricsVersailles Short-Term Rental Market Composition (2026): Property & Room Types
Room Type Distribution
Property Type Distribution
Market Composition Insights for Versailles
- The Versailles Airbnb market composition is heavily skewed towards Entire Home/Apt listings, which make up 79.2% of the 24 active rentals. This indicates strong guest preference for privacy and space.
- Looking at the property type distribution in Versailles, House properties are the most common (54.2%), reflecting the local real estate landscape.
- Houses represent a significant 54.2% portion, catering likely to families or larger groups.
- The presence of 12.5% Hotel/Boutique listings indicates integration with traditional hospitality.
- Smaller segments like unique stays (combined 4.2%) offer potential for unique stay experiences.
Versailles Airbnb Room Capacity Analysis (2026): Bedroom Distribution
Distribution of Listings by Number of Bedrooms
Room Capacity Insights for Versailles
- The dominant room capacity in Versailles is 1 bedroom listings, making up 29.2% of the market. This suggests a strong demand for properties suitable for couples or solo travelers.
- Together, 1 bedroom and 2 bedrooms properties represent 54.2% of the active Airbnb listings in Versailles, indicating a high concentration in these sizes.
- A significant 37.5% of listings offer 3+ bedrooms, catering to larger groups and families seeking more space in Versailles.
Versailles Vacation Rental Guest Capacity Trends (2026)
Distribution of Listings by Guest Capacity
Guest Capacity Insights for Versailles
- The most common guest capacity trend in Versailles vacation rentals is listings accommodating 8+ guests (29.2%). This suggests the primary traveler segment is likely larger groups.
- Properties designed for 8+ guests and 6 guests dominate the Versailles STR market, accounting for 50.0% of listings.
- 58.3% of properties accommodate 6+ guests, serving the market segment for larger families or group travel in Versailles.
- On average, properties in Versailles are equipped to host 5.2 guests.
Versailles Airbnb Booking Patterns (2026): Available vs. Booked Days
Available Days Distribution
Booked Days Distribution
Booking Pattern Insights for Versailles
- The most common availability pattern in Versailles falls within the 271-366 days range, representing 66.7% of listings. This suggests many properties have significant open periods on their calendars.
- Approximately 95.9% of listings show high availability (181+ days open annually), indicating potential for increased bookings or specific owner usage patterns.
- For booked days, the 31-90 days range is most frequent in Versailles (45.8%), reflecting common guest stay durations or potential owner blocking patterns.
- A notable 4.2% of properties secure long booking periods (181+ days booked per year), highlighting successful long-term rental strategies or significant owner usage.
Versailles Airbnb Minimum Stay Requirements Analysis
Distribution of Listings by Minimum Night Requirement
1 Night
11 listings
45.8% of total
2 Nights
9 listings
37.5% of total
30+ Nights
4 listings
16.7% of total
Key Insights
- The most prevalent minimum stay requirement in Versailles is 1 Night, adopted by 45.8% of listings. This highlights the market's preference for shorter, flexible bookings.
- A strong majority (83.3%) of the Versailles Airbnb data shows acceptance of very short stays (1-2 nights), indicating a dynamic, high-turnover market.
- A significant segment (16.7%) caters to monthly stays (30+ nights) in Versailles, pointing to opportunities in the extended-stay market.
Recommendations
- Align with the market by considering a 1 Night minimum stay, as 45.8% of Versailles hosts use this setting.
- Explore offering discounts for stays of 30+ nights to attract the 16.7% of the market seeking extended stays.
- Adjust minimum nights based on seasonality – potentially shorter during low season and longer during peak demand periods in Versailles.
Versailles Airbnb Cancellation Policy Trends Analysis (2026)
Super Strict 30 Days
1 listings
4.2% of total
Flexible
3 listings
12.5% of total
Moderate
4 listings
16.7% of total
Firm
13 listings
54.2% of total
Strict
3 listings
12.5% of total
Cancellation Policy Insights for Versailles
- The prevailing Airbnb cancellation policy trend in Versailles is Firm, used by 54.2% of listings.
- A majority (66.7%) of hosts in Versailles utilize Firm or Strict policies, indicating a market where hosts prioritize booking security.
Recommendations for Hosts
- Consider adopting a Firm policy to align with the 54.2% market standard in Versailles.
- Using a Strict policy might deter some guests, as only 12.5% of listings use it. Evaluate if potential revenue protection outweighs possible lower booking rates.
- Regularly review your cancellation policy against competitors and market demand shifts in Versailles.
Versailles STR Booking Lead Time Analysis (2026)
Average Booking Lead Time by Month
Booking Lead Time Insights for Versailles
- The overall average booking lead time for vacation rentals in Versailles is 31 days.
- Guests book furthest in advance for stays during November (average 48 days), likely coinciding with peak travel demand or local events.
- The shortest booking windows occur for stays in March (average 17 days), indicating more last-minute travel plans during this time.
- Seasonally, Fall (40 days avg.) sees the longest lead times, while Winter (25 days avg.) has the shortest, reflecting typical travel planning cycles.
Recommendations for Hosts
- Use the overall average lead time (31 days) as a baseline for your pricing and availability strategy in Versailles.
- For November stays, consider implementing length-of-stay discounts or slightly higher rates for bookings made less than 48 days out to capitalize on advance planning.
- Target marketing efforts for the Fall season well in advance (at least 40 days) to capture early planners.
- Monitor your own booking lead times against these Versailles averages to identify opportunities for dynamic pricing adjustments.
Popular & Essential Airbnb Amenities in Versailles (2026)
Amenity Prevalence
Amenity Insights for Versailles
- Essential amenities in Versailles that guests expect include: Smoke alarm, Free parking on premises, Hot water. Lacking these (any) could significantly impact bookings.
- Popular amenities like Heating, First aid kit, Air conditioning are common but not universal. Offering these can provide a competitive edge.
- Warning: Wifi is not universally provided but is considered essential globally. Ensure reliable Wifi is offered.
Recommendations for Hosts
- Ensure your listing includes all essential amenities for Versailles: Smoke alarm, Free parking on premises, Hot water.
- Prioritize adding missing essentials: Hot water.
- Consider adding popular differentiators like Heating or First aid kit to increase appeal.
- Highlight unique or less common amenities you offer (e.g., hot tub, dedicated workspace, EV charger) in your listing description and photos.
- Regularly check competitor amenities in Versailles to stay competitive.
Versailles Airbnb Guest Demographics & Profile Analysis (2026)
Guest Profile Summary for Versailles
- The typical guest profile for Airbnb in Versailles consists of primarily domestic travelers (99%), often arriving from nearby St. Louis, typically belonging to the Post-2000s (Gen Z/Alpha) group (50%), primarily speaking English or Spanish.
- Domestic travelers account for 99.2% of guests.
- Key international markets include United States (99.2%) and Egypt (0.8%).
- Top languages spoken are English (88.2%) followed by Spanish (7.8%).
- A significant demographic segment is the Post-2000s (Gen Z/Alpha) group, representing 50% of guests.
Recommendations for Hosts
- Target domestic marketing efforts towards travelers from St. Louis and Pleasant Hill.
- Tailor amenities and listing descriptions to appeal to the dominant Post-2000s (Gen Z/Alpha) demographic (e.g., highlight fast WiFi, smart home features, local guides).
- Highlight unique local experiences or amenities relevant to the primary guest profile.
- Consider seasonal promotions aligned with peak travel times for key origin markets.
Nearby Short-Term Rental Market Comparison
How does the Versailles Airbnb market stack up against its neighbors? Compare key performance metrics like average monthly revenue, ADR, and occupancy rates in surrounding areas to understand the broader regional STR landscape.
| Market | Active Properties | Monthly Revenue | Daily Rate | Avg. Occupancy |
|---|---|---|---|---|
| Wright City | 13 | $4,135 | $455.44 | 37% |
| Innsbrook | 199 | $4,100 | $422.60 | 35% |
| Linn Creek | 28 | $3,665 | $404.65 | 37% |
| Sunrise Beach | 279 | $3,450 | $473.67 | 38% |
| Greenview | 11 | $3,219 | $428.61 | 42% |
| Gravois Mills | 133 | $2,984 | $395.30 | 37% |
| Friedenswald | 12 | $2,948 | $294.85 | 38% |
| Climax Springs | 32 | $2,826 | $398.65 | 33% |
| Roach | 27 | $2,741 | $376.61 | 42% |
| Rocheport | 20 | $2,716 | $349.48 | 36% |