Roach Airbnb Market Analysis 2026: Short Term Rental Data & Vacation Rental Statistics in Missouri, United States
Is Airbnb profitable in Roach in 2026? Explore comprehensive Airbnb analytics for Roach, Missouri, United States to uncover income potential. This 2026 STR market report for Roach, based on AirROI data from February 2025 to January 2026, reveals key trends in the niche market of 27 active listings.
Whether you're considering an Airbnb investment in Roach, optimizing your existing vacation rental, or exploring rental arbitrage opportunities, understanding the Roach Airbnb data is crucial. Leveraging the low regulation environment is key to maximizing your short term rental income potential. Let's dive into the specifics.
Key Roach Airbnb Performance Metrics Overview
Monthly Airbnb Revenue Variations & Income Potential in Roach (2026)
Understanding the monthly revenue variations for Airbnb listings in Roach is key to maximizing your short term rental income potential. Seasonality significantly impacts earnings. Our analysis, based on data from the past 12 months, shows that the peak revenue month for STRs in Roach is typically July, while January often presents the lowest earnings, highlighting opportunities for strategic pricing adjustments during shoulder and low seasons. Explore the typical Airbnb income in Roach across different performance tiers:
- Best-in-class properties (Top 10%) achieve $8,193+ monthly, often utilizing dynamic pricing and superior guest experiences.
- Strong performing properties (Top 25%) earn $4,672 or more, indicating effective management and desirable locations/amenities.
- Typical properties (Median) generate around $2,920 per month, representing the average market performance.
- Entry-level properties (Bottom 25%) see earnings around $1,395, often with potential for optimization.
Average Monthly Airbnb Earnings Trend in Roach
Roach Airbnb Occupancy Rate Trends (2026)
Maximize your bookings by understanding the Roach STR occupancy trends. Seasonal demand shifts significantly influence how often properties are booked. Typically, Julysees the highest demand (peak season occupancy), while January experiences the lowest (low season). Effective strategies, like adjusting minimum stays or offering promotions, can boost occupancy during slower periods. Here's how different property tiers perform in Roach:
- Best-in-class properties (Top 10%) achieve 67%+ occupancy, indicating high desirability and potentially optimized availability.
- Strong performing properties (Top 25%) maintain 50% or higher occupancy, suggesting good market fit and guest satisfaction.
- Typical properties (Median) have an occupancy rate around 34%.
- Entry-level properties (Bottom 25%) average 19% occupancy, potentially facing higher vacancy.
Average Monthly Occupancy Rate Trend in Roach
Average Daily Rate (ADR) Airbnb Trends in Roach (2026)
Effective short term rental pricing strategy in Roach involves understanding monthly ADR fluctuations. The Average Daily Rate (ADR) for Airbnb in Roach typically peaks in September and dips lowest during February. Leveraging Airbnb dynamic pricing tools or strategies based on this seasonality can significantly boost revenue. Here's a look at the typical nightly rates achieved:
- Best-in-class properties (Top 10%) command rates of $671+ per night, often due to premium features or locations.
- Strong performing properties (Top 25%) achieve nightly rates of $467 or more.
- Typical properties (Median) charge around $302 per night.
- Entry-level properties (Bottom 25%) earn around $209 per night.
Average Daily Rate (ADR) Trend by Month in Roach
Get Live Roach Market Intelligence 👇

Explore Real-time Analytics
Airbnb Seasonality Analysis & Trends in Roach (2026)
Peak Season (July, August, June)
- Revenue averages $7,060 per month
- Occupancy rates average 59.2%
- Daily rates average $376
Shoulder Season
- Revenue averages $3,035 per month
- Occupancy maintains around 29.9%
- Daily rates hold near $357
Low Season (January, February, November)
- Revenue drops to average $1,818 per month
- Occupancy decreases to average 25.0%
- Daily rates adjust to average $355
Seasonality Insights for Roach
- The Airbnb seasonality in Roach shows highly seasonal trends requiring careful strategy. While the sections above show seasonal averages, it's also insightful to look at the extremes:
- During the high season, the absolute peak month showcases Roach's highest earning potential, with monthly revenues capable of climbing to $8,106, occupancy reaching a high of 66.2%, and ADRs peaking at $392.
- Conversely, the slowest single month of the year, typically falling within the low season, marks the market's lowest point. In this month, revenue might dip to $1,343, occupancy could drop to 19.9%, and ADRs may adjust down to $314.
- Understanding both the seasonal averages and these monthly peaks and troughs in revenue, occupancy, and ADR is crucial for maximizing your Airbnb profit potential in Roach.
Seasonal Strategies for Maximizing Profit
- Peak Season: Maximize revenue through premium pricing and potentially longer minimum stays. Ensure high availability.
- Low Season: Offer competitive pricing, special promotions (e.g., extended stay discounts), and flexible cancellation policies. Target off-season travelers like remote workers or budget-conscious guests.
- Shoulder Seasons: Implement dynamic pricing that balances peak and low rates. Target weekend travelers or specific events. Offer slightly more flexible terms than peak season.
- Regularly analyze your own performance against these Roach seasonality benchmarks and adjust your pricing and availability strategy accordingly.
Best Areas for Airbnb Investment in Roach (2026)
Exploring the top neighborhoods for short-term rentals in Roach? This section highlights key areas, outlining why they are attractive for hosts and guests, along with notable local attractions. Consider these locations based on your target guest profile and investment strategy.
| Neighborhood / Area | Why Host Here? (Target Guests & Appeal) | Key Attractions & Landmarks |
|---|---|---|
| Lake of the Ozarks | A popular vacation destination known for its beautiful lakes, outdoor activities, and vibrant nightlife. It attracts both families and young adults looking for leisure and adventure. | Lake of the Ozarks State Park, Party Cove, Bagnell Dam, Osage Beach, Camden on the Lake Resort, Bear Bottom Resort |
| Branson | Famous for its live entertainment, theme parks, and outdoor attractions. Branson attracts millions of tourists each year, making it a prime area for short-term rentals. | Silver Dollar City, Branson Landing, Table Rock Lake, Branson Strip, Dolly Parton's Stampede, Artisan's Park |
| Camdenton | A charming town located near the Lake of the Ozarks, offering a more relaxed atmosphere with access to beautiful scenery and recreational activities. | Ha Ha Tonka State Park, Camdenton City Park, Lakeview Resort, Ozarks Amphitheater, Bridal Cave |
| Osage Beach | This area is a commercial hub near Lake of the Ozarks with shopping, dining, and a range of recreational activities, making it appealing to tourists. | Osage Beach Premium Outlets, Dogwood Hills Golf Club, Lake of the Ozarks, Main Street Music Hall |
| Lebanon | A gateway to outdoor adventures and the nearby Ozarks. It offers a mix of history and modern amenities, making it a good spot for visitors. | NRA National Sporting Arms Museum, Route 66 Museum, Cowan Civic Center, Laclede County Historical Society |
| Eldon | A small town with access to Lake of the Ozarks, Eldon has a friendly community feel and is close to many attractions. | Eldon Historical Museum, Eldon Sports Complex, Lake of the Ozarks |
| Sandy Creek | A tranquil area near recreational opportunities and the scenic beauty of the Ozarks, attracting nature lovers and outdoor enthusiasts. | Sandy Creek Golf Course, Close proximity to fishing and hiking spots |
| Four Seasons | An upscale residential community located on the Lake of the Ozarks with luxury homes and proximity to amenities, appealing to visitors looking for a more luxurious stay. | Lake of the Ozarks, Golf clubs, Boat rentals, Access to fine dining |
Understanding Airbnb License Requirements & STR Laws in Roach (2026)
While Roach, Missouri, United States currently shows low STR regulations, specific Airbnb license requirements might still exist or change. Always verify the latest short term rental regulations and Airbnb license requirements directly with local government authorities for Roach to ensure full compliance before hosting.
(Source: AirROI data, 2026, finding no licensed listings among those analyzed)
Top Performing Airbnb Properties in Roach (2026)
Benchmark your potential! Explore examples of top-performing Airbnb properties in Roachbased on Trailing Twelve Month (TTM) revenue. Analyze their characteristics, revenue, occupancy rate, and ADR to understand what drives success in this market.
Niangua Lodge - Lakefront Resort
Entire Place • 6 bedrooms

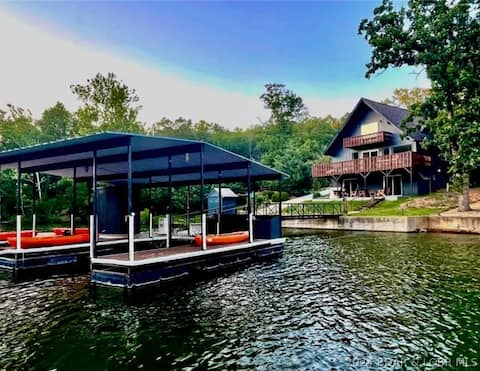
Lake of the Ozarks Haven w/ Decks, Dock & Kayaks!
Entire Place • 5 bedrooms
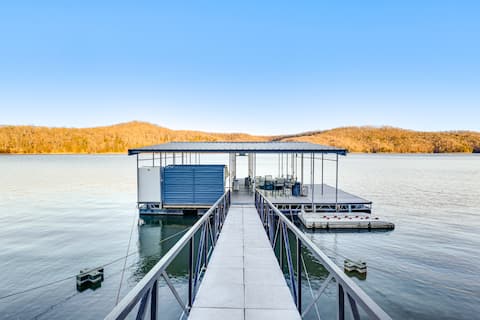
! Remote & Relaxing Lake of the Ozarks Getaway
Entire Place • 5 bedrooms
Private Cove and Lakeside Paradise "Cedar Cove"
Entire Place • 5 bedrooms
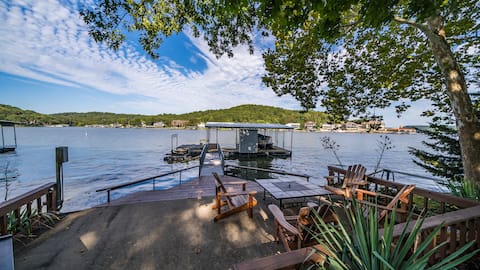
Waterfront Lake of the Ozarks Home w/ Private Dock
Entire Place • 4 bedrooms
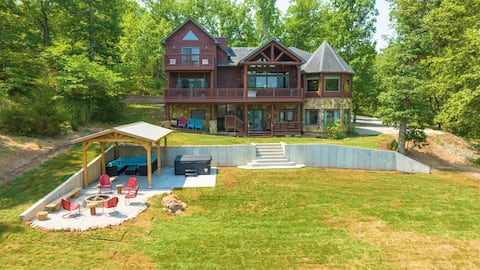
New Custom Home with Breathtaking Views!
Entire Place • 3 bedrooms
Note: Performance varies based on location, size, amenities, seasonality, and management quality. Data reflects the past 12 months.
Top Performing Airbnb Hosts in Roach (2026)
Learn from the best! This table showcases top-performing Airbnb hosts in Roach based on the number of properties managed and estimated total revenue over the past year. Analyze their scale and performance metrics.
| Host Name | Properties | Grossing Revenue | Stay Reviews | Avg Rating |
|---|---|---|---|---|
| Evolve | 5 | $168,074 | 57 | 4.78/5.0 |
| Sandra | 1 | $118,415 | 25 | 4.96/5.0 |
| Pamela Quinn | 2 | $57,426 | 23 | 4.38/5.0 |
| Jeremy | 1 | $57,127 | 79 | 4.95/5.0 |
| Jodi | 1 | $49,294 | 14 | 4.93/5.0 |
| Riche And Anna | 1 | $41,676 | 21 | 4.76/5.0 |
| Ryan | 1 | $40,630 | 79 | 4.94/5.0 |
| Brenda | 1 | $40,432 | 39 | 4.97/5.0 |
| Evolve | 1 | $38,517 | 20 | 4.90/5.0 |
| Lisa | 1 | $34,199 | 85 | 4.92/5.0 |
Analyzing the strategies of top hosts, such as their property selection, pricing, and guest communication, can offer valuable lessons for optimizing your own Airbnb operations in Roach.
Dive Deeper: Advanced Roach STR Market Data (2026)
Ready to unlock more insights? AirROI provides access to advanced metrics and comprehensive Airbnb data for Roach. Explore detailed analytics beyond this report to refine your investment strategy, optimize pricing, and maximize your vacation rental profits.
Explore Advanced MetricsRoach Short-Term Rental Market Composition (2026): Property & Room Types
Room Type Distribution
Property Type Distribution
Market Composition Insights for Roach
- The Roach Airbnb market composition is heavily skewed towards Entire Home/Apt listings, which make up 100% of the 27 active rentals. This indicates strong guest preference for privacy and space.
- Looking at the property type distribution in Roach, House properties are the most common (77.8%), reflecting the local real estate landscape.
- Houses represent a significant 77.8% portion, catering likely to families or larger groups.
- Smaller segments like hotel/boutique (combined 3.7%) offer potential for unique stay experiences.
Roach Airbnb Room Capacity Analysis (2026): Bedroom Distribution
Distribution of Listings by Number of Bedrooms
Room Capacity Insights for Roach
- The dominant room capacity in Roach is 4 bedrooms listings, making up 29.6% of the market. This suggests a strong demand for properties suitable for families or small groups.
- Together, 4 bedrooms and 3 bedrooms properties represent 55.5% of the active Airbnb listings in Roach, indicating a high concentration in these sizes.
- A significant 81.4% of listings offer 3+ bedrooms, catering to larger groups and families seeking more space in Roach.
Roach Vacation Rental Guest Capacity Trends (2026)
Distribution of Listings by Guest Capacity
Guest Capacity Insights for Roach
- The most common guest capacity trend in Roach vacation rentals is listings accommodating 8+ guests (70.4%). This suggests the primary traveler segment is likely larger groups.
- Properties designed for 8+ guests and 6 guests dominate the Roach STR market, accounting for 85.2% of listings.
- 88.9% of properties accommodate 6+ guests, serving the market segment for larger families or group travel in Roach.
- On average, properties in Roach are equipped to host 7.2 guests.
Roach Airbnb Booking Patterns (2026): Available vs. Booked Days
Available Days Distribution
Booked Days Distribution
Booking Pattern Insights for Roach
- The most common availability pattern in Roach falls within the 271-366 days range, representing 59.3% of listings. This suggests many properties have significant open periods on their calendars.
- Approximately 96.3% of listings show high availability (181+ days open annually), indicating potential for increased bookings or specific owner usage patterns.
- For booked days, the 31-90 days range is most frequent in Roach (48.1%), reflecting common guest stay durations or potential owner blocking patterns.
- A notable 3.7% of properties secure long booking periods (181+ days booked per year), highlighting successful long-term rental strategies or significant owner usage.
Roach Airbnb Minimum Stay Requirements Analysis
Distribution of Listings by Minimum Night Requirement
1 Night
2 listings
7.4% of total
2 Nights
10 listings
37% of total
3 Nights
4 listings
14.8% of total
4-6 Nights
2 listings
7.4% of total
30+ Nights
9 listings
33.3% of total
Key Insights
- The most prevalent minimum stay requirement in Roach is 2 Nights, adopted by 37% of listings. This highlights the market's preference for shorter, flexible bookings.
- A significant segment (33.3%) caters to monthly stays (30+ nights) in Roach, pointing to opportunities in the extended-stay market.
Recommendations
- Align with the market by considering a 2 Nights minimum stay, as 37% of Roach hosts use this setting.
- If feasible, allowing 1-night stays, especially midweek or during low season, could capture last-minute bookings, as only 7.4% currently do.
- A 2-night minimum appears standard (37%). Consider this for weekends or peak periods.
- Explore offering discounts for stays of 30+ nights to attract the 33.3% of the market seeking extended stays.
- Adjust minimum nights based on seasonality – potentially shorter during low season and longer during peak demand periods in Roach.
Roach Airbnb Cancellation Policy Trends Analysis (2026)
Super Strict 30 Days
2 listings
7.4% of total
Flexible
2 listings
7.4% of total
Moderate
6 listings
22.2% of total
Firm
9 listings
33.3% of total
Strict
8 listings
29.6% of total
Cancellation Policy Insights for Roach
- The prevailing Airbnb cancellation policy trend in Roach is Firm, used by 33.3% of listings.
- A majority (62.9%) of hosts in Roach utilize Firm or Strict policies, indicating a market where hosts prioritize booking security.
Recommendations for Hosts
- Consider adopting a Firm policy to align with the 33.3% market standard in Roach.
- Regularly review your cancellation policy against competitors and market demand shifts in Roach.
Roach STR Booking Lead Time Analysis (2026)
Average Booking Lead Time by Month
Booking Lead Time Insights for Roach
- The overall average booking lead time for vacation rentals in Roach is 80 days.
- Guests book furthest in advance for stays during June (average 137 days), likely coinciding with peak travel demand or local events.
- The shortest booking windows occur for stays in February (average 5 days), indicating more last-minute travel plans during this time.
- Seasonally, Summer (115 days avg.) sees the longest lead times, while Winter (20 days avg.) has the shortest, reflecting typical travel planning cycles.
Recommendations for Hosts
- Use the overall average lead time (80 days) as a baseline for your pricing and availability strategy in Roach.
- For June stays, consider implementing length-of-stay discounts or slightly higher rates for bookings made less than 137 days out to capitalize on advance planning.
- During February, focus on last-minute booking availability and promotions, as guests book with very short notice (5 days avg.).
- Target marketing efforts for the Summer season well in advance (at least 115 days) to capture early planners.
- Monitor your own booking lead times against these Roach averages to identify opportunities for dynamic pricing adjustments.
Popular & Essential Airbnb Amenities in Roach (2026)
Amenity Prevalence
Amenity Insights for Roach
- Essential amenities in Roach that guests expect include: Essentials, Smoke alarm, TV, Heating, Hot water, Air conditioning, Free parking on premises, Fire extinguisher, Microwave, Kitchen. Lacking these (any) could significantly impact bookings.
Recommendations for Hosts
- Ensure your listing includes all essential amenities for Roach: Essentials, Smoke alarm, TV, Heating, Hot water, Air conditioning, Free parking on premises, Fire extinguisher, Microwave, Kitchen.
- Prioritize adding missing essentials: Fire extinguisher, Microwave, Kitchen.
- Highlight unique or less common amenities you offer (e.g., hot tub, dedicated workspace, EV charger) in your listing description and photos.
- Regularly check competitor amenities in Roach to stay competitive.
Roach Airbnb Guest Demographics & Profile Analysis (2026)
Guest Profile Summary for Roach
- The typical guest profile for Airbnb in Roach consists of primarily domestic travelers (97%), often arriving from nearby Kansas City, typically belonging to the Post-2000s (Gen Z/Alpha) group (50%), primarily speaking English or Spanish.
- Domestic travelers account for 97.2% of guests.
- Key international markets include United States (97.2%) and United Kingdom (0.9%).
- Top languages spoken are English (88.5%) followed by Spanish (3.3%).
- A significant demographic segment is the Post-2000s (Gen Z/Alpha) group, representing 50% of guests.
Recommendations for Hosts
- Target domestic marketing efforts towards travelers from Kansas City and Fairfield.
- Tailor amenities and listing descriptions to appeal to the dominant Post-2000s (Gen Z/Alpha) demographic (e.g., highlight fast WiFi, smart home features, local guides).
- Highlight unique local experiences or amenities relevant to the primary guest profile.
- Consider seasonal promotions aligned with peak travel times for key origin markets.
Nearby Short-Term Rental Market Comparison
How does the Roach Airbnb market stack up against its neighbors? Compare key performance metrics like average monthly revenue, ADR, and occupancy rates in surrounding areas to understand the broader regional STR landscape.
| Market | Active Properties | Monthly Revenue | Daily Rate | Avg. Occupancy |
|---|---|---|---|---|
| Wright City | 13 | $4,135 | $455.44 | 37% |
| Innsbrook | 199 | $4,100 | $422.60 | 35% |
| Linn Creek | 28 | $3,665 | $404.65 | 37% |
| Sunrise Beach | 279 | $3,450 | $473.67 | 38% |
| Greenview | 11 | $3,219 | $428.61 | 42% |
| Gravois Mills | 133 | $2,984 | $395.30 | 37% |
| Friedenswald | 12 | $2,948 | $294.85 | 38% |
| Climax Springs | 32 | $2,826 | $398.65 | 33% |
| Rocheport | 20 | $2,716 | $349.48 | 36% |
| Rocky Mount | 112 | $2,458 | $370.82 | 34% |