Pacific Airbnb Market Analysis 2026: Short Term Rental Data & Vacation Rental Statistics in Missouri, United States
Is Airbnb profitable in Pacific in 2026? Explore comprehensive Airbnb analytics for Pacific, Missouri, United States to uncover income potential. This 2026 STR market report for Pacific, based on AirROI data from February 2025 to January 2026, reveals key trends in the niche market of 35 active listings.
Whether you're considering an Airbnb investment in Pacific, optimizing your existing vacation rental, or exploring rental arbitrage opportunities, understanding the Pacific Airbnb data is crucial. Leveraging the low regulation environment is key to maximizing your short term rental income potential. Let's dive into the specifics.
Key Pacific Airbnb Performance Metrics Overview
Monthly Airbnb Revenue Variations & Income Potential in Pacific (2026)
Understanding the monthly revenue variations for Airbnb listings in Pacific is key to maximizing your short term rental income potential. Seasonality significantly impacts earnings. Our analysis, based on data from the past 12 months, shows that the peak revenue month for STRs in Pacific is typically June, while January often presents the lowest earnings, highlighting opportunities for strategic pricing adjustments during shoulder and low seasons. Explore the typical Airbnb income in Pacific across different performance tiers:
- Best-in-class properties (Top 10%) achieve $3,496+ monthly, often utilizing dynamic pricing and superior guest experiences.
- Strong performing properties (Top 25%) earn $2,172 or more, indicating effective management and desirable locations/amenities.
- Typical properties (Median) generate around $1,165 per month, representing the average market performance.
- Entry-level properties (Bottom 25%) see earnings around $685, often with potential for optimization.
Average Monthly Airbnb Earnings Trend in Pacific
Pacific Airbnb Occupancy Rate Trends (2026)
Maximize your bookings by understanding the Pacific STR occupancy trends. Seasonal demand shifts significantly influence how often properties are booked. Typically, Junesees the highest demand (peak season occupancy), while January experiences the lowest (low season). Effective strategies, like adjusting minimum stays or offering promotions, can boost occupancy during slower periods. Here's how different property tiers perform in Pacific:
- Best-in-class properties (Top 10%) achieve 61%+ occupancy, indicating high desirability and potentially optimized availability.
- Strong performing properties (Top 25%) maintain 42% or higher occupancy, suggesting good market fit and guest satisfaction.
- Typical properties (Median) have an occupancy rate around 22%.
- Entry-level properties (Bottom 25%) average 13% occupancy, potentially facing higher vacancy.
Average Monthly Occupancy Rate Trend in Pacific
Average Daily Rate (ADR) Airbnb Trends in Pacific (2026)
Effective short term rental pricing strategy in Pacific involves understanding monthly ADR fluctuations. The Average Daily Rate (ADR) for Airbnb in Pacific typically peaks in January and dips lowest during March. Leveraging Airbnb dynamic pricing tools or strategies based on this seasonality can significantly boost revenue. Here's a look at the typical nightly rates achieved:
- Best-in-class properties (Top 10%) command rates of $298+ per night, often due to premium features or locations.
- Strong performing properties (Top 25%) achieve nightly rates of $239 or more.
- Typical properties (Median) charge around $177 per night.
- Entry-level properties (Bottom 25%) earn around $127 per night.
Average Daily Rate (ADR) Trend by Month in Pacific
Get Live Pacific Market Intelligence 👇

Explore Real-time Analytics
Airbnb Seasonality Analysis & Trends in Pacific (2026)
Peak Season (June, August, May)
- Revenue averages $2,244 per month
- Occupancy rates average 37.6%
- Daily rates average $200
Shoulder Season
- Revenue averages $1,635 per month
- Occupancy maintains around 30.2%
- Daily rates hold near $190
Low Season (January, February, November)
- Revenue drops to average $1,047 per month
- Occupancy decreases to average 19.6%
- Daily rates adjust to average $193
Seasonality Insights for Pacific
- The Airbnb seasonality in Pacific shows highly seasonal trends requiring careful strategy. While the sections above show seasonal averages, it's also insightful to look at the extremes:
- During the high season, the absolute peak month showcases Pacific's highest earning potential, with monthly revenues capable of climbing to $2,345, occupancy reaching a high of 39.0%, and ADRs peaking at $205.
- Conversely, the slowest single month of the year, typically falling within the low season, marks the market's lowest point. In this month, revenue might dip to $971, occupancy could drop to 18.7%, and ADRs may adjust down to $171.
- Understanding both the seasonal averages and these monthly peaks and troughs in revenue, occupancy, and ADR is crucial for maximizing your Airbnb profit potential in Pacific.
Seasonal Strategies for Maximizing Profit
- Peak Season: Maximize revenue through premium pricing and potentially longer minimum stays. Ensure high availability.
- Low Season: Offer competitive pricing, special promotions (e.g., extended stay discounts), and flexible cancellation policies. Target off-season travelers like remote workers or budget-conscious guests.
- Shoulder Seasons: Implement dynamic pricing that balances peak and low rates. Target weekend travelers or specific events. Offer slightly more flexible terms than peak season.
- Regularly analyze your own performance against these Pacific seasonality benchmarks and adjust your pricing and availability strategy accordingly.
Best Areas for Airbnb Investment in Pacific (2026)
Exploring the top neighborhoods for short-term rentals in Pacific? This section highlights key areas, outlining why they are attractive for hosts and guests, along with notable local attractions. Consider these locations based on your target guest profile and investment strategy.
| Neighborhood / Area | Why Host Here? (Target Guests & Appeal) | Key Attractions & Landmarks |
|---|---|---|
| Historic Downtown Pacific | Charming area with historic buildings and a small-town feel. Great for visitors looking for a quaint experience close to local shops and restaurants. | Pacific Railroad Depot, Ochs' Brewery, Meramec Greenway, Wabash Frisco and Pacific Railroad Museum |
| Great River Greenway | Scenic area along the river, perfect for outdoor enthusiasts. Attracts families and nature lovers with its trails and parks. | Riverfront Park, Greenway Trail, Camping in the park, Fishing spots |
| Meramec State Park | A natural paradise with camping, hiking, and access to the Meramec River. Ideal for guests seeking outdoor adventures and tranquility. | Caves in the park, Hiking trails, Fishing and canoeing, Campgrounds, Nature watching |
| Pacific City Park | A community gathering spot with playgrounds and green spaces. Family-friendly and near local eateries, perfect for family vacations. | Playgrounds, Picnic areas, Walking trails, Local events |
| West Pacific | Quiet, residential district with easy access to amenities. Attractive for guests seeking a restful stay away from the busier tourism spots. | Local dining options, Grocery stores, Residential parks |
| East Pacific | Growing suburban area with new developments. Popular among families and those looking for longer-term stays in a peaceful environment. | Family-friendly parks, Shopping centers, Future development projects |
| Highway 44 Corridor | Convenient access to major highways for travelers. A strategic place for those who are visiting nearby attractions or commuting. | Convenient access to I-44, Nearby gas stations, Various diners and fast food options |
| Local Winemaking Area | This region is known for its local wineries and vineyards, attracting wine lovers and those seeking unique experiences in Missouri. | Local wineries, Tasting tours, Wine festivals, Scenic vineyard views |
Understanding Airbnb License Requirements & STR Laws in Pacific (2026)
While Pacific, Missouri, United States currently shows low STR regulations, specific Airbnb license requirements might still exist or change. Always verify the latest short term rental regulations and Airbnb license requirements directly with local government authorities for Pacific to ensure full compliance before hosting.
(Source: AirROI data, 2026, finding no licensed listings among those analyzed)
Top Performing Airbnb Properties in Pacific (2026)
Benchmark your potential! Explore examples of top-performing Airbnb properties in Pacificbased on Trailing Twelve Month (TTM) revenue. Analyze their characteristics, revenue, occupancy rate, and ADR to understand what drives success in this market.
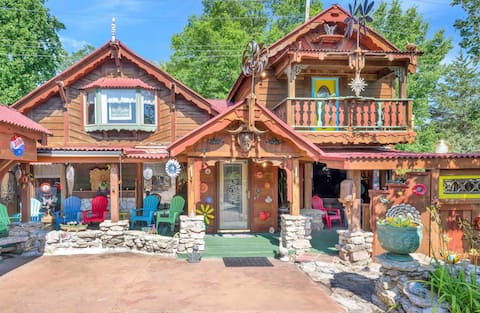
Pacific Palace, super unique!
Entire Place • 3 bedrooms
Pet Friendly - Fenced Yard - No Cleaning Fee
Entire Place • 2 bedrooms
Close to Purina - Fully Fenced - No Cleaning Fee
Entire Place • 1 bedroom

Dog Friendly - Close to Purina - No Cleaning Fee
Entire Place • 2 bedrooms

Miami Beach themed suite for 10 with pool.
Entire Place • 2 bedrooms

Renovated home near Six Flags on quiet street
Entire Place • 3 bedrooms
Note: Performance varies based on location, size, amenities, seasonality, and management quality. Data reflects the past 12 months.
Top Performing Airbnb Hosts in Pacific (2026)
Learn from the best! This table showcases top-performing Airbnb hosts in Pacific based on the number of properties managed and estimated total revenue over the past year. Analyze their scale and performance metrics.
| Host Name | Properties | Grossing Revenue | Stay Reviews | Avg Rating |
|---|---|---|---|---|
| Jennifer | 15 | $167,839 | 749 | 4.84/5.0 |
| Christopher | 3 | $124,694 | 218 | 4.94/5.0 |
| Brian | 1 | $62,664 | 203 | 4.91/5.0 |
| Shane | 3 | $59,032 | 1109 | 4.77/5.0 |
| Leslie | 4 | $45,135 | 340 | 4.90/5.0 |
| Evolve | 2 | $38,168 | 40 | 4.79/5.0 |
| Chrisy | 2 | $37,595 | 71 | 5.00/5.0 |
| Dawn | 2 | $30,474 | 58 | 4.92/5.0 |
| Matt | 1 | $21,552 | 314 | 4.95/5.0 |
| Jacquelyn | 1 | $19,951 | 18 | 4.17/5.0 |
Analyzing the strategies of top hosts, such as their property selection, pricing, and guest communication, can offer valuable lessons for optimizing your own Airbnb operations in Pacific.
Dive Deeper: Advanced Pacific STR Market Data (2026)
Ready to unlock more insights? AirROI provides access to advanced metrics and comprehensive Airbnb data for Pacific. Explore detailed analytics beyond this report to refine your investment strategy, optimize pricing, and maximize your vacation rental profits.
Explore Advanced MetricsPacific Short-Term Rental Market Composition (2026): Property & Room Types
Room Type Distribution
Property Type Distribution
Market Composition Insights for Pacific
- The Pacific Airbnb market composition is heavily skewed towards Entire Home/Apt listings, which make up 65.7% of the 35 active rentals. This indicates strong guest preference for privacy and space.
- However, a notable 34.3% share for Private Rooms suggests opportunities for budget-conscious travelers or hosts renting out spare rooms.
- Looking at the property type distribution in Pacific, House properties are the most common (48.6%), reflecting the local real estate landscape.
- Houses represent a significant 48.6% portion, catering likely to families or larger groups.
- The presence of 20% Hotel/Boutique listings indicates integration with traditional hospitality.
Pacific Airbnb Room Capacity Analysis (2026): Bedroom Distribution
Distribution of Listings by Number of Bedrooms
Room Capacity Insights for Pacific
- The dominant room capacity in Pacific is 1 bedroom listings, making up 42.9% of the market. This suggests a strong demand for properties suitable for couples or solo travelers.
- Together, 1 bedroom and 2 bedrooms properties represent 80.0% of the active Airbnb listings in Pacific, indicating a high concentration in these sizes.
Pacific Vacation Rental Guest Capacity Trends (2026)
Distribution of Listings by Guest Capacity
Guest Capacity Insights for Pacific
- The most common guest capacity trend in Pacific vacation rentals is listings accommodating 2 guests (22.9%). This suggests the primary traveler segment is likely couples or solo travelers.
- Properties designed for 2 guests and 5 guests dominate the Pacific STR market, accounting for 45.8% of listings.
- 28.6% of properties accommodate 6+ guests, serving the market segment for larger families or group travel in Pacific.
- On average, properties in Pacific are equipped to host 4.4 guests.
Pacific Airbnb Booking Patterns (2026): Available vs. Booked Days
Available Days Distribution
Booked Days Distribution
Booking Pattern Insights for Pacific
- The most common availability pattern in Pacific falls within the 271-366 days range, representing 62.9% of listings. This suggests many properties have significant open periods on their calendars.
- Approximately 85.8% of listings show high availability (181+ days open annually), indicating potential for increased bookings or specific owner usage patterns.
- For booked days, the 31-90 days range is most frequent in Pacific (60%), reflecting common guest stay durations or potential owner blocking patterns.
- A notable 14.3% of properties secure long booking periods (181+ days booked per year), highlighting successful long-term rental strategies or significant owner usage.
Pacific Airbnb Minimum Stay Requirements Analysis
Distribution of Listings by Minimum Night Requirement
1 Night
24 listings
68.6% of total
2 Nights
8 listings
22.9% of total
3 Nights
1 listings
2.9% of total
30+ Nights
2 listings
5.7% of total
Key Insights
- The most prevalent minimum stay requirement in Pacific is 1 Night, adopted by 68.6% of listings. This highlights the market's preference for shorter, flexible bookings.
- A strong majority (91.5%) of the Pacific Airbnb data shows acceptance of very short stays (1-2 nights), indicating a dynamic, high-turnover market.
Recommendations
- Align with the market by considering a 1 Night minimum stay, as 68.6% of Pacific hosts use this setting.
- Explore offering discounts for stays of 30+ nights to attract the 5.7% of the market seeking extended stays.
- Adjust minimum nights based on seasonality – potentially shorter during low season and longer during peak demand periods in Pacific.
Pacific Airbnb Cancellation Policy Trends Analysis (2026)
Flexible
19 listings
54.3% of total
Moderate
7 listings
20% of total
Firm
5 listings
14.3% of total
Strict
4 listings
11.4% of total
Cancellation Policy Insights for Pacific
- The prevailing Airbnb cancellation policy trend in Pacific is Flexible, used by 54.3% of listings.
- The market strongly favors guest-friendly terms, with 74.3% of listings offering Flexible or Moderate policies. This suggests guests in Pacific may expect booking flexibility.
Recommendations for Hosts
- Consider adopting a Flexible policy to align with the 54.3% market standard in Pacific.
- Given the high prevalence of Flexible policies (54.3%), offering this can enhance booking appeal, especially during shoulder seasons.
- Using a Strict policy might deter some guests, as only 11.4% of listings use it. Evaluate if potential revenue protection outweighs possible lower booking rates.
- Regularly review your cancellation policy against competitors and market demand shifts in Pacific.
Pacific STR Booking Lead Time Analysis (2026)
Average Booking Lead Time by Month
Booking Lead Time Insights for Pacific
- The overall average booking lead time for vacation rentals in Pacific is 52 days.
- Guests book furthest in advance for stays during September (average 85 days), likely coinciding with peak travel demand or local events.
- The shortest booking windows occur for stays in February (average 11 days), indicating more last-minute travel plans during this time.
- Seasonally, Summer (54 days avg.) sees the longest lead times, while Winter (35 days avg.) has the shortest, reflecting typical travel planning cycles.
Recommendations for Hosts
- Use the overall average lead time (52 days) as a baseline for your pricing and availability strategy in Pacific.
- For September stays, consider implementing length-of-stay discounts or slightly higher rates for bookings made less than 85 days out to capitalize on advance planning.
- During February, focus on last-minute booking availability and promotions, as guests book with very short notice (11 days avg.).
- Target marketing efforts for the Summer season well in advance (at least 54 days) to capture early planners.
- Monitor your own booking lead times against these Pacific averages to identify opportunities for dynamic pricing adjustments.
Popular & Essential Airbnb Amenities in Pacific (2026)
Amenity Prevalence
Amenity Insights for Pacific
- Essential amenities in Pacific that guests expect include: Pets allowed, Air conditioning, Smoke alarm, TV, Kitchen, Wifi, Dishes and silverware, Fire extinguisher, Microwave, Hot water. Lacking these (any) could significantly impact bookings.
Recommendations for Hosts
- Ensure your listing includes all essential amenities for Pacific: Pets allowed, Air conditioning, Smoke alarm, TV, Kitchen, Wifi, Dishes and silverware, Fire extinguisher, Microwave, Hot water.
- Prioritize adding missing essentials: Dishes and silverware, Fire extinguisher, Microwave, Hot water.
- Highlight unique or less common amenities you offer (e.g., hot tub, dedicated workspace, EV charger) in your listing description and photos.
- Regularly check competitor amenities in Pacific to stay competitive.
Pacific Airbnb Guest Demographics & Profile Analysis (2026)
Guest Profile Summary for Pacific
- The typical guest profile for Airbnb in Pacific consists of primarily domestic travelers (98%), often arriving from nearby St. Louis, typically belonging to the Post-2000s (Gen Z/Alpha) group (50%), primarily speaking English or Spanish.
- Domestic travelers account for 98.2% of guests.
- Key international markets include United States (98.2%) and Netherlands (0.3%).
- Top languages spoken are English (82%) followed by Spanish (9.3%).
- A significant demographic segment is the Post-2000s (Gen Z/Alpha) group, representing 50% of guests.
Recommendations for Hosts
- Target domestic marketing efforts towards travelers from St. Louis and Kansas City.
- Tailor amenities and listing descriptions to appeal to the dominant Post-2000s (Gen Z/Alpha) demographic (e.g., highlight fast WiFi, smart home features, local guides).
- Highlight unique local experiences or amenities relevant to the primary guest profile.
- Consider seasonal promotions aligned with peak travel times for key origin markets.
Nearby Short-Term Rental Market Comparison
How does the Pacific Airbnb market stack up against its neighbors? Compare key performance metrics like average monthly revenue, ADR, and occupancy rates in surrounding areas to understand the broader regional STR landscape.
| Market | Active Properties | Monthly Revenue | Daily Rate | Avg. Occupancy |
|---|---|---|---|---|
| Wright City | 13 | $4,135 | $455.44 | 37% |
| Innsbrook | 199 | $4,100 | $422.60 | 35% |
| Ste. Genevieve | 13 | $3,781 | $375.74 | 36% |
| Creve Coeur | 10 | $3,420 | $282.01 | 42% |
| Makanda | 19 | $3,145 | $247.99 | 51% |
| Godfrey | 10 | $3,077 | $217.89 | 50% |
| Maryland Heights | 19 | $2,989 | $219.63 | 55% |
| Wentzville | 19 | $2,964 | $195.63 | 51% |
| Saint Charles | 159 | $2,907 | $214.21 | 50% |
| O’Fallon | 38 | $2,897 | $225.47 | 51% |