Neosho Airbnb Market Analysis 2026: Short Term Rental Data & Vacation Rental Statistics in Missouri, United States
Is Airbnb profitable in Neosho in 2026? Explore comprehensive Airbnb analytics for Neosho, Missouri, United States to uncover income potential. This 2026 STR market report for Neosho, based on AirROI data from February 2025 to January 2026, reveals key trends in the niche market of 22 active listings.
Whether you're considering an Airbnb investment in Neosho, optimizing your existing vacation rental, or exploring rental arbitrage opportunities, understanding the Neosho Airbnb data is crucial. Leveraging the low regulation environment is key to maximizing your short term rental income potential. Let's dive into the specifics.
Key Neosho Airbnb Performance Metrics Overview
Monthly Airbnb Revenue Variations & Income Potential in Neosho (2026)
Understanding the monthly revenue variations for Airbnb listings in Neosho is key to maximizing your short term rental income potential. Seasonality significantly impacts earnings. Our analysis, based on data from the past 12 months, shows that the peak revenue month for STRs in Neosho is typically July, while January often presents the lowest earnings, highlighting opportunities for strategic pricing adjustments during shoulder and low seasons. Explore the typical Airbnb income in Neosho across different performance tiers:
- Best-in-class properties (Top 10%) achieve $2,664+ monthly, often utilizing dynamic pricing and superior guest experiences.
- Strong performing properties (Top 25%) earn $1,928 or more, indicating effective management and desirable locations/amenities.
- Typical properties (Median) generate around $1,428 per month, representing the average market performance.
- Entry-level properties (Bottom 25%) see earnings around $935, often with potential for optimization.
Average Monthly Airbnb Earnings Trend in Neosho
Neosho Airbnb Occupancy Rate Trends (2026)
Maximize your bookings by understanding the Neosho STR occupancy trends. Seasonal demand shifts significantly influence how often properties are booked. Typically, Julysees the highest demand (peak season occupancy), while January experiences the lowest (low season). Effective strategies, like adjusting minimum stays or offering promotions, can boost occupancy during slower periods. Here's how different property tiers perform in Neosho:
- Best-in-class properties (Top 10%) achieve 79%+ occupancy, indicating high desirability and potentially optimized availability.
- Strong performing properties (Top 25%) maintain 60% or higher occupancy, suggesting good market fit and guest satisfaction.
- Typical properties (Median) have an occupancy rate around 43%.
- Entry-level properties (Bottom 25%) average 29% occupancy, potentially facing higher vacancy.
Average Monthly Occupancy Rate Trend in Neosho
Average Daily Rate (ADR) Airbnb Trends in Neosho (2026)
Effective short term rental pricing strategy in Neosho involves understanding monthly ADR fluctuations. The Average Daily Rate (ADR) for Airbnb in Neosho typically peaks in October and dips lowest during April. Leveraging Airbnb dynamic pricing tools or strategies based on this seasonality can significantly boost revenue. Here's a look at the typical nightly rates achieved:
- Best-in-class properties (Top 10%) command rates of $181+ per night, often due to premium features or locations.
- Strong performing properties (Top 25%) achieve nightly rates of $126 or more.
- Typical properties (Median) charge around $105 per night.
- Entry-level properties (Bottom 25%) earn around $80 per night.
Average Daily Rate (ADR) Trend by Month in Neosho
Get Live Neosho Market Intelligence 👇

Explore Real-time Analytics
Airbnb Seasonality Analysis & Trends in Neosho (2026)
Peak Season (July, October, August)
- Revenue averages $2,092 per month
- Occupancy rates average 55.9%
- Daily rates average $120
Shoulder Season
- Revenue averages $1,582 per month
- Occupancy maintains around 46.3%
- Daily rates hold near $114
Low Season (January, February, December)
- Revenue drops to average $1,268 per month
- Occupancy decreases to average 34.7%
- Daily rates adjust to average $112
Seasonality Insights for Neosho
- The Airbnb seasonality in Neosho shows highly seasonal trends requiring careful strategy. While the sections above show seasonal averages, it's also insightful to look at the extremes:
- During the high season, the absolute peak month showcases Neosho's highest earning potential, with monthly revenues capable of climbing to $2,378, occupancy reaching a high of 64.3%, and ADRs peaking at $121.
- Conversely, the slowest single month of the year, typically falling within the low season, marks the market's lowest point. In this month, revenue might dip to $1,128, occupancy could drop to 28.3%, and ADRs may adjust down to $105.
- Understanding both the seasonal averages and these monthly peaks and troughs in revenue, occupancy, and ADR is crucial for maximizing your Airbnb profit potential in Neosho.
Seasonal Strategies for Maximizing Profit
- Peak Season: Maximize revenue through premium pricing and potentially longer minimum stays. Ensure high availability.
- Low Season: Offer competitive pricing, special promotions (e.g., extended stay discounts), and flexible cancellation policies. Target off-season travelers like remote workers or budget-conscious guests.
- Shoulder Seasons: Implement dynamic pricing that balances peak and low rates. Target weekend travelers or specific events. Offer slightly more flexible terms than peak season.
- Regularly analyze your own performance against these Neosho seasonality benchmarks and adjust your pricing and availability strategy accordingly.
Best Areas for Airbnb Investment in Neosho (2026)
Exploring the top neighborhoods for short-term rentals in Neosho? This section highlights key areas, outlining why they are attractive for hosts and guests, along with notable local attractions. Consider these locations based on your target guest profile and investment strategy.
| Neighborhood / Area | Why Host Here? (Target Guests & Appeal) | Key Attractions & Landmarks |
|---|---|---|
| Neosho Downtown | The historic district offers unique shopping and dining experiences, attracting visitors interested in local history and culture. | Historic Neosho Depot, Neosho National Fish Hatchery, Neosho Arts Council, Local shops and boutiques, Californ ation War Memorial |
| Cedar Park | A tranquil residential area close to parks and recreational activities, appealing to families and nature lovers. | Cedar Park, St. Mary's Catholic Church, Neosho High School Football Stadium, Local community events, Walking trails |
| Neosho Memorial Park | A popular spot for community gatherings, picnics, and outdoor activities, making it attractive for families and groups. | Memorial Park, Picnic areas, Children's playground, Walking trails, Sports fields |
| Big Sugar Creek State Park | A beautiful natural area for outdoor enthusiasts, perfect for those seeking adventure and nature experiences. | Hiking trails, Fishing spots, Wildlife watching, Picnic areas, Scenic views |
| Neosho Riverwalk | A scenic walking trail along the river, ideal for visitors who enjoy leisure activities and outdoor scenery. | Riverwalk trails, Fishing spots, Nature views, Benches and picnic areas, Wildlife observation |
| Pineville | Just a short drive from Neosho, this area offers additional attractions and convenience to those visiting Neosho. | Pineville Park, Local dining options, Outdoor recreation areas, Close access to other attractions, Small-town charm |
| Joplin | Nearby Joplin is a larger city with diverse attractions, perfect for travelers looking for urban experiences while staying in Neosho. | Joplin Museum Complex, Cunningham Park, Shopping and dining options, Historic Route 66, Indoor entertainment venues |
| Rural Areas around Neosho | The surrounding rural areas offer peace and tranquility, appealing to those looking to escape the hustle and bustle of city life. | Scenic country roads, Local farms, Wildlife and nature escapes, Peaceful environment, Stargazing opportunities |
Understanding Airbnb License Requirements & STR Laws in Neosho (2026)
While Neosho, Missouri, United States currently shows low STR regulations, specific Airbnb license requirements might still exist or change. Always verify the latest short term rental regulations and Airbnb license requirements directly with local government authorities for Neosho to ensure full compliance before hosting.
(Source: AirROI data, 2026, finding no licensed listings among those analyzed)
Top Performing Airbnb Properties in Neosho (2026)
Benchmark your potential! Explore examples of top-performing Airbnb properties in Neoshobased on Trailing Twelve Month (TTM) revenue. Analyze their characteristics, revenue, occupancy rate, and ADR to understand what drives success in this market.
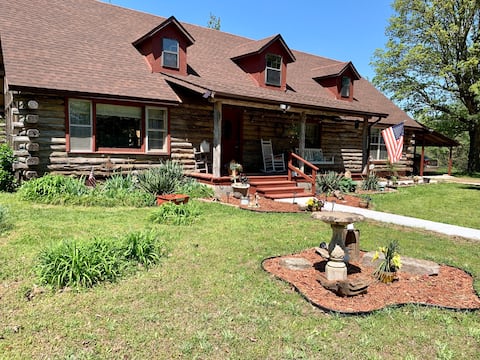
Log home in fir tree woods privacy, deer & peace
Entire Place • 5 bedrooms
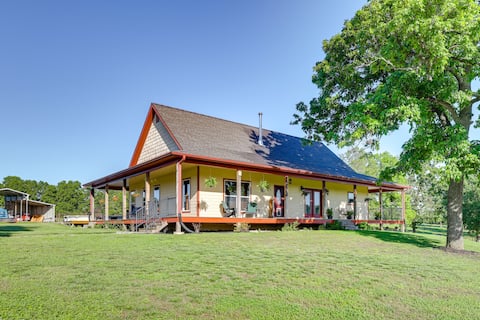
Neosho Home on 90 Acres w/ Private Pool & Fire Pit
Entire Place • 3 bedrooms

Home Away from Home on Ridgewood
Entire Place • 3 bedrooms

Cozy Home in Neosho
Entire Place • 3 bedrooms
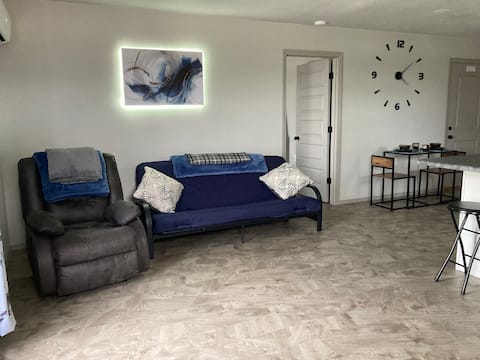
Home Comfort
Entire Place • 1 bedroom
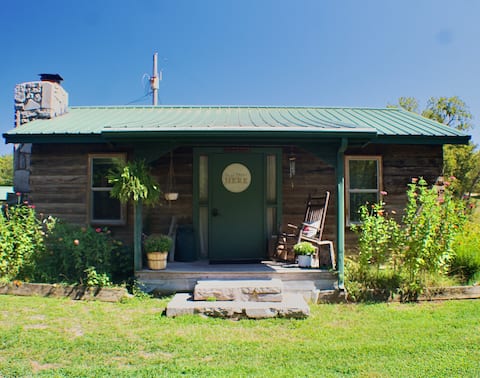
Cabin at Bullskin Creek
Entire Place • 1 bedroom
Note: Performance varies based on location, size, amenities, seasonality, and management quality. Data reflects the past 12 months.
Top Performing Airbnb Hosts in Neosho (2026)
Learn from the best! This table showcases top-performing Airbnb hosts in Neosho based on the number of properties managed and estimated total revenue over the past year. Analyze their scale and performance metrics.
| Host Name | Properties | Grossing Revenue | Stay Reviews | Avg Rating |
|---|---|---|---|---|
| Justin | 3 | $41,966 | 230 | 4.93/5.0 |
| Bonnie | 1 | $41,347 | 77 | 4.94/5.0 |
| Evolve | 1 | $29,385 | 23 | 4.96/5.0 |
| Angela | 1 | $26,558 | 91 | 4.99/5.0 |
| Paige | 1 | $22,061 | 106 | 4.86/5.0 |
| Ida | 1 | $21,568 | 67 | 4.99/5.0 |
| Ashley | 1 | $19,661 | 95 | 4.68/5.0 |
| Madaline | 1 | $19,473 | 95 | 4.98/5.0 |
| Jimmy | 1 | $19,405 | 64 | 5.00/5.0 |
| Benjamin | 1 | $17,318 | 253 | 4.98/5.0 |
Analyzing the strategies of top hosts, such as their property selection, pricing, and guest communication, can offer valuable lessons for optimizing your own Airbnb operations in Neosho.
Dive Deeper: Advanced Neosho STR Market Data (2026)
Ready to unlock more insights? AirROI provides access to advanced metrics and comprehensive Airbnb data for Neosho. Explore detailed analytics beyond this report to refine your investment strategy, optimize pricing, and maximize your vacation rental profits.
Explore Advanced MetricsNeosho Short-Term Rental Market Composition (2026): Property & Room Types
Room Type Distribution
Property Type Distribution
Market Composition Insights for Neosho
- The Neosho Airbnb market composition is heavily skewed towards Entire Home/Apt listings, which make up 100% of the 22 active rentals. This indicates strong guest preference for privacy and space.
- Looking at the property type distribution in Neosho, House properties are the most common (45.5%), reflecting the local real estate landscape.
- Houses represent a significant 45.5% portion, catering likely to families or larger groups.
- Smaller segments like hotel/boutique (combined 4.5%) offer potential for unique stay experiences.
Neosho Airbnb Room Capacity Analysis (2026): Bedroom Distribution
Distribution of Listings by Number of Bedrooms
Room Capacity Insights for Neosho
- The dominant room capacity in Neosho is 1 bedroom listings, making up 45.5% of the market. This suggests a strong demand for properties suitable for couples or solo travelers.
- Together, 1 bedroom and 2 bedrooms properties represent 77.3% of the active Airbnb listings in Neosho, indicating a high concentration in these sizes.
- A significant 22.7% of listings offer 3+ bedrooms, catering to larger groups and families seeking more space in Neosho.
Neosho Vacation Rental Guest Capacity Trends (2026)
Distribution of Listings by Guest Capacity
Guest Capacity Insights for Neosho
- The most common guest capacity trend in Neosho vacation rentals is listings accommodating 4 guests (50%). This suggests the primary traveler segment is likely small families or groups.
- Properties designed for 4 guests and 8+ guests dominate the Neosho STR market, accounting for 68.2% of listings.
- 36.4% of properties accommodate 6+ guests, serving the market segment for larger families or group travel in Neosho.
- On average, properties in Neosho are equipped to host 4.8 guests.
Neosho Airbnb Booking Patterns (2026): Available vs. Booked Days
Available Days Distribution
Booked Days Distribution
Booking Pattern Insights for Neosho
- The most common availability pattern in Neosho falls within the 181-270 days range, representing 59.1% of listings. This suggests many properties have significant open periods on their calendars.
- Approximately 77.3% of listings show high availability (181+ days open annually), indicating potential for increased bookings or specific owner usage patterns.
- For booked days, the 91-180 days range is most frequent in Neosho (54.5%), reflecting common guest stay durations or potential owner blocking patterns.
- A notable 27.3% of properties secure long booking periods (181+ days booked per year), highlighting successful long-term rental strategies or significant owner usage.
Neosho Airbnb Minimum Stay Requirements Analysis
Distribution of Listings by Minimum Night Requirement
1 Night
12 listings
54.5% of total
2 Nights
8 listings
36.4% of total
3 Nights
1 listings
4.5% of total
30+ Nights
1 listings
4.5% of total
Key Insights
- The most prevalent minimum stay requirement in Neosho is 1 Night, adopted by 54.5% of listings. This highlights the market's preference for shorter, flexible bookings.
- A strong majority (90.9%) of the Neosho Airbnb data shows acceptance of very short stays (1-2 nights), indicating a dynamic, high-turnover market.
Recommendations
- Align with the market by considering a 1 Night minimum stay, as 54.5% of Neosho hosts use this setting.
- Adjust minimum nights based on seasonality – potentially shorter during low season and longer during peak demand periods in Neosho.
Neosho Airbnb Cancellation Policy Trends Analysis (2026)
Flexible
6 listings
27.3% of total
Moderate
11 listings
50% of total
Firm
5 listings
22.7% of total
Cancellation Policy Insights for Neosho
- The prevailing Airbnb cancellation policy trend in Neosho is Moderate, used by 50% of listings.
- The market strongly favors guest-friendly terms, with 77.3% of listings offering Flexible or Moderate policies. This suggests guests in Neosho may expect booking flexibility.
Recommendations for Hosts
- Consider adopting a Moderate policy to align with the 50% market standard in Neosho.
- Regularly review your cancellation policy against competitors and market demand shifts in Neosho.
Neosho STR Booking Lead Time Analysis (2026)
Average Booking Lead Time by Month
Booking Lead Time Insights for Neosho
- The overall average booking lead time for vacation rentals in Neosho is 33 days.
- Guests book furthest in advance for stays during September (average 49 days), likely coinciding with peak travel demand or local events.
- The shortest booking windows occur for stays in January (average 12 days), indicating more last-minute travel plans during this time.
- Seasonally, Fall (46 days avg.) sees the longest lead times, while Winter (18 days avg.) has the shortest, reflecting typical travel planning cycles.
Recommendations for Hosts
- Use the overall average lead time (33 days) as a baseline for your pricing and availability strategy in Neosho.
- For September stays, consider implementing length-of-stay discounts or slightly higher rates for bookings made less than 49 days out to capitalize on advance planning.
- During January, focus on last-minute booking availability and promotions, as guests book with very short notice (12 days avg.).
- Target marketing efforts for the Fall season well in advance (at least 46 days) to capture early planners.
- Monitor your own booking lead times against these Neosho averages to identify opportunities for dynamic pricing adjustments.
Popular & Essential Airbnb Amenities in Neosho (2026)
Amenity Prevalence
Amenity Insights for Neosho
- Essential amenities in Neosho that guests expect include: Free parking on premises, Smoke alarm, Air conditioning, Heating, Dishes and silverware, TV, Hot water, Kitchen, Wifi, Coffee maker. Lacking these (any) could significantly impact bookings.
Recommendations for Hosts
- Ensure your listing includes all essential amenities for Neosho: Free parking on premises, Smoke alarm, Air conditioning, Heating, Dishes and silverware, TV, Hot water, Kitchen, Wifi, Coffee maker.
- Prioritize adding missing essentials: TV, Hot water, Kitchen, Wifi, Coffee maker.
- Highlight unique or less common amenities you offer (e.g., hot tub, dedicated workspace, EV charger) in your listing description and photos.
- Regularly check competitor amenities in Neosho to stay competitive.
Neosho Airbnb Guest Demographics & Profile Analysis (2026)
Guest Profile Summary for Neosho
- The typical guest profile for Airbnb in Neosho consists of primarily domestic travelers (97%), often arriving from nearby Kansas City, typically belonging to the Post-2000s (Gen Z/Alpha) group (50%), primarily speaking English or Spanish.
- Domestic travelers account for 96.8% of guests.
- Key international markets include United States (96.8%) and Canada (0.8%).
- Top languages spoken are English (79.8%) followed by Spanish (6.1%).
- A significant demographic segment is the Post-2000s (Gen Z/Alpha) group, representing 50% of guests.
Recommendations for Hosts
- Target domestic marketing efforts towards travelers from Kansas City and Carlisle.
- Tailor amenities and listing descriptions to appeal to the dominant Post-2000s (Gen Z/Alpha) demographic (e.g., highlight fast WiFi, smart home features, local guides).
- Highlight unique local experiences or amenities relevant to the primary guest profile.
- Consider seasonal promotions aligned with peak travel times for key origin markets.
Nearby Short-Term Rental Market Comparison
How does the Neosho Airbnb market stack up against its neighbors? Compare key performance metrics like average monthly revenue, ADR, and occupancy rates in surrounding areas to understand the broader regional STR landscape.
| Market | Active Properties | Monthly Revenue | Daily Rate | Avg. Occupancy |
|---|---|---|---|---|
| Blue Eye | 32 | $5,674 | $427.78 | 50% |
| Hollister | 317 | $4,744 | $431.85 | 42% |
| Omaha | 38 | $3,581 | $270.03 | 48% |
| Ridgedale | 121 | $3,353 | $429.21 | 38% |
| Branson West | 267 | $3,068 | $246.89 | 43% |
| Carlton Landing | 100 | $3,015 | $417.80 | 29% |
| Little Flock | 17 | $2,955 | $370.27 | 40% |
| Lowell | 30 | $2,905 | $254.69 | 43% |
| Canadian | 44 | $2,897 | $349.28 | 34% |
| Ponca | 40 | $2,893 | $371.63 | 31% |