Hollister Airbnb Market Analysis 2025: Short Term Rental Data & Vacation Rental Statistics in Missouri, United States
Is Airbnb profitable in Hollister in 2025? Explore comprehensive Airbnb analytics for Hollister, Missouri, United States to uncover income potential. This 2025 STR market report for Hollister, based on AirROI data from November 2024 to October 2025, reveals key trends in the market of 251 active listings.
Whether you're considering an Airbnb investment in Hollister, optimizing your existing vacation rental, or exploring rental arbitrage opportunities, understanding the Hollister Airbnb data is crucial. Leveraging the low regulation environment is key to maximizing your short term rental income potential. Let's dive into the specifics.
Key Hollister Airbnb Performance Metrics Overview
Monthly Airbnb Revenue Variations & Income Potential in Hollister (2025)
Understanding the monthly revenue variations for Airbnb listings in Hollister is key to maximizing your short term rental income potential. Seasonality significantly impacts earnings. Our analysis, based on data from the past 12 months, shows that the peak revenue month for STRs in Hollister is typically July, while February often presents the lowest earnings, highlighting opportunities for strategic pricing adjustments during shoulder and low seasons. Explore the typical Airbnb income in Hollister across different performance tiers:
- Best-in-class properties (Top 10%) achieve $11,563+ monthly, often utilizing dynamic pricing and superior guest experiences.
- Strong performing properties (Top 25%) earn $8,245 or more, indicating effective management and desirable locations/amenities.
- Typical properties (Median) generate around $4,946 per month, representing the average market performance.
- Entry-level properties (Bottom 25%) see earnings around $2,347, often with potential for optimization.
Average Monthly Airbnb Earnings Trend in Hollister
Hollister Airbnb Occupancy Rate Trends (2025)
Maximize your bookings by understanding the Hollister STR occupancy trends. Seasonal demand shifts significantly influence how often properties are booked. Typically, Julysees the highest demand (peak season occupancy), while January experiences the lowest (low season). Effective strategies, like adjusting minimum stays or offering promotions, can boost occupancy during slower periods. Here's how different property tiers perform in Hollister:
- Best-in-class properties (Top 10%) achieve 71%+ occupancy, indicating high desirability and potentially optimized availability.
- Strong performing properties (Top 25%) maintain 57% or higher occupancy, suggesting good market fit and guest satisfaction.
- Typical properties (Median) have an occupancy rate around 40%.
- Entry-level properties (Bottom 25%) average 26% occupancy, potentially facing higher vacancy.
Average Monthly Occupancy Rate Trend in Hollister
Average Daily Rate (ADR) Airbnb Trends in Hollister (2025)
Effective short term rental pricing strategy in Hollister involves understanding monthly ADR fluctuations. The Average Daily Rate (ADR) for Airbnb in Hollister typically peaks in June and dips lowest during February. Leveraging Airbnb dynamic pricing tools or strategies based on this seasonality can significantly boost revenue. Here's a look at the typical nightly rates achieved:
- Best-in-class properties (Top 10%) command rates of $752+ per night, often due to premium features or locations.
- Strong performing properties (Top 25%) achieve nightly rates of $534 or more.
- Typical properties (Median) charge around $352 per night.
- Entry-level properties (Bottom 25%) earn around $231 per night.
Average Daily Rate (ADR) Trend by Month in Hollister
Get Live Hollister Market Intelligence 👇

Explore Real-time Analytics
Airbnb Seasonality Analysis & Trends in Hollister (2025)
Peak Season (July, June, December)
- Revenue averages $10,266 per month
- Occupancy rates average 59.4%
- Daily rates average $532
Shoulder Season
- Revenue averages $5,443 per month
- Occupancy maintains around 42.0%
- Daily rates hold near $416
Low Season (January, February, April)
- Revenue drops to average $2,519 per month
- Occupancy decreases to average 25.7%
- Daily rates adjust to average $328
Seasonality Insights for Hollister
- The Airbnb seasonality in Hollister shows highly seasonal trends requiring careful strategy. While the sections above show seasonal averages, it's also insightful to look at the extremes:
- During the high season, the absolute peak month showcases Hollister's highest earning potential, with monthly revenues capable of climbing to $12,594, occupancy reaching a high of 69.0%, and ADRs peaking at $595.
- Conversely, the slowest single month of the year, typically falling within the low season, marks the market's lowest point. In this month, revenue might dip to $2,161, occupancy could drop to 20.5%, and ADRs may adjust down to $314.
- Understanding both the seasonal averages and these monthly peaks and troughs in revenue, occupancy, and ADR is crucial for maximizing your Airbnb profit potential in Hollister.
Seasonal Strategies for Maximizing Profit
- Peak Season: Maximize revenue through premium pricing and potentially longer minimum stays. Ensure high availability.
- Low Season: Offer competitive pricing, special promotions (e.g., extended stay discounts), and flexible cancellation policies. Target off-season travelers like remote workers or budget-conscious guests.
- Shoulder Seasons: Implement dynamic pricing that balances peak and low rates. Target weekend travelers or specific events. Offer slightly more flexible terms than peak season.
- Regularly analyze your own performance against these Hollister seasonality benchmarks and adjust your pricing and availability strategy accordingly.
Best Areas for Airbnb Investment in Hollister (2025)
Exploring the top neighborhoods for short-term rentals in Hollister? This section highlights key areas, outlining why they are attractive for hosts and guests, along with notable local attractions. Consider these locations based on your target guest profile and investment strategy.
| Neighborhood / Area | Why Host Here? (Target Guests & Appeal) | Key Attractions & Landmarks |
|---|---|---|
| Table Rock Lake | A stunning reservoir with clear waters, perfect for water activities. This area attracts families and nature lovers seeking outdoor adventures and relaxation. | Table Rock State Park, Silver Dollar City, Dogwood Canyon, Fishing and boating activities, Hiking trails around the lake |
| Branson Landing | A premier shopping and dining destination right by the water. It features a vibrant atmosphere that attracts visitors looking for entertainment and relaxation by the waterfront. | Branson Landing shopping, Fire and Water Show, Walk along the Boardwalk, Restaurants and bars, Great shopping options |
| Downtown Hollister | The charming downtown area offers local shops, cafes, and historical attractions, drawing visitors who want a taste of local culture and heritage. | Historic Hollister Theatre, Hollister History Museum, Local dining options, Community events and festivals, Quaint shops and boutiques |
| Highway 76 Strip | Famous for its entertainment venues, this area attracts tourists looking for shows and nightlife, making it a prime spot for short-term rentals. | Live music venues, Theatres and shows, Restaurants and nightlife, Shopping opportunities, Family entertainment centers |
| Hollister Hills | Known for its beautiful views and residential atmosphere, it's perfect for those who want tranquility but still be close to major attractions in Branson and the lake. | Scenic views, Outdoor activities, Nearby hiking trails, Local parks, Quiet residential areas |
| Shell Knob | A friendly lakeside community that offers boating and fishing, ideal for those who love the outdoors and want a peaceful getaway. | Shelter Island, Fishing opportunities, Community events, Beautiful lake views, Local dining options |
| Cedar Creek | An area offering privacy and natural beauty, perfect for nature enthusiasts looking for a secluded getaway close to Hollister and Branson. | Nature trails, Scenic beauty, Peaceful environment, Wildlife watching, Local flora |
| Sunny Brook | A serene residential area, known for its community atmosphere and proximity to outdoor activities, making it great for families and vacationers. | Family-friendly parks, Community gatherings, Local shops, Access to nearby attractions, Scenic drives |
Understanding Airbnb License Requirements & STR Laws in Hollister (2025)
While Hollister, Missouri, United States currently shows low STR regulations, specific Airbnb license requirements might still exist or change. Always verify the latest short term rental regulations and Airbnb license requirements directly with local government authorities for Hollister to ensure full compliance before hosting.
(Source: AirROI data, 2025, based on 1% licensed listings)
Top Performing Airbnb Properties in Hollister (2025)
Benchmark your potential! Explore examples of top-performing Airbnb properties in Hollisterbased on Trailing Twelve Month (TTM) revenue. Analyze their characteristics, revenue, occupancy rate, and ADR to understand what drives success in this market.
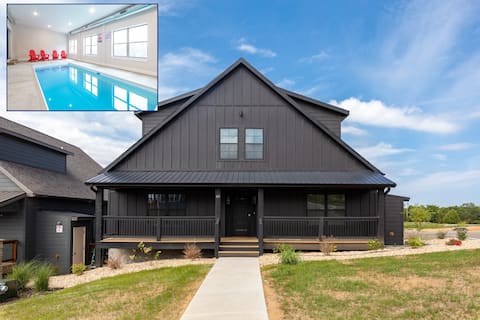
New 10 Bedroom Suites w Private Heated Indoor Pool
Entire Place • 10 bedrooms
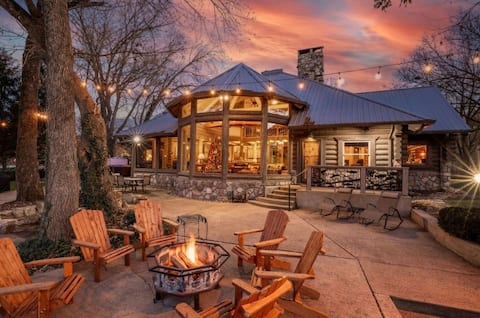
Great Trout Lodge
Entire Place • 5 bedrooms
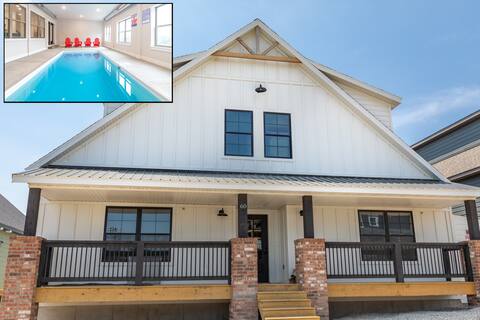
Pristine 10bd Lakeside Cabin w Private Indoor Pool
Entire Place • 10 bedrooms
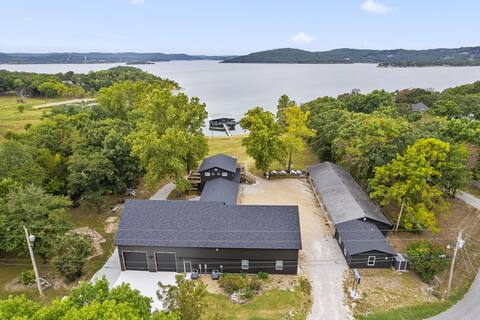
Pvt Retreats on Table Rock-Boat Dock-Free Tickets
Entire Place • 12 bedrooms

Colorful Family Fun IndoorPool+HotTub+Indoor Slide
Entire Place • 7 bedrooms

Luxe Lake Escape w/Private Indoor Pool+Sleeps 34!
Entire Place • 10 bedrooms
Note: Performance varies based on location, size, amenities, seasonality, and management quality. Data reflects the past 12 months.
Top Performing Airbnb Hosts in Hollister (2025)
Learn from the best! This table showcases top-performing Airbnb hosts in Hollister based on the number of properties managed and estimated total revenue over the past year. Analyze their scale and performance metrics.
| Host Name | Properties | Grossing Revenue | Stay Reviews | Avg Rating |
|---|---|---|---|---|
| Rent Branson LLC | 34 | $1,909,591 | 733 | 4.85/5.0 |
| Super Luxury Home Rentals | 12 | $1,157,297 | 162 | 4.92/5.0 |
| Adam | 10 | $1,088,166 | 878 | 4.97/5.0 |
| Lynn | 7 | $979,907 | 212 | 4.96/5.0 |
| Beths Breakaways | 9 | $815,480 | 395 | 4.97/5.0 |
| Key Getaways | 4 | $772,881 | 236 | 4.80/5.0 |
| Thousand Hills Vacations | 14 | $719,313 | 338 | 4.78/5.0 |
| Nat And Tyann | 9 | $443,118 | 35 | 4.91/5.0 |
| Cindy | 5 | $392,893 | 308 | 4.94/5.0 |
| Grand Welcome | 5 | $373,851 | 184 | 4.84/5.0 |
Analyzing the strategies of top hosts, such as their property selection, pricing, and guest communication, can offer valuable lessons for optimizing your own Airbnb operations in Hollister.
Dive Deeper: Advanced Hollister STR Market Data (2025)
Ready to unlock more insights? AirROI provides access to advanced metrics and comprehensive Airbnb data for Hollister. Explore detailed analytics beyond this report to refine your investment strategy, optimize pricing, and maximize your vacation rental profits.
Explore Advanced MetricsHollister Short-Term Rental Market Composition (2025): Property & Room Types
Room Type Distribution
Property Type Distribution
Market Composition Insights for Hollister
- The Hollister Airbnb market composition is heavily skewed towards Entire Home/Apt listings, which make up 93.6% of the 251 active rentals. This indicates strong guest preference for privacy and space.
- Looking at the property type distribution in Hollister, House properties are the most common (55.4%), reflecting the local real estate landscape.
- Houses represent a significant 55.4% portion, catering likely to families or larger groups.
- The presence of 6% Hotel/Boutique listings indicates integration with traditional hospitality.
Hollister Airbnb Room Capacity Analysis (2025): Bedroom Distribution
Distribution of Listings by Number of Bedrooms
Room Capacity Insights for Hollister
- The dominant room capacity in Hollister is 5+ bedrooms listings, making up 41.4% of the market. This suggests a strong demand for properties suitable for families or small groups.
- Together, 5+ bedrooms and 2 bedrooms properties represent 60.9% of the active Airbnb listings in Hollister, indicating a high concentration in these sizes.
- A significant 70.5% of listings offer 3+ bedrooms, catering to larger groups and families seeking more space in Hollister.
Hollister Vacation Rental Guest Capacity Trends (2025)
Distribution of Listings by Guest Capacity
Guest Capacity Insights for Hollister
- The most common guest capacity trend in Hollister vacation rentals is listings accommodating 8+ guests (62.9%). This suggests the primary traveler segment is likely larger groups.
- Properties designed for 8+ guests and 6 guests dominate the Hollister STR market, accounting for 78.8% of listings.
- 84.0% of properties accommodate 6+ guests, serving the market segment for larger families or group travel in Hollister.
- On average, properties in Hollister are equipped to host 6.9 guests.
Hollister Airbnb Booking Patterns (2025): Available vs. Booked Days
Available Days Distribution
Booked Days Distribution
Booking Pattern Insights for Hollister
- The most common availability pattern in Hollister falls within the 181-270 days range, representing 44.2% of listings. This suggests many properties have significant open periods on their calendars.
- Approximately 75.3% of listings show high availability (181+ days open annually), indicating potential for increased bookings or specific owner usage patterns.
- For booked days, the 91-180 days range is most frequent in Hollister (47%), reflecting common guest stay durations or potential owner blocking patterns.
- A notable 25.5% of properties secure long booking periods (181+ days booked per year), highlighting successful long-term rental strategies or significant owner usage.
Hollister Airbnb Minimum Stay Requirements Analysis
Distribution of Listings by Minimum Night Requirement
1 Night
28 listings
11.3% of total
2 Nights
69 listings
27.8% of total
3 Nights
6 listings
2.4% of total
4-6 Nights
3 listings
1.2% of total
30+ Nights
142 listings
57.3% of total
Key Insights
- The most prevalent minimum stay requirement in Hollister is 30+ Nights, adopted by 57.3% of listings. This highlights the market's preference for longer commitments.
- A significant segment (57.3%) caters to monthly stays (30+ nights) in Hollister, pointing to opportunities in the extended-stay market.
Recommendations
- Align with the market by considering a 30+ Nights minimum stay, as 57.3% of Hollister hosts use this setting.
- If feasible, allowing 1-night stays, especially midweek or during low season, could capture last-minute bookings, as only 11.3% currently do.
- Explore offering discounts for stays of 30+ nights to attract the 57.3% of the market seeking extended stays.
- Adjust minimum nights based on seasonality – potentially shorter during low season and longer during peak demand periods in Hollister.
Hollister Airbnb Cancellation Policy Trends Analysis (2025)
Super Strict 30 Days
20 listings
8% of total
Super Strict 60 Days
5 listings
2% of total
Limited
8 listings
3.2% of total
Flexible
33 listings
13.2% of total
Moderate
23 listings
9.2% of total
Firm
121 listings
48.4% of total
Strict
40 listings
16% of total
Cancellation Policy Insights for Hollister
- The prevailing Airbnb cancellation policy trend in Hollister is Firm, used by 48.4% of listings.
- A majority (64.4%) of hosts in Hollister utilize Firm or Strict policies, indicating a market where hosts prioritize booking security.
Recommendations for Hosts
- Consider adopting a Firm policy to align with the 48.4% market standard in Hollister.
- Regularly review your cancellation policy against competitors and market demand shifts in Hollister.
Hollister STR Booking Lead Time Analysis (2025)
Average Booking Lead Time by Month
Booking Lead Time Insights for Hollister
- The overall average booking lead time for vacation rentals in Hollister is 56 days.
- Guests book furthest in advance for stays during June (average 85 days), likely coinciding with peak travel demand or local events.
- The shortest booking windows occur for stays in February (average 24 days), indicating more last-minute travel plans during this time.
- Seasonally, Summer (72 days avg.) sees the longest lead times, while Winter (32 days avg.) has the shortest, reflecting typical travel planning cycles.
Recommendations for Hosts
- Use the overall average lead time (56 days) as a baseline for your pricing and availability strategy in Hollister.
- For June stays, consider implementing length-of-stay discounts or slightly higher rates for bookings made less than 85 days out to capitalize on advance planning.
- Target marketing efforts for the Summer season well in advance (at least 72 days) to capture early planners.
- Monitor your own booking lead times against these Hollister averages to identify opportunities for dynamic pricing adjustments.
Popular & Essential Airbnb Amenities in Hollister (2025)
Amenity Prevalence
Amenity Insights for Hollister
- Essential amenities in Hollister that guests expect include: Air conditioning, TV, Coffee maker, Wifi, Washer, Smoke alarm, Microwave, Refrigerator, Dryer. Lacking these (any) could significantly impact bookings.
- Popular amenities like Free parking on premises are common but not universal. Offering these can provide a competitive edge.
Recommendations for Hosts
- Ensure your listing includes all essential amenities for Hollister: Air conditioning, TV, Coffee maker, Wifi, Washer, Smoke alarm, Microwave, Refrigerator, Dryer.
- Prioritize adding missing essentials: Coffee maker, Wifi, Washer, Smoke alarm, Microwave, Refrigerator, Dryer.
- Consider adding popular differentiators like Free parking on premises to increase appeal.
- Highlight unique or less common amenities you offer (e.g., hot tub, dedicated workspace, EV charger) in your listing description and photos.
- Regularly check competitor amenities in Hollister to stay competitive.
Hollister Airbnb Guest Demographics & Profile Analysis (2025)
Guest Profile Summary for Hollister
- The typical guest profile for Airbnb in Hollister consists of primarily domestic travelers (99%), often arriving from nearby St. Louis, typically belonging to the Post-2000s (Gen Z/Alpha) group (50%), primarily speaking English or Spanish.
- Domestic travelers account for 99.3% of guests.
- Key international markets include United States (99.3%) and Canada (0.2%).
- Top languages spoken are English (86.9%) followed by Spanish (6.8%).
- A significant demographic segment is the Post-2000s (Gen Z/Alpha) group, representing 50% of guests.
Recommendations for Hosts
- Target domestic marketing efforts towards travelers from St. Louis and Kansas City.
- Tailor amenities and listing descriptions to appeal to the dominant Post-2000s (Gen Z/Alpha) demographic (e.g., highlight fast WiFi, smart home features, local guides).
- Highlight unique local experiences or amenities relevant to the primary guest profile.
- Consider seasonal promotions aligned with peak travel times for key origin markets.
Nearby Short-Term Rental Market Comparison
How does the Hollister Airbnb market stack up against its neighbors? Compare key performance metrics like average monthly revenue, ADR, and occupancy rates in surrounding areas to understand the broader regional STR landscape.
| Market | Active Properties | Monthly Revenue | Daily Rate | Avg. Occupancy |
|---|---|---|---|---|
| Blue Eye | 31 | $5,437 | $442.65 | 47% |
| Ridgedale | 76 | $5,000 | $398.96 | 48% |
| Kirbyville | 16 | $3,509 | $309.56 | 32% |
| Omaha | 34 | $3,475 | $263.43 | 47% |
| Flippin | 36 | $3,272 | $272.32 | 38% |
| Kimberling City | 299 | $3,222 | $372.37 | 32% |
| Branson West | 250 | $3,164 | $249.90 | 43% |
| Little Flock | 17 | $2,882 | $353.20 | 42% |
| Lowell | 31 | $2,828 | $242.80 | 43% |
| Ponca | 41 | $2,809 | $371.29 | 31% |