Florissant Airbnb Market Analysis 2026: Short Term Rental Data & Vacation Rental Statistics in Missouri, United States
Is Airbnb profitable in Florissant in 2026? Explore comprehensive Airbnb analytics for Florissant, Missouri, United States to uncover income potential. This 2026 STR market report for Florissant, based on AirROI data from February 2025 to January 2026, reveals key trends in the niche market of 24 active listings.
Whether you're considering an Airbnb investment in Florissant, optimizing your existing vacation rental, or exploring rental arbitrage opportunities, understanding the Florissant Airbnb data is crucial. Leveraging the low regulation environment is key to maximizing your short term rental income potential. Let's dive into the specifics.
Key Florissant Airbnb Performance Metrics Overview
Monthly Airbnb Revenue Variations & Income Potential in Florissant (2026)
Understanding the monthly revenue variations for Airbnb listings in Florissant is key to maximizing your short term rental income potential. Seasonality significantly impacts earnings. Our analysis, based on data from the past 12 months, shows that the peak revenue month for STRs in Florissant is typically April, while February often presents the lowest earnings, highlighting opportunities for strategic pricing adjustments during shoulder and low seasons. Explore the typical Airbnb income in Florissant across different performance tiers:
- Best-in-class properties (Top 10%) achieve $4,372+ monthly, often utilizing dynamic pricing and superior guest experiences.
- Strong performing properties (Top 25%) earn $3,012 or more, indicating effective management and desirable locations/amenities.
- Typical properties (Median) generate around $1,495 per month, representing the average market performance.
- Entry-level properties (Bottom 25%) see earnings around $601, often with potential for optimization.
Average Monthly Airbnb Earnings Trend in Florissant
Florissant Airbnb Occupancy Rate Trends (2026)
Maximize your bookings by understanding the Florissant STR occupancy trends. Seasonal demand shifts significantly influence how often properties are booked. Typically, Aprilsees the highest demand (peak season occupancy), while January experiences the lowest (low season). Effective strategies, like adjusting minimum stays or offering promotions, can boost occupancy during slower periods. Here's how different property tiers perform in Florissant:
- Best-in-class properties (Top 10%) achieve 68%+ occupancy, indicating high desirability and potentially optimized availability.
- Strong performing properties (Top 25%) maintain 62% or higher occupancy, suggesting good market fit and guest satisfaction.
- Typical properties (Median) have an occupancy rate around 38%.
- Entry-level properties (Bottom 25%) average 22% occupancy, potentially facing higher vacancy.
Average Monthly Occupancy Rate Trend in Florissant
Average Daily Rate (ADR) Airbnb Trends in Florissant (2026)
Effective short term rental pricing strategy in Florissant involves understanding monthly ADR fluctuations. The Average Daily Rate (ADR) for Airbnb in Florissant typically peaks in September and dips lowest during April. Leveraging Airbnb dynamic pricing tools or strategies based on this seasonality can significantly boost revenue. Here's a look at the typical nightly rates achieved:
- Best-in-class properties (Top 10%) command rates of $254+ per night, often due to premium features or locations.
- Strong performing properties (Top 25%) achieve nightly rates of $183 or more.
- Typical properties (Median) charge around $111 per night.
- Entry-level properties (Bottom 25%) earn around $71 per night.
Average Daily Rate (ADR) Trend by Month in Florissant
Get Live Florissant Market Intelligence 👇

Explore Real-time Analytics
Airbnb Seasonality Analysis & Trends in Florissant (2026)
Peak Season (April, October, December)
- Revenue averages $2,430 per month
- Occupancy rates average 48.8%
- Daily rates average $128
Shoulder Season
- Revenue averages $2,073 per month
- Occupancy maintains around 41.2%
- Daily rates hold near $130
Low Season (January, February, May)
- Revenue drops to average $1,602 per month
- Occupancy decreases to average 34.4%
- Daily rates adjust to average $127
Seasonality Insights for Florissant
- The Airbnb seasonality in Florissant shows moderate seasonality with distinct peak and low periods. While the sections above show seasonal averages, it's also insightful to look at the extremes:
- During the high season, the absolute peak month showcases Florissant's highest earning potential, with monthly revenues capable of climbing to $2,582, occupancy reaching a high of 57.0%, and ADRs peaking at $132.
- Conversely, the slowest single month of the year, typically falling within the low season, marks the market's lowest point. In this month, revenue might dip to $1,442, occupancy could drop to 29.3%, and ADRs may adjust down to $123.
- Understanding both the seasonal averages and these monthly peaks and troughs in revenue, occupancy, and ADR is crucial for maximizing your Airbnb profit potential in Florissant.
Seasonal Strategies for Maximizing Profit
- Peak Season: Maximize revenue through premium pricing and potentially longer minimum stays. Ensure high availability.
- Low Season: Offer competitive pricing, special promotions (e.g., extended stay discounts), and flexible cancellation policies. Target off-season travelers like remote workers or budget-conscious guests.
- Shoulder Seasons: Implement dynamic pricing that balances peak and low rates. Target weekend travelers or specific events. Offer slightly more flexible terms than peak season.
- Regularly analyze your own performance against these Florissant seasonality benchmarks and adjust your pricing and availability strategy accordingly.
Best Areas for Airbnb Investment in Florissant (2026)
Exploring the top neighborhoods for short-term rentals in Florissant? This section highlights key areas, outlining why they are attractive for hosts and guests, along with notable local attractions. Consider these locations based on your target guest profile and investment strategy.
| Neighborhood / Area | Why Host Here? (Target Guests & Appeal) | Key Attractions & Landmarks |
|---|---|---|
| Old Town Florissant | Historic district with charming architecture, rich history, and a strong sense of community. It's a popular location for families and visitors during festivals and events. | Old St. Ferdinand Shrine, Florissant Civic Center Theatre, Natural Bridge Historical Society, St. Ferdinand Park, Parks and Recreation facilities |
| New Town | A modern, planned community with a great sense of community, parks, and amenities. Popular with families and those who love outdoor activities and modern living. | Lake and with walking paths, Community parks, Shopping centers, Restaurants and cafes, Events in community spaces |
| Hazelwood | A nearby suburb of Florissant that offers affordable housing and is close to major employers. Ideal for long-term rentals and family-oriented stays. | St. Louis Outlet Mall, Hazelwood City Parks, Various dining options, Hazelwood Historical Museum, Community events |
| Florissant Valley | Well-established residential area with easy access to main roads and local attractions, making it convenient for travelers. Family-friendly and accessible to major highways. | Florissant Valley Football Stadium, Florissant Aquatic Center, Veterans Memorial Park, Nearby schools and institutions, Convenient shopping areas |
| Parks and Recreation Areas | Areas with extensive parks and recreational facilities that attract families and individuals looking for outdoor fun and activities. Great for guests wanting a relaxing stay. | Delmoor Park, Sunset Park, Paul W. DeJong Park, Recreational sports facilities, Walking and biking trails |
| West Florissant Avenue | Busy commercial area with a variety of shops and services. Good for guests who want access to amenities and quick transport options. | Local dining and shopping, Florissant Square, Community service centers, Local entertainment venues |
| St. Louis County | The broader St. Louis County area offers various attractions, making Florissant a strong base for visitors exploring the greater St. Louis area. | St. Louis Zoo, Missouri Botanical Garden, Gateway Arch, Forest Park, Museums and cultural sites |
| Community Events and Festivals | Florissant hosts various seasonal events and festivals that attract visitors, increasing potential short-term rental demand. | Florissant Farmer's Market, Annual Florissant Summer Concert Series, Winter Wonderland Festival, Cultural festivals, Local art and craft fairs |
Understanding Airbnb License Requirements & STR Laws in Florissant (2026)
While Florissant, Missouri, United States currently shows low STR regulations, specific Airbnb license requirements might still exist or change. Always verify the latest short term rental regulations and Airbnb license requirements directly with local government authorities for Florissant to ensure full compliance before hosting.
(Source: AirROI data, 2026, finding no licensed listings among those analyzed)
Top Performing Airbnb Properties in Florissant (2026)
Benchmark your potential! Explore examples of top-performing Airbnb properties in Florissantbased on Trailing Twelve Month (TTM) revenue. Analyze their characteristics, revenue, occupancy rate, and ADR to understand what drives success in this market.
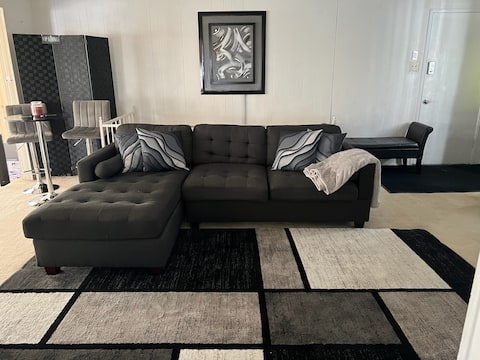
Suite Adventures (Whole House)
Entire Place • 3 bedrooms

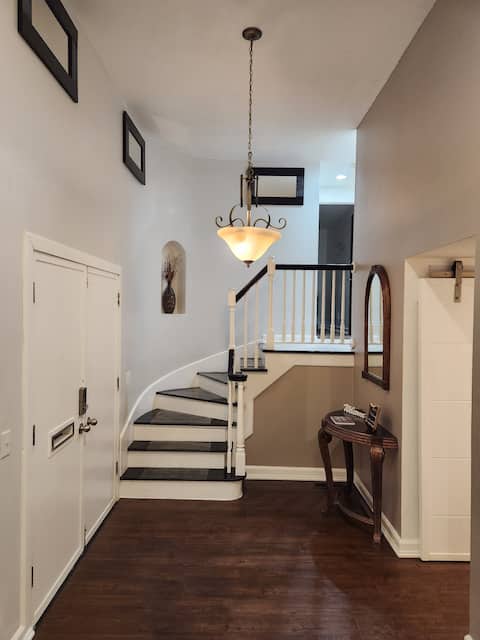
Cheerful 4-bedroom home with fireplace
Entire Place • 4 bedrooms
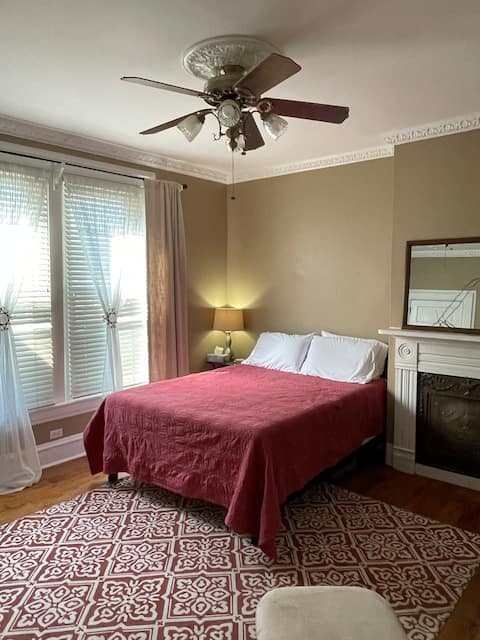
Recently Renovated Townhome
Entire Place • 2 bedrooms
Florissant's Old Town Inn (2 BR)
Entire Place • 2 bedrooms

Florissant's Old Town Inn (1 BR)
Entire Place • 1 bedroom

Florissant's Old Town Inn (3BR)
Entire Place • 3 bedrooms
Note: Performance varies based on location, size, amenities, seasonality, and management quality. Data reflects the past 12 months.
Top Performing Airbnb Hosts in Florissant (2026)
Learn from the best! This table showcases top-performing Airbnb hosts in Florissant based on the number of properties managed and estimated total revenue over the past year. Analyze their scale and performance metrics.
| Host Name | Properties | Grossing Revenue | Stay Reviews | Avg Rating |
|---|---|---|---|---|
| Adisa | 1 | $73,823 | 68 | 4.76/5.0 |
| Kathy | 3 | $69,393 | 77 | 4.94/5.0 |
| Spring | 1 | $49,124 | 118 | 4.92/5.0 |
| Aaron | 1 | $31,142 | 63 | 4.83/5.0 |
| RyanAshleah | 1 | $18,052 | 16 | 4.94/5.0 |
| Bee | 2 | $17,690 | 8 | 5.00/5.0 |
| Makayla | 1 | $12,931 | 25 | 4.64/5.0 |
| Natasha | 1 | $11,102 | 28 | 4.89/5.0 |
| Jared | 1 | $10,094 | 15 | 4.13/5.0 |
| Kate | 1 | $7,963 | 145 | 4.83/5.0 |
Analyzing the strategies of top hosts, such as their property selection, pricing, and guest communication, can offer valuable lessons for optimizing your own Airbnb operations in Florissant.
Dive Deeper: Advanced Florissant STR Market Data (2026)
Ready to unlock more insights? AirROI provides access to advanced metrics and comprehensive Airbnb data for Florissant. Explore detailed analytics beyond this report to refine your investment strategy, optimize pricing, and maximize your vacation rental profits.
Explore Advanced MetricsFlorissant Short-Term Rental Market Composition (2026): Property & Room Types
Room Type Distribution
Property Type Distribution
Market Composition Insights for Florissant
- The Florissant Airbnb market composition is heavily skewed towards Entire Home/Apt listings, which make up 70.8% of the 24 active rentals. This indicates strong guest preference for privacy and space.
- Looking at the property type distribution in Florissant, House properties are the most common (75%), reflecting the local real estate landscape.
- Houses represent a significant 75% portion, catering likely to families or larger groups.
Florissant Airbnb Room Capacity Analysis (2026): Bedroom Distribution
Distribution of Listings by Number of Bedrooms
Room Capacity Insights for Florissant
- The dominant room capacity in Florissant is 3 bedrooms listings, making up 25% of the market. This suggests a strong demand for properties suitable for families or small groups.
- Together, 3 bedrooms and 2 bedrooms properties represent 45.8% of the active Airbnb listings in Florissant, indicating a high concentration in these sizes.
- A significant 37.5% of listings offer 3+ bedrooms, catering to larger groups and families seeking more space in Florissant.
Florissant Vacation Rental Guest Capacity Trends (2026)
Distribution of Listings by Guest Capacity
Guest Capacity Insights for Florissant
- The most common guest capacity trend in Florissant vacation rentals is listings accommodating 8+ guests (16.7%). This suggests the primary traveler segment is likely larger groups.
- Properties designed for 8+ guests and 6 guests dominate the Florissant STR market, accounting for 29.2% of listings.
- 37.5% of properties accommodate 6+ guests, serving the market segment for larger families or group travel in Florissant.
- On average, properties in Florissant are equipped to host 3.8 guests.
Florissant Airbnb Booking Patterns (2026): Available vs. Booked Days
Available Days Distribution
Booked Days Distribution
Booking Pattern Insights for Florissant
- The most common availability pattern in Florissant falls within the 271-366 days range, representing 62.5% of listings. This suggests many properties have significant open periods on their calendars.
- Approximately 91.7% of listings show high availability (181+ days open annually), indicating potential for increased bookings or specific owner usage patterns.
- For booked days, the 31-90 days range is most frequent in Florissant (37.5%), reflecting common guest stay durations or potential owner blocking patterns.
- A notable 8.3% of properties secure long booking periods (181+ days booked per year), highlighting successful long-term rental strategies or significant owner usage.
Florissant Airbnb Minimum Stay Requirements Analysis
Distribution of Listings by Minimum Night Requirement
1 Night
5 listings
20.8% of total
2 Nights
5 listings
20.8% of total
7-29 Nights
9 listings
37.5% of total
30+ Nights
5 listings
20.8% of total
Key Insights
- The most prevalent minimum stay requirement in Florissant is 7-29 Nights, adopted by 37.5% of listings. This highlights the market's preference for shorter, flexible bookings.
- A significant segment (20.8%) caters to monthly stays (30+ nights) in Florissant, pointing to opportunities in the extended-stay market.
Recommendations
- Align with the market by considering a 7-29 Nights minimum stay, as 37.5% of Florissant hosts use this setting.
- If feasible, allowing 1-night stays, especially midweek or during low season, could capture last-minute bookings, as only 20.8% currently do.
- Explore offering discounts for stays of 30+ nights to attract the 20.8% of the market seeking extended stays.
- Adjust minimum nights based on seasonality – potentially shorter during low season and longer during peak demand periods in Florissant.
Florissant Airbnb Cancellation Policy Trends Analysis (2026)
Flexible
10 listings
41.7% of total
Moderate
6 listings
25% of total
Firm
2 listings
8.3% of total
Strict
6 listings
25% of total
Cancellation Policy Insights for Florissant
- The prevailing Airbnb cancellation policy trend in Florissant is Flexible, used by 41.7% of listings.
- There's a relatively balanced mix between guest-friendly (66.7%) and stricter (33.3%) policies, offering choices for different guest needs.
Recommendations for Hosts
- Consider adopting a Flexible policy to align with the 41.7% market standard in Florissant.
- Regularly review your cancellation policy against competitors and market demand shifts in Florissant.
Florissant STR Booking Lead Time Analysis (2026)
Average Booking Lead Time by Month
Booking Lead Time Insights for Florissant
- The overall average booking lead time for vacation rentals in Florissant is 23 days.
- Guests book furthest in advance for stays during November (average 49 days), likely coinciding with peak travel demand or local events.
- The shortest booking windows occur for stays in February (average 20 days), indicating more last-minute travel plans during this time.
- Seasonally, Fall (43 days avg.) sees the longest lead times, while Winter (24 days avg.) has the shortest, reflecting typical travel planning cycles.
Recommendations for Hosts
- Use the overall average lead time (23 days) as a baseline for your pricing and availability strategy in Florissant.
- For November stays, consider implementing length-of-stay discounts or slightly higher rates for bookings made less than 49 days out to capitalize on advance planning.
- Target marketing efforts for the Fall season well in advance (at least 43 days) to capture early planners.
- Monitor your own booking lead times against these Florissant averages to identify opportunities for dynamic pricing adjustments.
Popular & Essential Airbnb Amenities in Florissant (2026)
Amenity Prevalence
Amenity Insights for Florissant
- Essential amenities in Florissant that guests expect include: Wifi, TV, Air conditioning, Free parking on premises, Smoke alarm, Carbon monoxide alarm, Kitchen. Lacking these (any) could significantly impact bookings.
- Popular amenities like Heating, Hot water, Iron are common but not universal. Offering these can provide a competitive edge.
Recommendations for Hosts
- Ensure your listing includes all essential amenities for Florissant: Wifi, TV, Air conditioning, Free parking on premises, Smoke alarm, Carbon monoxide alarm, Kitchen.
- Prioritize adding missing essentials: Carbon monoxide alarm, Kitchen.
- Consider adding popular differentiators like Heating or Hot water to increase appeal.
- Highlight unique or less common amenities you offer (e.g., hot tub, dedicated workspace, EV charger) in your listing description and photos.
- Regularly check competitor amenities in Florissant to stay competitive.
Florissant Airbnb Guest Demographics & Profile Analysis (2026)
Guest Profile Summary for Florissant
- The typical guest profile for Airbnb in Florissant consists of primarily domestic travelers (99%), often arriving from nearby St. Louis, typically belonging to the Post-2000s (Gen Z/Alpha) group (50%), primarily speaking English or Spanish.
- Domestic travelers account for 98.9% of guests.
- Key international markets include United States (98.9%) and DC (1.1%).
- Top languages spoken are English (77.1%) followed by Spanish (14.6%).
- A significant demographic segment is the Post-2000s (Gen Z/Alpha) group, representing 50% of guests.
Recommendations for Hosts
- Target domestic marketing efforts towards travelers from St. Louis and Atlanta.
- Tailor amenities and listing descriptions to appeal to the dominant Post-2000s (Gen Z/Alpha) demographic (e.g., highlight fast WiFi, smart home features, local guides).
- Highlight unique local experiences or amenities relevant to the primary guest profile.
- Consider seasonal promotions aligned with peak travel times for key origin markets.
Nearby Short-Term Rental Market Comparison
How does the Florissant Airbnb market stack up against its neighbors? Compare key performance metrics like average monthly revenue, ADR, and occupancy rates in surrounding areas to understand the broader regional STR landscape.
| Market | Active Properties | Monthly Revenue | Daily Rate | Avg. Occupancy |
|---|---|---|---|---|
| Wright City | 13 | $4,135 | $455.44 | 37% |
| Innsbrook | 199 | $4,100 | $422.60 | 35% |
| Ste. Genevieve | 13 | $3,781 | $375.74 | 36% |
| Creve Coeur | 10 | $3,420 | $282.01 | 42% |
| Makanda | 19 | $3,145 | $247.99 | 51% |
| Godfrey | 10 | $3,077 | $217.89 | 50% |
| Maryland Heights | 19 | $2,989 | $219.63 | 55% |
| Wentzville | 19 | $2,964 | $195.63 | 51% |
| Saint Charles | 159 | $2,907 | $214.21 | 50% |
| O’Fallon | 38 | $2,897 | $225.47 | 51% |