Ferguson Airbnb Market Analysis 2025: Short Term Rental Data & Vacation Rental Statistics in Missouri, United States
Is Airbnb profitable in Ferguson in 2025? Explore comprehensive Airbnb analytics for Ferguson, Missouri, United States to uncover income potential. This 2025 STR market report for Ferguson, based on AirROI data from December 2024 to November 2025, reveals key trends in the niche market of 19 active listings.
Whether you're considering an Airbnb investment in Ferguson, optimizing your existing vacation rental, or exploring rental arbitrage opportunities, understanding the Ferguson Airbnb data is crucial. Leveraging the low regulation environment is key to maximizing your short term rental income potential. Let's dive into the specifics.
Key Ferguson Airbnb Performance Metrics Overview
Monthly Airbnb Revenue Variations & Income Potential in Ferguson (2025)
Understanding the monthly revenue variations for Airbnb listings in Ferguson is key to maximizing your short term rental income potential. Seasonality significantly impacts earnings. Our analysis, based on data from the past 12 months, shows that the peak revenue month for STRs in Ferguson is typically August, while February often presents the lowest earnings, highlighting opportunities for strategic pricing adjustments during shoulder and low seasons. Explore the typical Airbnb income in Ferguson across different performance tiers:
- Best-in-class properties (Top 10%) achieve $4,153+ monthly, often utilizing dynamic pricing and superior guest experiences.
- Strong performing properties (Top 25%) earn $3,092 or more, indicating effective management and desirable locations/amenities.
- Typical properties (Median) generate around $1,876 per month, representing the average market performance.
- Entry-level properties (Bottom 25%) see earnings around $952, often with potential for optimization.
Average Monthly Airbnb Earnings Trend in Ferguson
Ferguson Airbnb Occupancy Rate Trends (2025)
Maximize your bookings by understanding the Ferguson STR occupancy trends. Seasonal demand shifts significantly influence how often properties are booked. Typically, Junesees the highest demand (peak season occupancy), while October experiences the lowest (low season). Effective strategies, like adjusting minimum stays or offering promotions, can boost occupancy during slower periods. Here's how different property tiers perform in Ferguson:
- Best-in-class properties (Top 10%) achieve 82%+ occupancy, indicating high desirability and potentially optimized availability.
- Strong performing properties (Top 25%) maintain 68% or higher occupancy, suggesting good market fit and guest satisfaction.
- Typical properties (Median) have an occupancy rate around 48%.
- Entry-level properties (Bottom 25%) average 26% occupancy, potentially facing higher vacancy.
Average Monthly Occupancy Rate Trend in Ferguson
Average Daily Rate (ADR) Airbnb Trends in Ferguson (2025)
Effective short term rental pricing strategy in Ferguson involves understanding monthly ADR fluctuations. The Average Daily Rate (ADR) for Airbnb in Ferguson typically peaks in October and dips lowest during April. Leveraging Airbnb dynamic pricing tools or strategies based on this seasonality can significantly boost revenue. Here's a look at the typical nightly rates achieved:
- Best-in-class properties (Top 10%) command rates of $236+ per night, often due to premium features or locations.
- Strong performing properties (Top 25%) achieve nightly rates of $162 or more.
- Typical properties (Median) charge around $115 per night.
- Entry-level properties (Bottom 25%) earn around $86 per night.
Average Daily Rate (ADR) Trend by Month in Ferguson
Get Live Ferguson Market Intelligence 👇

Explore Real-time Analytics
Airbnb Seasonality Analysis & Trends in Ferguson (2025)
Peak Season (August, June, July)
- Revenue averages $3,231 per month
- Occupancy rates average 60.9%
- Daily rates average $156
Shoulder Season
- Revenue averages $2,076 per month
- Occupancy maintains around 47.4%
- Daily rates hold near $152
Low Season (January, February, December)
- Revenue drops to average $1,354 per month
- Occupancy decreases to average 40.4%
- Daily rates adjust to average $137
Seasonality Insights for Ferguson
- The Airbnb seasonality in Ferguson shows highly seasonal trends requiring careful strategy. While the sections above show seasonal averages, it's also insightful to look at the extremes:
- During the high season, the absolute peak month showcases Ferguson's highest earning potential, with monthly revenues capable of climbing to $3,395, occupancy reaching a high of 64.2%, and ADRs peaking at $171.
- Conversely, the slowest single month of the year, typically falling within the low season, marks the market's lowest point. In this month, revenue might dip to $1,135, occupancy could drop to 33.5%, and ADRs may adjust down to $132.
- Understanding both the seasonal averages and these monthly peaks and troughs in revenue, occupancy, and ADR is crucial for maximizing your Airbnb profit potential in Ferguson.
Seasonal Strategies for Maximizing Profit
- Peak Season: Maximize revenue through premium pricing and potentially longer minimum stays. Ensure high availability.
- Low Season: Offer competitive pricing, special promotions (e.g., extended stay discounts), and flexible cancellation policies. Target off-season travelers like remote workers or budget-conscious guests.
- Shoulder Seasons: Implement dynamic pricing that balances peak and low rates. Target weekend travelers or specific events. Offer slightly more flexible terms than peak season.
- Regularly analyze your own performance against these Ferguson seasonality benchmarks and adjust your pricing and availability strategy accordingly.
Best Areas for Airbnb Investment in Ferguson (2025)
Exploring the top neighborhoods for short-term rentals in Ferguson? This section highlights key areas, outlining why they are attractive for hosts and guests, along with notable local attractions. Consider these locations based on your target guest profile and investment strategy.
| Neighborhood / Area | Why Host Here? (Target Guests & Appeal) | Key Attractions & Landmarks |
|---|---|---|
| Township | A suburban area with family-oriented communities and proximity to schools and parks. Ideal for hosting families looking for comfortable stays in a quiet environment. | Ferguson Community Center, January-Wabash Park, Ferguson Park, Historic Downtown Ferguson, McCluer High School |
| Greensfield | A neighborhood known for its spacious homes and neighborhood parks. Attractive for longer-term rentals and families seeking a peaceful residential area. | Ferguson Municipal Public Library, Greensfield Park, Northwoods Park, St. Louis Soccer Park |
| West Ferguson | Offers easy access to major highways and is close to various local businesses. Great for those looking for convenience and connectivity in their stay. | West Florissant Avenue, Nolan's Bar and Grill, Northpark Shopping Center, Ferguson Skatepark |
| Ferguson Heights | A quaint neighborhood known for its strong sense of community and local vibe. Good for hosting small families and visitors looking for a local experience. | Ferguson Farmers Market, Ferguson Brewing Company, Ferguson Historical Society, City of Ferguson Community Garden |
| North Park | A primarily residential area with parks and green spaces. Ideal for those who prefer a quieter, suburban feel while still close to amenities. | Little Creek Park, North Park Recreational Center, The City Park, Bois D'Arc Park |
| Downtown Ferguson | The heart of the city with local shops and dining options. Perfect for travelers wanting to explore local culture and activities. | Ferguson Theater, Local boutiques, Multiple Restaurants, Art galleries |
| South Ferguson | A developing area with new businesses and amenities. Ideal for investment with the potential for growth due to ongoing developments. | Castle Park, Southwest Park, Nearby shopping centers, Community events |
| West Florissant Avenue | A hub of commercial activity with numerous dining and shopping options. Attracts business travelers and those looking for convenience. | Commercial strip with various stores, Restaurants, Service centers, Eateries nearby |
Understanding Airbnb License Requirements & STR Laws in Ferguson (2025)
While Ferguson, Missouri, United States currently shows low STR regulations, specific Airbnb license requirements might still exist or change. Always verify the latest short term rental regulations and Airbnb license requirements directly with local government authorities for Ferguson to ensure full compliance before hosting.
(Source: AirROI data, 2025, finding no licensed listings among those analyzed)
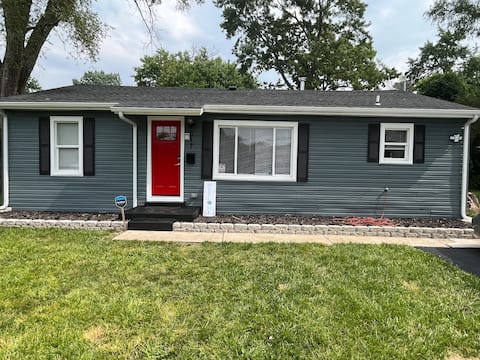
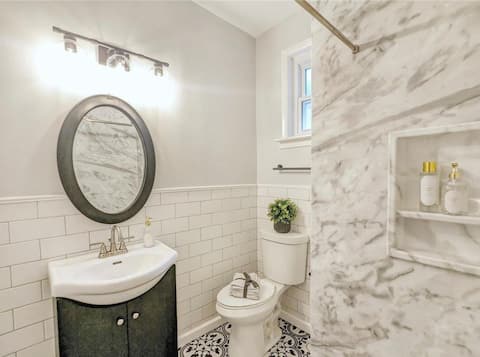
Top Performing Airbnb Properties in Ferguson (2025)
Benchmark your potential! Explore examples of top-performing Airbnb properties in Fergusonbased on Trailing Twelve Month (TTM) revenue. Analyze their characteristics, revenue, occupancy rate, and ADR to understand what drives success in this market.

4 bedroom spacious oasis with game room, sleeps 11
Entire Place • 4 bedrooms

Gorgeous Downtown Ferguson Home
Entire Place • 3 bedrooms
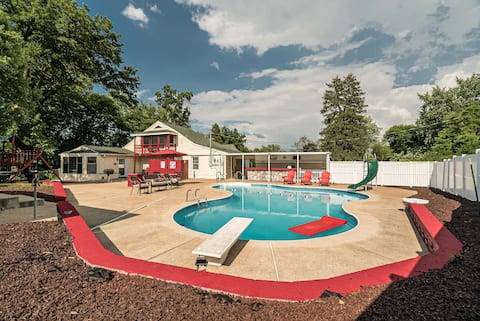
Covenant Retreat Resort Style Vacation Home w/Pool
Entire Place • 3 bedrooms
Leopardprint CO.Executive Suite#1
Entire Place • 3 bedrooms
Stylish and Classy Home for You
Entire Place • 3 bedrooms

Blue Blossom Loft
Entire Place • 2 bedrooms
Note: Performance varies based on location, size, amenities, seasonality, and management quality. Data reflects the past 12 months.
Top Performing Airbnb Hosts in Ferguson (2025)
Learn from the best! This table showcases top-performing Airbnb hosts in Ferguson based on the number of properties managed and estimated total revenue over the past year. Analyze their scale and performance metrics.
| Host Name | Properties | Grossing Revenue | Stay Reviews | Avg Rating |
|---|---|---|---|---|
| Joy And Associates | 3 | $73,991 | 234 | 4.85/5.0 |
| Patrick | 4 | $48,451 | 130 | 4.73/5.0 |
| Jefferson R Jr | 2 | $45,151 | 47 | 4.68/5.0 |
| Lynette | 1 | $35,631 | 22 | 4.82/5.0 |
| Anthony | 1 | $35,195 | 26 | 4.58/5.0 |
| Shawana | 1 | $32,993 | 34 | 4.85/5.0 |
| Garland | 1 | $20,624 | 34 | 4.71/5.0 |
| LeShae | 1 | $14,617 | 7 | 4.57/5.0 |
| Lavish | 1 | $11,202 | 2 | Not Rated |
| Elcardo | 1 | $9,372 | 6 | 4.67/5.0 |
Analyzing the strategies of top hosts, such as their property selection, pricing, and guest communication, can offer valuable lessons for optimizing your own Airbnb operations in Ferguson.
Dive Deeper: Advanced Ferguson STR Market Data (2025)
Ready to unlock more insights? AirROI provides access to advanced metrics and comprehensive Airbnb data for Ferguson. Explore detailed analytics beyond this report to refine your investment strategy, optimize pricing, and maximize your vacation rental profits.
Explore Advanced MetricsFerguson Short-Term Rental Market Composition (2025): Property & Room Types
Room Type Distribution
Property Type Distribution
Market Composition Insights for Ferguson
- The Ferguson Airbnb market composition is heavily skewed towards Entire Home/Apt listings, which make up 94.7% of the 19 active rentals. This indicates strong guest preference for privacy and space.
- Looking at the property type distribution in Ferguson, House properties are the most common (73.7%), reflecting the local real estate landscape.
- Houses represent a significant 73.7% portion, catering likely to families or larger groups.
Ferguson Airbnb Room Capacity Analysis (2025): Bedroom Distribution
Distribution of Listings by Number of Bedrooms
Room Capacity Insights for Ferguson
- The dominant room capacity in Ferguson is 2 bedrooms listings, making up 47.4% of the market. This suggests a strong demand for properties suitable for couples or solo travelers.
- Together, 2 bedrooms and 3 bedrooms properties represent 79.0% of the active Airbnb listings in Ferguson, indicating a high concentration in these sizes.
- A significant 42.1% of listings offer 3+ bedrooms, catering to larger groups and families seeking more space in Ferguson.
Ferguson Vacation Rental Guest Capacity Trends (2025)
Distribution of Listings by Guest Capacity
Guest Capacity Insights for Ferguson
- The most common guest capacity trend in Ferguson vacation rentals is listings accommodating 6 guests (31.6%). This suggests the primary traveler segment is likely larger groups.
- Properties designed for 6 guests and 4 guests dominate the Ferguson STR market, accounting for 57.9% of listings.
- 58.0% of properties accommodate 6+ guests, serving the market segment for larger families or group travel in Ferguson.
- On average, properties in Ferguson are equipped to host 5.4 guests.
Ferguson Airbnb Booking Patterns (2025): Available vs. Booked Days
Available Days Distribution
Booked Days Distribution
Booking Pattern Insights for Ferguson
- The most common availability pattern in Ferguson falls within the 181-270 days range, representing 42.1% of listings. This suggests many properties have significant open periods on their calendars.
- Approximately 78.9% of listings show high availability (181+ days open annually), indicating potential for increased bookings or specific owner usage patterns.
- For booked days, the 91-180 days range is most frequent in Ferguson (47.4%), reflecting common guest stay durations or potential owner blocking patterns.
- A notable 21.1% of properties secure long booking periods (181+ days booked per year), highlighting successful long-term rental strategies or significant owner usage.
Ferguson Airbnb Minimum Stay Requirements Analysis
Distribution of Listings by Minimum Night Requirement
1 Night
3 listings
15.8% of total
2 Nights
8 listings
42.1% of total
3 Nights
2 listings
10.5% of total
4-6 Nights
3 listings
15.8% of total
30+ Nights
3 listings
15.8% of total
Key Insights
- The most prevalent minimum stay requirement in Ferguson is 2 Nights, adopted by 42.1% of listings. This highlights the market's preference for shorter, flexible bookings.
- A significant segment (15.8%) caters to monthly stays (30+ nights) in Ferguson, pointing to opportunities in the extended-stay market.
Recommendations
- Align with the market by considering a 2 Nights minimum stay, as 42.1% of Ferguson hosts use this setting.
- If feasible, allowing 1-night stays, especially midweek or during low season, could capture last-minute bookings, as only 15.8% currently do.
- A 2-night minimum appears standard (42.1%). Consider this for weekends or peak periods.
- Explore offering discounts for stays of 30+ nights to attract the 15.8% of the market seeking extended stays.
- Adjust minimum nights based on seasonality – potentially shorter during low season and longer during peak demand periods in Ferguson.
Ferguson Airbnb Cancellation Policy Trends Analysis (2025)
Flexible
8 listings
42.1% of total
Moderate
3 listings
15.8% of total
Firm
7 listings
36.8% of total
Strict
1 listings
5.3% of total
Cancellation Policy Insights for Ferguson
- The prevailing Airbnb cancellation policy trend in Ferguson is Flexible, used by 42.1% of listings.
- There's a relatively balanced mix between guest-friendly (57.9%) and stricter (42.1%) policies, offering choices for different guest needs.
- Strict cancellation policies are quite rare (5.3%), potentially making listings with this policy less competitive unless justified by high demand or property type.
Recommendations for Hosts
- Consider adopting a Flexible policy to align with the 42.1% market standard in Ferguson.
- Using a Strict policy might deter some guests, as only 5.3% of listings use it. Evaluate if potential revenue protection outweighs possible lower booking rates.
- Regularly review your cancellation policy against competitors and market demand shifts in Ferguson.
Ferguson STR Booking Lead Time Analysis (2025)
Average Booking Lead Time by Month
Booking Lead Time Insights for Ferguson
- The overall average booking lead time for vacation rentals in Ferguson is 36 days.
- Guests book furthest in advance for stays during July (average 62 days), likely coinciding with peak travel demand or local events.
- The shortest booking windows occur for stays in February (average 11 days), indicating more last-minute travel plans during this time.
- Seasonally, Summer (46 days avg.) sees the longest lead times, while Winter (19 days avg.) has the shortest, reflecting typical travel planning cycles.
Recommendations for Hosts
- Use the overall average lead time (36 days) as a baseline for your pricing and availability strategy in Ferguson.
- For July stays, consider implementing length-of-stay discounts or slightly higher rates for bookings made less than 62 days out to capitalize on advance planning.
- During February, focus on last-minute booking availability and promotions, as guests book with very short notice (11 days avg.).
- Target marketing efforts for the Summer season well in advance (at least 46 days) to capture early planners.
- Monitor your own booking lead times against these Ferguson averages to identify opportunities for dynamic pricing adjustments.
Popular & Essential Airbnb Amenities in Ferguson (2025)
Amenity Prevalence
Amenity Insights for Ferguson
- Essential amenities in Ferguson that guests expect include: Wifi, Kitchen, Air conditioning. Lacking these (any) could significantly impact bookings.
- Popular amenities like TV, Hot water, Carbon monoxide alarm are common but not universal. Offering these can provide a competitive edge.
Recommendations for Hosts
- Ensure your listing includes all essential amenities for Ferguson: Wifi, Kitchen, Air conditioning.
- Consider adding popular differentiators like TV or Hot water to increase appeal.
- Highlight unique or less common amenities you offer (e.g., hot tub, dedicated workspace, EV charger) in your listing description and photos.
- Regularly check competitor amenities in Ferguson to stay competitive.
Ferguson Airbnb Guest Demographics & Profile Analysis (2025)
Guest Profile Summary for Ferguson
- The typical guest profile for Airbnb in Ferguson consists of primarily domestic travelers (98%), often arriving from nearby St. Louis, typically belonging to the Post-2000s (Gen Z/Alpha) group (50%), primarily speaking English or Spanish.
- Domestic travelers account for 97.5% of guests.
- Key international markets include United States (97.5%) and Canada (1.3%).
- Top languages spoken are English (78.7%) followed by Spanish (12.8%).
- A significant demographic segment is the Post-2000s (Gen Z/Alpha) group, representing 50% of guests.
Recommendations for Hosts
- Target domestic marketing efforts towards travelers from St. Louis and Chicago.
- Tailor amenities and listing descriptions to appeal to the dominant Post-2000s (Gen Z/Alpha) demographic (e.g., highlight fast WiFi, smart home features, local guides).
- Highlight unique local experiences or amenities relevant to the primary guest profile.
- Consider seasonal promotions aligned with peak travel times for key origin markets.
Nearby Short-Term Rental Market Comparison
How does the Ferguson Airbnb market stack up against its neighbors? Compare key performance metrics like average monthly revenue, ADR, and occupancy rates in surrounding areas to understand the broader regional STR landscape.
| Market | Active Properties | Monthly Revenue | Daily Rate | Avg. Occupancy |
|---|---|---|---|---|
| Innsbrook | 193 | $4,238 | $427.10 | 34% |
| Wright City | 13 | $3,998 | $444.31 | 39% |
| Ste. Genevieve | 13 | $3,990 | $384.20 | 37% |
| Makanda | 19 | $3,268 | $251.89 | 53% |
| Godfrey | 10 | $3,138 | $221.35 | 49% |
| O’Fallon | 38 | $3,087 | $223.40 | 52% |
| Wentzville | 20 | $2,977 | $192.84 | 50% |
| Centralia | 17 | $2,955 | $236.53 | 50% |
| Harvester | 16 | $2,928 | $222.60 | 48% |
| Saint Charles | 160 | $2,897 | $216.15 | 50% |