Camdenton Airbnb Market Analysis 2026: Short Term Rental Data & Vacation Rental Statistics in Missouri, United States
Is Airbnb profitable in Camdenton in 2026? Explore comprehensive Airbnb analytics for Camdenton, Missouri, United States to uncover income potential. This 2026 STR market report for Camdenton, based on AirROI data from February 2025 to January 2026, reveals key trends in the niche market of 199 active listings.
Whether you're considering an Airbnb investment in Camdenton, optimizing your existing vacation rental, or exploring rental arbitrage opportunities, understanding the Camdenton Airbnb data is crucial. Leveraging the low regulation environment is key to maximizing your short term rental income potential. Let's dive into the specifics.
Key Camdenton Airbnb Performance Metrics Overview
Monthly Airbnb Revenue Variations & Income Potential in Camdenton (2026)
Understanding the monthly revenue variations for Airbnb listings in Camdenton is key to maximizing your short term rental income potential. Seasonality significantly impacts earnings. Our analysis, based on data from the past 12 months, shows that the peak revenue month for STRs in Camdenton is typically July, while February often presents the lowest earnings, highlighting opportunities for strategic pricing adjustments during shoulder and low seasons. Explore the typical Airbnb income in Camdenton across different performance tiers:
- Best-in-class properties (Top 10%) achieve $6,206+ monthly, often utilizing dynamic pricing and superior guest experiences.
- Strong performing properties (Top 25%) earn $3,587 or more, indicating effective management and desirable locations/amenities.
- Typical properties (Median) generate around $2,012 per month, representing the average market performance.
- Entry-level properties (Bottom 25%) see earnings around $1,170, often with potential for optimization.
Average Monthly Airbnb Earnings Trend in Camdenton
Camdenton Airbnb Occupancy Rate Trends (2026)
Maximize your bookings by understanding the Camdenton STR occupancy trends. Seasonal demand shifts significantly influence how often properties are booked. Typically, Julysees the highest demand (peak season occupancy), while January experiences the lowest (low season). Effective strategies, like adjusting minimum stays or offering promotions, can boost occupancy during slower periods. Here's how different property tiers perform in Camdenton:
- Best-in-class properties (Top 10%) achieve 62%+ occupancy, indicating high desirability and potentially optimized availability.
- Strong performing properties (Top 25%) maintain 42% or higher occupancy, suggesting good market fit and guest satisfaction.
- Typical properties (Median) have an occupancy rate around 27%.
- Entry-level properties (Bottom 25%) average 15% occupancy, potentially facing higher vacancy.
Average Monthly Occupancy Rate Trend in Camdenton
Average Daily Rate (ADR) Airbnb Trends in Camdenton (2026)
Effective short term rental pricing strategy in Camdenton involves understanding monthly ADR fluctuations. The Average Daily Rate (ADR) for Airbnb in Camdenton typically peaks in July and dips lowest during February. Leveraging Airbnb dynamic pricing tools or strategies based on this seasonality can significantly boost revenue. Here's a look at the typical nightly rates achieved:
- Best-in-class properties (Top 10%) command rates of $594+ per night, often due to premium features or locations.
- Strong performing properties (Top 25%) achieve nightly rates of $388 or more.
- Typical properties (Median) charge around $261 per night.
- Entry-level properties (Bottom 25%) earn around $173 per night.
Average Daily Rate (ADR) Trend by Month in Camdenton
Get Live Camdenton Market Intelligence 👇

Explore Real-time Analytics
Airbnb Seasonality Analysis & Trends in Camdenton (2026)
Peak Season (July, June, August)
- Revenue averages $5,706 per month
- Occupancy rates average 48.5%
- Daily rates average $379
Shoulder Season
- Revenue averages $2,294 per month
- Occupancy maintains around 26.4%
- Daily rates hold near $317
Low Season (January, February, April)
- Revenue drops to average $1,649 per month
- Occupancy decreases to average 22.0%
- Daily rates adjust to average $294
Seasonality Insights for Camdenton
- The Airbnb seasonality in Camdenton shows highly seasonal trends requiring careful strategy. While the sections above show seasonal averages, it's also insightful to look at the extremes:
- During the high season, the absolute peak month showcases Camdenton's highest earning potential, with monthly revenues capable of climbing to $7,125, occupancy reaching a high of 58.3%, and ADRs peaking at $385.
- Conversely, the slowest single month of the year, typically falling within the low season, marks the market's lowest point. In this month, revenue might dip to $1,573, occupancy could drop to 14.5%, and ADRs may adjust down to $274.
- Understanding both the seasonal averages and these monthly peaks and troughs in revenue, occupancy, and ADR is crucial for maximizing your Airbnb profit potential in Camdenton.
Seasonal Strategies for Maximizing Profit
- Peak Season: Maximize revenue through premium pricing and potentially longer minimum stays. Ensure high availability.
- Low Season: Offer competitive pricing, special promotions (e.g., extended stay discounts), and flexible cancellation policies. Target off-season travelers like remote workers or budget-conscious guests.
- Shoulder Seasons: Implement dynamic pricing that balances peak and low rates. Target weekend travelers or specific events. Offer slightly more flexible terms than peak season.
- Regularly analyze your own performance against these Camdenton seasonality benchmarks and adjust your pricing and availability strategy accordingly.
Best Areas for Airbnb Investment in Camdenton (2026)
Exploring the top neighborhoods for short-term rentals in Camdenton? This section highlights key areas, outlining why they are attractive for hosts and guests, along with notable local attractions. Consider these locations based on your target guest profile and investment strategy.
| Neighborhood / Area | Why Host Here? (Target Guests & Appeal) | Key Attractions & Landmarks |
|---|---|---|
| Lake of the Ozarks | A premier destination for outdoor enthusiasts, the Lake of the Ozarks attracts visitors year-round for its beautiful lakes, fishing, boating, and vibrant nightlife. Ideal for vacation rentals seeking a mix of adventure and relaxation. | Lake of the Ozarks State Park, Ha Ha Tonka State Park, Ozark Caverns, Bagnell Dam, Powell Gardens |
| Camdenton Historic District | The charming historic district offers a glimpse into the area's past with quaint shops and local eateries. It's a cozy spot for visitors wanting to experience a small-town atmosphere while being close to outdoor activities. | Camden County Museum, Camdenton City Park, Local antique shops, Dining options like El Rancho, Historical buildings |
| Ozark Amphitheater | An exciting venue for live music and events, attracting visitors during concert seasons. Ideal for short-term rentals focused on event-goers and concert attendees during peak seasons. | Ozark Amphitheater, Live music events, Nearby dining options |
| Old Kinderhook | An upscale resort community featuring golf, lake access, and luxury accommodations. Popular for families and golf enthusiasts looking for a tranquil retreat near the lake. | Old Kinderhook Golf Course, Lake access and beaches, Spa and wellness centers, Dining at The Trophy Room |
| Hurricane Deck | Offering stunning views of the lake and abundant outdoor activities, Hurricane Deck is perfect for those seeking a picturesque stay with boating and fishing opportunities. | Boat rentals, Fishing spots, Hiking trails, Dining with lake views |
| Linn Creek | A quieter area still close to the lake, Linn Creek appeals to visitors looking for lakeside serenity and easy access to the Lake of the Ozarks attractions without the hustle. | Linn Creek Marina, Surrounding nature and parks, Close to larger towns like Camdenton |
| Niangua Bluff | A tranquil and scenic area that offers beautiful vistas and outdoor activities. Good for nature lovers and families looking for peaceful vacation spots away from the busy tourist spots. | Niangua River, Hiking trails, Kayaking and canoeing opportunities |
| Osage Beach | A bustling area known for its shopping, dining, and entertainment options. It's a hotspot for families and young adults looking for a lively atmosphere. | Osage Beach Premium Outlets, Sports bars and restaurants, Water parks and attractions |
Understanding Airbnb License Requirements & STR Laws in Camdenton (2026)
While Camdenton, Missouri, United States currently shows low STR regulations, specific Airbnb license requirements might still exist or change. Always verify the latest short term rental regulations and Airbnb license requirements directly with local government authorities for Camdenton to ensure full compliance before hosting.
(Source: AirROI data, 2026, finding no licensed listings among those analyzed)
Top Performing Airbnb Properties in Camdenton (2026)
Benchmark your potential! Explore examples of top-performing Airbnb properties in Camdentonbased on Trailing Twelve Month (TTM) revenue. Analyze their characteristics, revenue, occupancy rate, and ADR to understand what drives success in this market.
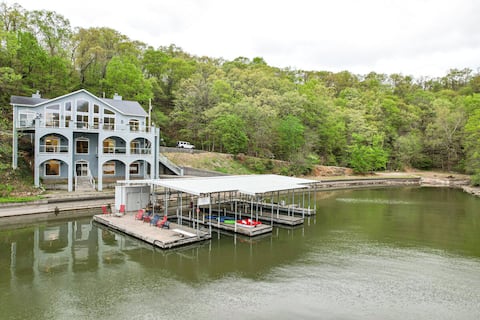
Luxury Home-Huge Dock- Fire Pit-Pool Table-Private
Entire Place • 7 bedrooms
Pool, Hot Tub & Pickleball Court: Lake Ozarks Home
Entire Place • 8 bedrooms
Lakefront House w/ Pool
Entire Place • 8 bedrooms
Private Lakefront Pool, Amazing Dock Sleeps 26
Entire Place • 5 bedrooms
Huge! Sleeps 30-Kayaks, Pedal Boat & Paddle Boards
Entire Place • 6 bedrooms
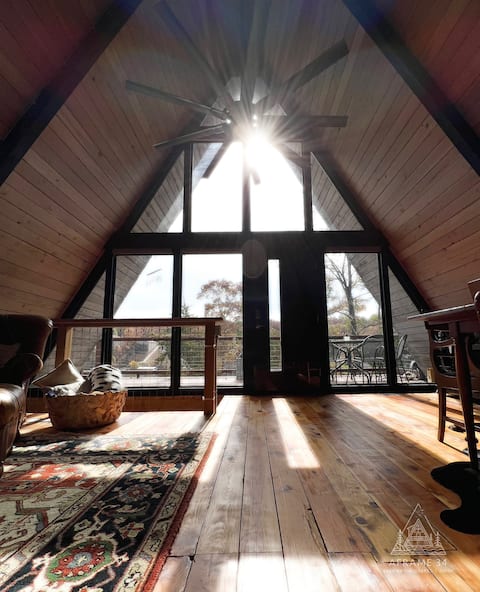
Aframe 34 ~ Hot Tub ~ Private Dock ~ Fire Pit
Entire Place • 5 bedrooms
Note: Performance varies based on location, size, amenities, seasonality, and management quality. Data reflects the past 12 months.
Top Performing Airbnb Hosts in Camdenton (2026)
Learn from the best! This table showcases top-performing Airbnb hosts in Camdenton based on the number of properties managed and estimated total revenue over the past year. Analyze their scale and performance metrics.
| Host Name | Properties | Grossing Revenue | Stay Reviews | Avg Rating |
|---|---|---|---|---|
| Pamela Quinn | 12 | $615,692 | 191 | 4.87/5.0 |
| Evolve | 22 | $610,990 | 303 | 4.79/5.0 |
| LOZ Vacations | 6 | $249,238 | 86 | 4.75/5.0 |
| Whitney | 7 | $245,794 | 180 | 4.90/5.0 |
| Evolve | 9 | $191,078 | 310 | 4.74/5.0 |
| Matthew | 7 | $159,705 | 820 | 4.92/5.0 |
| Kelley | 2 | $141,452 | 8 | 4.83/5.0 |
| Tia M | 3 | $141,399 | 46 | 4.63/5.0 |
| Grand Welcome Lake Of The Ozar | 4 | $133,945 | 72 | 4.88/5.0 |
| Manage|Me Properties | 4 | $129,077 | 113 | 4.87/5.0 |
Analyzing the strategies of top hosts, such as their property selection, pricing, and guest communication, can offer valuable lessons for optimizing your own Airbnb operations in Camdenton.
Dive Deeper: Advanced Camdenton STR Market Data (2026)
Ready to unlock more insights? AirROI provides access to advanced metrics and comprehensive Airbnb data for Camdenton. Explore detailed analytics beyond this report to refine your investment strategy, optimize pricing, and maximize your vacation rental profits.
Explore Advanced MetricsCamdenton Short-Term Rental Market Composition (2026): Property & Room Types
Room Type Distribution
Property Type Distribution
Market Composition Insights for Camdenton
- The Camdenton Airbnb market composition is heavily skewed towards Entire Home/Apt listings, which make up 94.5% of the 199 active rentals. This indicates strong guest preference for privacy and space.
- Looking at the property type distribution in Camdenton, House properties are the most common (52.8%), reflecting the local real estate landscape.
- Houses represent a significant 52.8% portion, catering likely to families or larger groups.
- Smaller segments like others (combined 1.0%) offer potential for unique stay experiences.
Camdenton Airbnb Room Capacity Analysis (2026): Bedroom Distribution
Distribution of Listings by Number of Bedrooms
Room Capacity Insights for Camdenton
- The dominant room capacity in Camdenton is 3 bedrooms listings, making up 32.2% of the market. This suggests a strong demand for properties suitable for families or small groups.
- Together, 3 bedrooms and 2 bedrooms properties represent 54.3% of the active Airbnb listings in Camdenton, indicating a high concentration in these sizes.
- A significant 64.9% of listings offer 3+ bedrooms, catering to larger groups and families seeking more space in Camdenton.
Camdenton Vacation Rental Guest Capacity Trends (2026)
Distribution of Listings by Guest Capacity
Guest Capacity Insights for Camdenton
- The most common guest capacity trend in Camdenton vacation rentals is listings accommodating 8+ guests (52.8%). This suggests the primary traveler segment is likely larger groups.
- Properties designed for 8+ guests and 6 guests dominate the Camdenton STR market, accounting for 73.4% of listings.
- 79.4% of properties accommodate 6+ guests, serving the market segment for larger families or group travel in Camdenton.
- On average, properties in Camdenton are equipped to host 6.5 guests.
Camdenton Airbnb Booking Patterns (2026): Available vs. Booked Days
Available Days Distribution
Booked Days Distribution
Booking Pattern Insights for Camdenton
- The most common availability pattern in Camdenton falls within the 271-366 days range, representing 67.8% of listings. This suggests many properties have significant open periods on their calendars.
- Approximately 97.4% of listings show high availability (181+ days open annually), indicating potential for increased bookings or specific owner usage patterns.
- For booked days, the 31-90 days range is most frequent in Camdenton (49.7%), reflecting common guest stay durations or potential owner blocking patterns.
- A notable 2.5% of properties secure long booking periods (181+ days booked per year), highlighting successful long-term rental strategies or significant owner usage.
Camdenton Airbnb Minimum Stay Requirements Analysis
Distribution of Listings by Minimum Night Requirement
1 Night
19 listings
9.5% of total
2 Nights
67 listings
33.7% of total
3 Nights
26 listings
13.1% of total
4-6 Nights
7 listings
3.5% of total
7-29 Nights
1 listings
0.5% of total
30+ Nights
79 listings
39.7% of total
Key Insights
- The most prevalent minimum stay requirement in Camdenton is 30+ Nights, adopted by 39.7% of listings. This highlights the market's preference for longer commitments.
- A significant segment (39.7%) caters to monthly stays (30+ nights) in Camdenton, pointing to opportunities in the extended-stay market.
Recommendations
- Align with the market by considering a 30+ Nights minimum stay, as 39.7% of Camdenton hosts use this setting.
- If feasible, allowing 1-night stays, especially midweek or during low season, could capture last-minute bookings, as only 9.5% currently do.
- A 2-night minimum appears standard (33.7%). Consider this for weekends or peak periods.
- Explore offering discounts for stays of 30+ nights to attract the 39.7% of the market seeking extended stays.
- Adjust minimum nights based on seasonality – potentially shorter during low season and longer during peak demand periods in Camdenton.
Camdenton Airbnb Cancellation Policy Trends Analysis (2026)
Super Strict 30 Days
21 listings
10.6% of total
Super Strict 60 Days
8 listings
4% of total
Limited
3 listings
1.5% of total
Flexible
14 listings
7% of total
Moderate
39 listings
19.6% of total
Firm
72 listings
36.2% of total
Strict
42 listings
21.1% of total
Cancellation Policy Insights for Camdenton
- The prevailing Airbnb cancellation policy trend in Camdenton is Firm, used by 36.2% of listings.
- A majority (57.3%) of hosts in Camdenton utilize Firm or Strict policies, indicating a market where hosts prioritize booking security.
Recommendations for Hosts
- Consider adopting a Firm policy to align with the 36.2% market standard in Camdenton.
- Regularly review your cancellation policy against competitors and market demand shifts in Camdenton.
Camdenton STR Booking Lead Time Analysis (2026)
Average Booking Lead Time by Month
Booking Lead Time Insights for Camdenton
- The overall average booking lead time for vacation rentals in Camdenton is 69 days.
- Guests book furthest in advance for stays during June (average 98 days), likely coinciding with peak travel demand or local events.
- The shortest booking windows occur for stays in March (average 24 days), indicating more last-minute travel plans during this time.
- Seasonally, Summer (86 days avg.) sees the longest lead times, while Winter (35 days avg.) has the shortest, reflecting typical travel planning cycles.
Recommendations for Hosts
- Use the overall average lead time (69 days) as a baseline for your pricing and availability strategy in Camdenton.
- For June stays, consider implementing length-of-stay discounts or slightly higher rates for bookings made less than 98 days out to capitalize on advance planning.
- Target marketing efforts for the Summer season well in advance (at least 86 days) to capture early planners.
- Monitor your own booking lead times against these Camdenton averages to identify opportunities for dynamic pricing adjustments.
Popular & Essential Airbnb Amenities in Camdenton (2026)
Amenity Prevalence
Amenity Insights for Camdenton
- Essential amenities in Camdenton that guests expect include: Air conditioning, Smoke alarm, TV, Kitchen, Free parking on premises. Lacking these (any) could significantly impact bookings.
- Popular amenities like Fire extinguisher, Wifi, Heating are common but not universal. Offering these can provide a competitive edge.
- Warning: Wifi is not universally provided but is considered essential globally. Ensure reliable Wifi is offered.
Recommendations for Hosts
- Ensure your listing includes all essential amenities for Camdenton: Air conditioning, Smoke alarm, TV, Kitchen, Free parking on premises.
- Prioritize adding missing essentials: Air conditioning, Smoke alarm, TV, Kitchen, Free parking on premises.
- Consider adding popular differentiators like Fire extinguisher or Wifi to increase appeal.
- Highlight unique or less common amenities you offer (e.g., hot tub, dedicated workspace, EV charger) in your listing description and photos.
- Regularly check competitor amenities in Camdenton to stay competitive.
Camdenton Airbnb Guest Demographics & Profile Analysis (2026)
Guest Profile Summary for Camdenton
- The typical guest profile for Airbnb in Camdenton consists of primarily domestic travelers (99%), often arriving from nearby Kansas City, typically belonging to the Post-2000s (Gen Z/Alpha) group (50%), primarily speaking English or Spanish.
- Domestic travelers account for 98.6% of guests.
- Key international markets include United States (98.6%) and United Kingdom (0.5%).
- Top languages spoken are English (80.4%) followed by Spanish (8.6%).
- A significant demographic segment is the Post-2000s (Gen Z/Alpha) group, representing 50% of guests.
Recommendations for Hosts
- Target domestic marketing efforts towards travelers from Kansas City and St. Louis.
- Tailor amenities and listing descriptions to appeal to the dominant Post-2000s (Gen Z/Alpha) demographic (e.g., highlight fast WiFi, smart home features, local guides).
- Highlight unique local experiences or amenities relevant to the primary guest profile.
- Consider seasonal promotions aligned with peak travel times for key origin markets.
Nearby Short-Term Rental Market Comparison
How does the Camdenton Airbnb market stack up against its neighbors? Compare key performance metrics like average monthly revenue, ADR, and occupancy rates in surrounding areas to understand the broader regional STR landscape.
| Market | Active Properties | Monthly Revenue | Daily Rate | Avg. Occupancy |
|---|---|---|---|---|
| Wright City | 13 | $4,135 | $455.44 | 37% |
| Innsbrook | 199 | $4,100 | $422.60 | 35% |
| Linn Creek | 28 | $3,665 | $404.65 | 37% |
| Sunrise Beach | 279 | $3,450 | $473.67 | 38% |
| Greenview | 11 | $3,219 | $428.61 | 42% |
| Gravois Mills | 133 | $2,984 | $395.30 | 37% |
| Friedenswald | 12 | $2,948 | $294.85 | 38% |
| Climax Springs | 32 | $2,826 | $398.65 | 33% |
| Roach | 27 | $2,741 | $376.61 | 42% |
| Rocheport | 20 | $2,716 | $349.48 | 36% |