Branson Airbnb Market Analysis 2026: Short Term Rental Data & Vacation Rental Statistics in Missouri, United States
Is Airbnb profitable in Branson in 2026? Explore comprehensive Airbnb analytics for Branson, Missouri, United States to uncover income potential. This 2026 STR market report for Branson, based on AirROI data from February 2025 to January 2026, reveals key trends in the bustling market of 2,943 active listings.
Whether you're considering an Airbnb investment in Branson, optimizing your existing vacation rental, or exploring rental arbitrage opportunities, understanding the Branson Airbnb data is crucial. Leveraging the low regulation environment is key to maximizing your short term rental income potential. Let's dive into the specifics.
Key Branson Airbnb Performance Metrics Overview
Monthly Airbnb Revenue Variations & Income Potential in Branson (2026)
Understanding the monthly revenue variations for Airbnb listings in Branson is key to maximizing your short term rental income potential. Seasonality significantly impacts earnings. Our analysis, based on data from the past 12 months, shows that the peak revenue month for STRs in Branson is typically July, while February often presents the lowest earnings, highlighting opportunities for strategic pricing adjustments during shoulder and low seasons. Explore the typical Airbnb income in Branson across different performance tiers:
- Best-in-class properties (Top 10%) achieve $6,680+ monthly, often utilizing dynamic pricing and superior guest experiences.
- Strong performing properties (Top 25%) earn $3,781 or more, indicating effective management and desirable locations/amenities.
- Typical properties (Median) generate around $2,215 per month, representing the average market performance.
- Entry-level properties (Bottom 25%) see earnings around $1,175, often with potential for optimization.
Average Monthly Airbnb Earnings Trend in Branson
Branson Airbnb Occupancy Rate Trends (2026)
Maximize your bookings by understanding the Branson STR occupancy trends. Seasonal demand shifts significantly influence how often properties are booked. Typically, Julysees the highest demand (peak season occupancy), while January experiences the lowest (low season). Effective strategies, like adjusting minimum stays or offering promotions, can boost occupancy during slower periods. Here's how different property tiers perform in Branson:
- Best-in-class properties (Top 10%) achieve 72%+ occupancy, indicating high desirability and potentially optimized availability.
- Strong performing properties (Top 25%) maintain 57% or higher occupancy, suggesting good market fit and guest satisfaction.
- Typical properties (Median) have an occupancy rate around 38%.
- Entry-level properties (Bottom 25%) average 21% occupancy, potentially facing higher vacancy.
Average Monthly Occupancy Rate Trend in Branson
Average Daily Rate (ADR) Airbnb Trends in Branson (2026)
Effective short term rental pricing strategy in Branson involves understanding monthly ADR fluctuations. The Average Daily Rate (ADR) for Airbnb in Branson typically peaks in June and dips lowest during February. Leveraging Airbnb dynamic pricing tools or strategies based on this seasonality can significantly boost revenue. Here's a look at the typical nightly rates achieved:
- Best-in-class properties (Top 10%) command rates of $443+ per night, often due to premium features or locations.
- Strong performing properties (Top 25%) achieve nightly rates of $259 or more.
- Typical properties (Median) charge around $178 per night.
- Entry-level properties (Bottom 25%) earn around $136 per night.
Average Daily Rate (ADR) Trend by Month in Branson
Get Live Branson Market Intelligence 👇

Explore Real-time Analytics
Airbnb Seasonality Analysis & Trends in Branson (2026)
Peak Season (July, June, December)
- Revenue averages $4,841 per month
- Occupancy rates average 52.8%
- Daily rates average $272
Shoulder Season
- Revenue averages $3,079 per month
- Occupancy maintains around 41.3%
- Daily rates hold near $232
Low Season (January, February, April)
- Revenue drops to average $1,440 per month
- Occupancy decreases to average 24.3%
- Daily rates adjust to average $201
Seasonality Insights for Branson
- The Airbnb seasonality in Branson shows highly seasonal trends requiring careful strategy. While the sections above show seasonal averages, it's also insightful to look at the extremes:
- During the high season, the absolute peak month showcases Branson's highest earning potential, with monthly revenues capable of climbing to $5,511, occupancy reaching a high of 58.4%, and ADRs peaking at $280.
- Conversely, the slowest single month of the year, typically falling within the low season, marks the market's lowest point. In this month, revenue might dip to $1,123, occupancy could drop to 17.4%, and ADRs may adjust down to $179.
- Understanding both the seasonal averages and these monthly peaks and troughs in revenue, occupancy, and ADR is crucial for maximizing your Airbnb profit potential in Branson.
Seasonal Strategies for Maximizing Profit
- Peak Season: Maximize revenue through premium pricing and potentially longer minimum stays. Ensure high availability.
- Low Season: Offer competitive pricing, special promotions (e.g., extended stay discounts), and flexible cancellation policies. Target off-season travelers like remote workers or budget-conscious guests.
- Shoulder Seasons: Implement dynamic pricing that balances peak and low rates. Target weekend travelers or specific events. Offer slightly more flexible terms than peak season.
- Regularly analyze your own performance against these Branson seasonality benchmarks and adjust your pricing and availability strategy accordingly.
Best Areas for Airbnb Investment in Branson (2026)
Exploring the top neighborhoods for short-term rentals in Branson? This section highlights key areas, outlining why they are attractive for hosts and guests, along with notable local attractions. Consider these locations based on your target guest profile and investment strategy.
| Neighborhood / Area | Why Host Here? (Target Guests & Appeal) | Key Attractions & Landmarks |
|---|---|---|
| The Strip | Branson's iconic entertainment district lined with theaters, restaurants, and attractions. A perfect location for visitors looking for live shows and vibrant nightlife. | Silver Dollar City, Branson Landing, Branson Ferris Wheel, Titanic Museum, Country Music Hall of Fame |
| Table Rock Lake | Scenic area with stunning lake views and outdoor activities. Popular among families and nature lovers, offering boating, fishing, and hiking opportunities. | Table Rock State Park, Showboat Branson Belle, Moonshine Beach, Lake Taneycomo, Fishing and water sports |
| Downtown Branson | Historic district with a quaint atmosphere, shops, and restaurants. Attracts visitors seeking unique local experiences and dining options. | Branson Scenic Railway, Branson Landing, The Branson Center, Local shops and eateries |
| Big Cedar Lodge | Luxury resort area known for its beautiful setting and outdoor activities. Ideal for guests seeking a premium getaway with golf, spas, and nature. | Big Cedar Golf Course, Cedar Creek Spa, Nature trails, Fishing opportunities |
| Hollister | A quieter alternative to Branson, providing easy access to the attractions while offering a more relaxed atmosphere. Great for families and those looking for peace. | The College of the Ozarks, Downtown Hollister, Outdoor parks and trails |
| Shepherd of the Hills | A historic site that attracts visitors looking for cultural experiences and outdoor recreation. Offers fun activities and events throughout the year. | The Shepherd of the Hills Homestead, Outdoor drama shows, Zipline courses, Scenic views |
| Lake Taneycomo | Famous for fishing, this area is ideal for guests who love water activities and scenic views of the lake. Popular with anglers and nature enthusiasts. | Fishing spots, Waterfront dining, Scenic boat tours, Nature trails |
| Kimberling City | A peaceful community with access to Table Rock Lake and nearby attractions, perfect for families and those looking for relaxation and nature. | Table Rock Lake access, Local parks, Swimming and fishing areas |
Understanding Airbnb License Requirements & STR Laws in Branson (2026)
While Branson, Missouri, United States currently shows low STR regulations, specific Airbnb license requirements might still exist or change. Always verify the latest short term rental regulations and Airbnb license requirements directly with local government authorities for Branson to ensure full compliance before hosting.
(Source: AirROI data, 2026, finding no licensed listings among those analyzed)
Top Performing Airbnb Properties in Branson (2026)
Benchmark your potential! Explore examples of top-performing Airbnb properties in Bransonbased on Trailing Twelve Month (TTM) revenue. Analyze their characteristics, revenue, occupancy rate, and ADR to understand what drives success in this market.
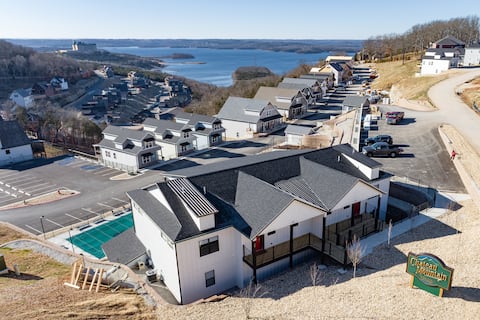
Indoor and Outdoor Pools! Lake View! Sleeps 38!
Entire Place • 12 bedrooms
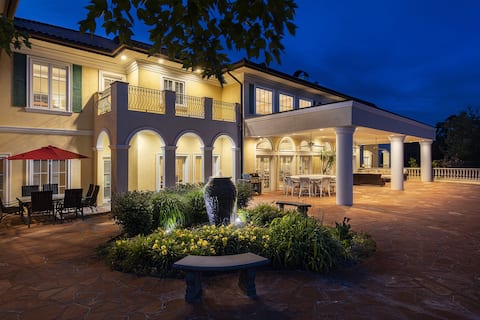
17500sqft Estate | Indoor Pool | Tennis | 5 Kings
Entire Place • 10 bedrooms
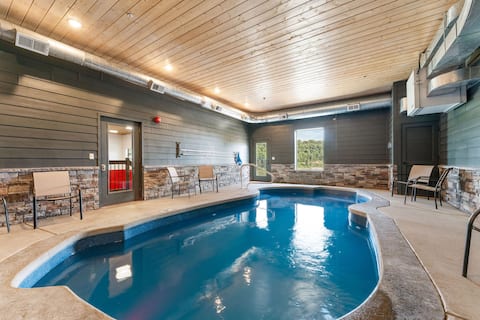
Million Dollar View-Private Indoor Pool-Sleeps 52
Entire Place • 12 bedrooms

Private Pool! Rustic Charm! Steps from the Lake!
Entire Place • 9 bedrooms
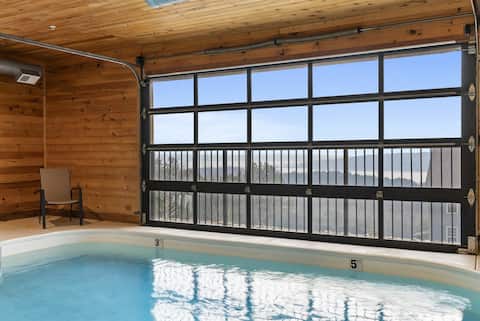
Pvt IndoorPool-Huge Deck-Lake View-Arcades-FreeTix
Entire Place • 12 bedrooms

Private Pool, Pickleball Ct, Mini Golf, Fire Pit
Entire Place • 9 bedrooms
Note: Performance varies based on location, size, amenities, seasonality, and management quality. Data reflects the past 12 months.
Top Performing Airbnb Hosts in Branson (2026)
Learn from the best! This table showcases top-performing Airbnb hosts in Branson based on the number of properties managed and estimated total revenue over the past year. Analyze their scale and performance metrics.
| Host Name | Properties | Grossing Revenue | Stay Reviews | Avg Rating |
|---|---|---|---|---|
| Thousand Hills Vacations | 438 | $11,061,505 | 8118 | 4.69/5.0 |
| Grand Welcome | 245 | $8,166,131 | 9016 | 4.78/5.0 |
| Rent Branson LLC | 78 | $5,776,923 | 1474 | 4.86/5.0 |
| Adam | 40 | $4,532,323 | 3351 | 4.97/5.0 |
| Beths Breakaways | 32 | $3,186,200 | 1736 | 4.96/5.0 |
| Evolve | 85 | $2,216,670 | 2366 | 4.74/5.0 |
| Becky | 22 | $1,687,204 | 879 | 4.96/5.0 |
| Evolve | 58 | $1,500,518 | 2717 | 4.78/5.0 |
| Christene | 46 | $1,325,992 | 2850 | 4.92/5.0 |
| Dreams2Reality | 72 | $1,217,306 | 691 | 4.70/5.0 |
Analyzing the strategies of top hosts, such as their property selection, pricing, and guest communication, can offer valuable lessons for optimizing your own Airbnb operations in Branson.
Dive Deeper: Advanced Branson STR Market Data (2026)
Ready to unlock more insights? AirROI provides access to advanced metrics and comprehensive Airbnb data for Branson. Explore detailed analytics beyond this report to refine your investment strategy, optimize pricing, and maximize your vacation rental profits.
Explore Advanced MetricsBranson Short-Term Rental Market Composition (2026): Property & Room Types
Room Type Distribution
Property Type Distribution
Market Composition Insights for Branson
- The Branson Airbnb market composition is heavily skewed towards Entire Home/Apt listings, which make up 95.2% of the 2,943 active rentals. This indicates strong guest preference for privacy and space.
- Looking at the property type distribution in Branson, Apartment/Condo properties are the most common (64.5%), reflecting the local real estate landscape.
- Houses represent a significant 17.9% portion, catering likely to families or larger groups.
- The presence of 5.7% Hotel/Boutique listings indicates integration with traditional hospitality.
- Smaller segments like unique stays, others (combined 0.4%) offer potential for unique stay experiences.
Branson Airbnb Room Capacity Analysis (2026): Bedroom Distribution
Distribution of Listings by Number of Bedrooms
Room Capacity Insights for Branson
- The dominant room capacity in Branson is 2 bedrooms listings, making up 40.4% of the market. This suggests a strong demand for properties suitable for couples or solo travelers.
- Together, 2 bedrooms and 1 bedroom properties represent 61.3% of the active Airbnb listings in Branson, indicating a high concentration in these sizes.
- A significant 35.9% of listings offer 3+ bedrooms, catering to larger groups and families seeking more space in Branson.
Branson Vacation Rental Guest Capacity Trends (2026)
Distribution of Listings by Guest Capacity
Guest Capacity Insights for Branson
- The most common guest capacity trend in Branson vacation rentals is listings accommodating 8+ guests (37.6%). This suggests the primary traveler segment is likely larger groups.
- Properties designed for 8+ guests and 6 guests dominate the Branson STR market, accounting for 68.1% of listings.
- 70.6% of properties accommodate 6+ guests, serving the market segment for larger families or group travel in Branson.
- On average, properties in Branson are equipped to host 6.1 guests.
Branson Airbnb Booking Patterns (2026): Available vs. Booked Days
Available Days Distribution
Booked Days Distribution
Booking Pattern Insights for Branson
- The most common availability pattern in Branson falls within the 271-366 days range, representing 43.5% of listings. This suggests many properties have significant open periods on their calendars.
- Approximately 81.5% of listings show high availability (181+ days open annually), indicating potential for increased bookings or specific owner usage patterns.
- For booked days, the 91-180 days range is most frequent in Branson (38.6%), reflecting common guest stay durations or potential owner blocking patterns.
- A notable 19.6% of properties secure long booking periods (181+ days booked per year), highlighting successful long-term rental strategies or significant owner usage.
Branson Airbnb Minimum Stay Requirements Analysis
Distribution of Listings by Minimum Night Requirement
1 Night
357 listings
12.1% of total
2 Nights
1156 listings
39.3% of total
3 Nights
51 listings
1.7% of total
4-6 Nights
10 listings
0.3% of total
7-29 Nights
9 listings
0.3% of total
30+ Nights
1360 listings
46.2% of total
Key Insights
- The most prevalent minimum stay requirement in Branson is 30+ Nights, adopted by 46.2% of listings. This highlights the market's preference for longer commitments.
- A significant segment (46.2%) caters to monthly stays (30+ nights) in Branson, pointing to opportunities in the extended-stay market.
Recommendations
- Align with the market by considering a 30+ Nights minimum stay, as 46.2% of Branson hosts use this setting.
- If feasible, allowing 1-night stays, especially midweek or during low season, could capture last-minute bookings, as only 12.1% currently do.
- A 2-night minimum appears standard (39.3%). Consider this for weekends or peak periods.
- Explore offering discounts for stays of 30+ nights to attract the 46.2% of the market seeking extended stays.
- Adjust minimum nights based on seasonality – potentially shorter during low season and longer during peak demand periods in Branson.
Branson Airbnb Cancellation Policy Trends Analysis (2026)
Super Strict 30 Days
106 listings
3.6% of total
Refundable
3 listings
0.1% of total
Non-refundable
1 listings
0% of total
Limited
336 listings
11.4% of total
Super Strict 60 Days
18 listings
0.6% of total
Flexible
155 listings
5.3% of total
Moderate
636 listings
21.7% of total
Firm
942 listings
32.1% of total
Strict
738 listings
25.1% of total
Cancellation Policy Insights for Branson
- The prevailing Airbnb cancellation policy trend in Branson is Firm, used by 32.1% of listings.
- A majority (57.2%) of hosts in Branson utilize Firm or Strict policies, indicating a market where hosts prioritize booking security.
Recommendations for Hosts
- Consider adopting a Firm policy to align with the 32.1% market standard in Branson.
- Regularly review your cancellation policy against competitors and market demand shifts in Branson.
Branson STR Booking Lead Time Analysis (2026)
Average Booking Lead Time by Month
Booking Lead Time Insights for Branson
- The overall average booking lead time for vacation rentals in Branson is 46 days.
- Guests book furthest in advance for stays during November (average 64 days), likely coinciding with peak travel demand or local events.
- The shortest booking windows occur for stays in February (average 27 days), indicating more last-minute travel plans during this time.
- Seasonally, Fall (57 days avg.) sees the longest lead times, while Winter (36 days avg.) has the shortest, reflecting typical travel planning cycles.
Recommendations for Hosts
- Use the overall average lead time (46 days) as a baseline for your pricing and availability strategy in Branson.
- For November stays, consider implementing length-of-stay discounts or slightly higher rates for bookings made less than 64 days out to capitalize on advance planning.
- Target marketing efforts for the Fall season well in advance (at least 57 days) to capture early planners.
- Monitor your own booking lead times against these Branson averages to identify opportunities for dynamic pricing adjustments.
Popular & Essential Airbnb Amenities in Branson (2026)
Amenity Prevalence
Amenity Insights for Branson
- Essential amenities in Branson that guests expect include: Air conditioning, Wifi, TV, Smoke alarm, Free parking on premises, Heating. Lacking these (any) could significantly impact bookings.
- Popular amenities like Coffee maker, Kitchen, Microwave are common but not universal. Offering these can provide a competitive edge.
Recommendations for Hosts
- Ensure your listing includes all essential amenities for Branson: Air conditioning, Wifi, TV, Smoke alarm, Free parking on premises, Heating.
- Prioritize adding missing essentials: Air conditioning, Wifi, TV, Smoke alarm, Free parking on premises, Heating.
- Consider adding popular differentiators like Coffee maker or Kitchen to increase appeal.
- Highlight unique or less common amenities you offer (e.g., hot tub, dedicated workspace, EV charger) in your listing description and photos.
- Regularly check competitor amenities in Branson to stay competitive.
Branson Airbnb Guest Demographics & Profile Analysis (2026)
Guest Profile Summary for Branson
- The typical guest profile for Airbnb in Branson consists of primarily domestic travelers (99%), often arriving from nearby Kansas City, typically belonging to the Post-2000s (Gen Z/Alpha) group (50%), primarily speaking English or Spanish.
- Domestic travelers account for 99.2% of guests.
- Key international markets include United States (99.2%) and Canada (0.1%).
- Top languages spoken are English (88.7%) followed by Spanish (6.6%).
- A significant demographic segment is the Post-2000s (Gen Z/Alpha) group, representing 50% of guests.
Recommendations for Hosts
- Target domestic marketing efforts towards travelers from Kansas City and St. Louis.
- Tailor amenities and listing descriptions to appeal to the dominant Post-2000s (Gen Z/Alpha) demographic (e.g., highlight fast WiFi, smart home features, local guides).
- Highlight unique local experiences or amenities relevant to the primary guest profile.
- Consider seasonal promotions aligned with peak travel times for key origin markets.
Nearby Short-Term Rental Market Comparison
How does the Branson Airbnb market stack up against its neighbors? Compare key performance metrics like average monthly revenue, ADR, and occupancy rates in surrounding areas to understand the broader regional STR landscape.
| Market | Active Properties | Monthly Revenue | Daily Rate | Avg. Occupancy |
|---|---|---|---|---|
| Blue Eye | 32 | $5,674 | $427.78 | 50% |
| Hollister | 317 | $4,744 | $431.85 | 42% |
| Omaha | 38 | $3,581 | $270.03 | 48% |
| Ridgedale | 121 | $3,353 | $429.21 | 38% |
| Flippin | 35 | $3,256 | $268.96 | 39% |
| Branson West | 267 | $3,068 | $246.89 | 43% |
| Little Flock | 17 | $2,955 | $370.27 | 40% |
| Lowell | 30 | $2,905 | $254.69 | 43% |
| Ponca | 40 | $2,893 | $371.63 | 31% |
| Kimberling City | 351 | $2,826 | $332.93 | 33% |