Barnett Airbnb Market Analysis 2026: Short Term Rental Data & Vacation Rental Statistics in Missouri, United States
Is Airbnb profitable in Barnett in 2026? Explore comprehensive Airbnb analytics for Barnett, Missouri, United States to uncover income potential. This 2026 STR market report for Barnett, based on AirROI data from February 2025 to January 2026, reveals key trends in the niche market of 23 active listings.
Whether you're considering an Airbnb investment in Barnett, optimizing your existing vacation rental, or exploring rental arbitrage opportunities, understanding the Barnett Airbnb data is crucial. Leveraging the low regulation environment is key to maximizing your short term rental income potential. Let's dive into the specifics.
Key Barnett Airbnb Performance Metrics Overview
Monthly Airbnb Revenue Variations & Income Potential in Barnett (2026)
Understanding the monthly revenue variations for Airbnb listings in Barnett is key to maximizing your short term rental income potential. Seasonality significantly impacts earnings. Our analysis, based on data from the past 12 months, shows that the peak revenue month for STRs in Barnett is typically July, while February often presents the lowest earnings, highlighting opportunities for strategic pricing adjustments during shoulder and low seasons. Explore the typical Airbnb income in Barnett across different performance tiers:
- Best-in-class properties (Top 10%) achieve $6,135+ monthly, often utilizing dynamic pricing and superior guest experiences.
- Strong performing properties (Top 25%) earn $4,159 or more, indicating effective management and desirable locations/amenities.
- Typical properties (Median) generate around $2,928 per month, representing the average market performance.
- Entry-level properties (Bottom 25%) see earnings around $1,629, often with potential for optimization.
Average Monthly Airbnb Earnings Trend in Barnett
Barnett Airbnb Occupancy Rate Trends (2026)
Maximize your bookings by understanding the Barnett STR occupancy trends. Seasonal demand shifts significantly influence how often properties are booked. Typically, Julysees the highest demand (peak season occupancy), while February experiences the lowest (low season). Effective strategies, like adjusting minimum stays or offering promotions, can boost occupancy during slower periods. Here's how different property tiers perform in Barnett:
- Best-in-class properties (Top 10%) achieve 69%+ occupancy, indicating high desirability and potentially optimized availability.
- Strong performing properties (Top 25%) maintain 49% or higher occupancy, suggesting good market fit and guest satisfaction.
- Typical properties (Median) have an occupancy rate around 34%.
- Entry-level properties (Bottom 25%) average 19% occupancy, potentially facing higher vacancy.
Average Monthly Occupancy Rate Trend in Barnett
Average Daily Rate (ADR) Airbnb Trends in Barnett (2026)
Effective short term rental pricing strategy in Barnett involves understanding monthly ADR fluctuations. The Average Daily Rate (ADR) for Airbnb in Barnett typically peaks in June and dips lowest during February. Leveraging Airbnb dynamic pricing tools or strategies based on this seasonality can significantly boost revenue. Here's a look at the typical nightly rates achieved:
- Best-in-class properties (Top 10%) command rates of $522+ per night, often due to premium features or locations.
- Strong performing properties (Top 25%) achieve nightly rates of $380 or more.
- Typical properties (Median) charge around $247 per night.
- Entry-level properties (Bottom 25%) earn around $210 per night.
Average Daily Rate (ADR) Trend by Month in Barnett
Get Live Barnett Market Intelligence 👇

Explore Real-time Analytics
Airbnb Seasonality Analysis & Trends in Barnett (2026)
Peak Season (July, June, August)
- Revenue averages $5,872 per month
- Occupancy rates average 58.2%
- Daily rates average $330
Shoulder Season
- Revenue averages $2,957 per month
- Occupancy maintains around 33.6%
- Daily rates hold near $302
Low Season (January, February, March)
- Revenue drops to average $1,374 per month
- Occupancy decreases to average 21.4%
- Daily rates adjust to average $274
Seasonality Insights for Barnett
- The Airbnb seasonality in Barnett shows highly seasonal trends requiring careful strategy. While the sections above show seasonal averages, it's also insightful to look at the extremes:
- During the high season, the absolute peak month showcases Barnett's highest earning potential, with monthly revenues capable of climbing to $6,635, occupancy reaching a high of 66.7%, and ADRs peaking at $333.
- Conversely, the slowest single month of the year, typically falling within the low season, marks the market's lowest point. In this month, revenue might dip to $866, occupancy could drop to 18.4%, and ADRs may adjust down to $260.
- Understanding both the seasonal averages and these monthly peaks and troughs in revenue, occupancy, and ADR is crucial for maximizing your Airbnb profit potential in Barnett.
Seasonal Strategies for Maximizing Profit
- Peak Season: Maximize revenue through premium pricing and potentially longer minimum stays. Ensure high availability.
- Low Season: Offer competitive pricing, special promotions (e.g., extended stay discounts), and flexible cancellation policies. Target off-season travelers like remote workers or budget-conscious guests.
- Shoulder Seasons: Implement dynamic pricing that balances peak and low rates. Target weekend travelers or specific events. Offer slightly more flexible terms than peak season.
- Regularly analyze your own performance against these Barnett seasonality benchmarks and adjust your pricing and availability strategy accordingly.
Best Areas for Airbnb Investment in Barnett (2026)
Exploring the top neighborhoods for short-term rentals in Barnett? This section highlights key areas, outlining why they are attractive for hosts and guests, along with notable local attractions. Consider these locations based on your target guest profile and investment strategy.
| Neighborhood / Area | Why Host Here? (Target Guests & Appeal) | Key Attractions & Landmarks |
|---|---|---|
| Lake of the Ozarks | A popular destination for vacationers seeking outdoor activities, water sports, and relaxation. It offers a wide range of attractions for families and groups looking for a getaway. | Lake activities, Ozark Caverns, Bagnell Dam, Lake of the Ozarks State Park |
| Branson | Known as 'The Live Entertainment Capital of the World', Branson attracts visitors with its theaters, live shows, and family-friendly attractions. It's ideal for hosting tourists year-round. | Silver Dollar City, Branson Strip, Table Rock Lake, Branson Landing, Tanger Outlets, Various live shows |
| Columbia | Home to the University of Missouri, Columbia has a vibrant college town atmosphere, making it a great spot for young travelers and university visitors. Events and attractions cater to a diverse demographic. | Museum of Art and Archaeology, Stephens Lake Park, Mizzou campus, Columbia Art League, Live music events, Local breweries |
| St. Charles | Historic district with charming architecture and a riverfront setting. Attracts visitors interested in history, shopping, and dining, making it a prime location for Airbnb hosts. | Historic Main Street, The Lewis and Clark Center, Tracey’s restaurant, The Katy Trail, St. Charles Riverfront, Shopping boutiques |
| Kansas City | A vibrant city known for its jazz heritage, barbecue restaurants, and cultural attractions. It's suitable for both business travelers and tourists looking for urban adventures. | National WWI Museum, Nelson-Atkins Museum of Art, Union Station, Country Club Plaza, Kauffman Center for the Performing Arts |
| Saint Louis | Home to iconic landmarks like the Gateway Arch, this bustling city attracts tourists with its museums, parks, and cultural events throughout the year. | Gateway Arch, Forest Park, St. Louis Art Museum, City Museum, Anheuser-Busch Brewery |
| Sedalia | Known for its rich history and events like the State Fair, Sedalia attracts visitors seeking small-town charm and local culture, making it a unique place to host guests. | Missouri State Fairgrounds, Daum Museum of Contemporary Art, Liberty Park, Historic Downtown Sedalia |
| Hannibal | The boyhood home of Mark Twain, Hannibal offers historical attractions and riverfront activities that draw in visitors interested in literature and American history. | Mark Twain Boyhood Home, Mark Twain Riverboat, Tom Sawyer's excessive tourist spots, Becky Thatcher House, Hannibal History Museum |
Understanding Airbnb License Requirements & STR Laws in Barnett (2026)
While Barnett, Missouri, United States currently shows low STR regulations, specific Airbnb license requirements might still exist or change. Always verify the latest short term rental regulations and Airbnb license requirements directly with local government authorities for Barnett to ensure full compliance before hosting.
(Source: AirROI data, 2026, finding no licensed listings among those analyzed)
Top Performing Airbnb Properties in Barnett (2026)
Benchmark your potential! Explore examples of top-performing Airbnb properties in Barnettbased on Trailing Twelve Month (TTM) revenue. Analyze their characteristics, revenue, occupancy rate, and ADR to understand what drives success in this market.

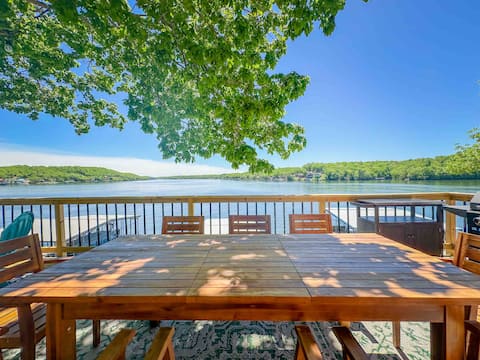
Breathtaking Lake Views & Grand Dock Await You!
Entire Place • 4 bedrooms
No Bad Days at Dixie Lane!
Entire Place • 5 bedrooms
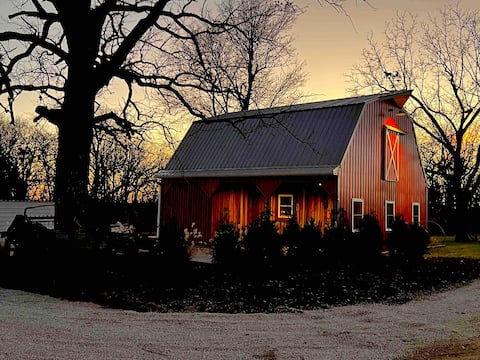
“The Little Red Barn” on the edge of the farm!
Entire Place • 3 bedrooms
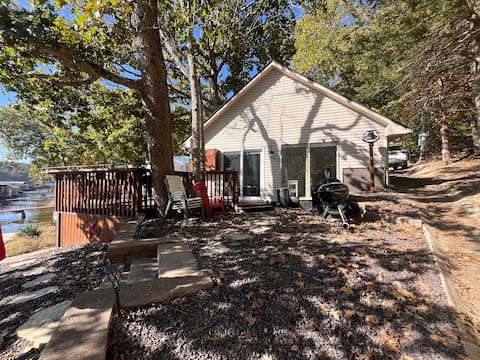
Lake of the Ozarks Waterfront Cabin
Entire Place • 3 bedrooms

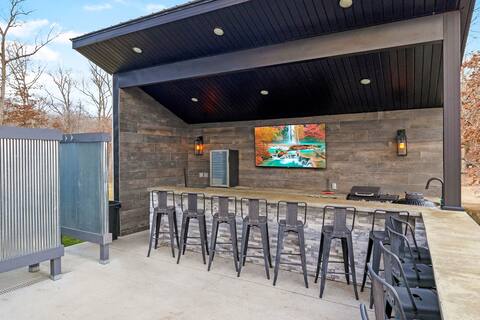
LOTO Lake house with Bunkhouse, Hot tub, NEW DOCK!
Entire Place • 4 bedrooms
*Shorty Shores* Lakefront House
Entire Place • 3 bedrooms
Note: Performance varies based on location, size, amenities, seasonality, and management quality. Data reflects the past 12 months.
Top Performing Airbnb Hosts in Barnett (2026)
Learn from the best! This table showcases top-performing Airbnb hosts in Barnett based on the number of properties managed and estimated total revenue over the past year. Analyze their scale and performance metrics.
| Host Name | Properties | Grossing Revenue | Stay Reviews | Avg Rating |
|---|---|---|---|---|
| Matt | 3 | $96,317 | 66 | 4.96/5.0 |
| Terri | 1 | $66,210 | 28 | 4.96/5.0 |
| Jeremy | 2 | $63,675 | 190 | 4.95/5.0 |
| Aaron | 1 | $54,772 | 51 | 4.98/5.0 |
| Kasandra | 1 | $51,276 | 31 | 4.94/5.0 |
| Kyle | 1 | $40,884 | 51 | 4.96/5.0 |
| Danielle | 1 | $40,689 | 31 | 4.74/5.0 |
| Randal | 1 | $35,667 | 114 | 5.00/5.0 |
| Troy | 1 | $32,219 | 41 | 4.78/5.0 |
| Pamela Quinn | 1 | $24,292 | 25 | 4.72/5.0 |
Analyzing the strategies of top hosts, such as their property selection, pricing, and guest communication, can offer valuable lessons for optimizing your own Airbnb operations in Barnett.
Dive Deeper: Advanced Barnett STR Market Data (2026)
Ready to unlock more insights? AirROI provides access to advanced metrics and comprehensive Airbnb data for Barnett. Explore detailed analytics beyond this report to refine your investment strategy, optimize pricing, and maximize your vacation rental profits.
Explore Advanced MetricsBarnett Short-Term Rental Market Composition (2026): Property & Room Types
Room Type Distribution
Property Type Distribution
Market Composition Insights for Barnett
- The Barnett Airbnb market composition is heavily skewed towards Entire Home/Apt listings, which make up 100% of the 23 active rentals. This indicates strong guest preference for privacy and space.
- Looking at the property type distribution in Barnett, House properties are the most common (87%), reflecting the local real estate landscape.
- Houses represent a significant 87% portion, catering likely to families or larger groups.
- Smaller segments like outdoor/unique, hotel/boutique, unique stays (combined 12.9%) offer potential for unique stay experiences.
Barnett Airbnb Room Capacity Analysis (2026): Bedroom Distribution
Distribution of Listings by Number of Bedrooms
Room Capacity Insights for Barnett
- The dominant room capacity in Barnett is 3 bedrooms listings, making up 47.8% of the market. This suggests a strong demand for properties suitable for families or small groups.
- Together, 3 bedrooms and 4 bedrooms properties represent 73.9% of the active Airbnb listings in Barnett, indicating a high concentration in these sizes.
- A significant 78.2% of listings offer 3+ bedrooms, catering to larger groups and families seeking more space in Barnett.
Barnett Vacation Rental Guest Capacity Trends (2026)
Distribution of Listings by Guest Capacity
Guest Capacity Insights for Barnett
- The most common guest capacity trend in Barnett vacation rentals is listings accommodating 8+ guests (65.2%). This suggests the primary traveler segment is likely larger groups.
- Properties designed for 8+ guests and 6 guests dominate the Barnett STR market, accounting for 78.2% of listings.
- 86.9% of properties accommodate 6+ guests, serving the market segment for larger families or group travel in Barnett.
- On average, properties in Barnett are equipped to host 7.1 guests.
Barnett Airbnb Booking Patterns (2026): Available vs. Booked Days
Available Days Distribution
Booked Days Distribution
Booking Pattern Insights for Barnett
- The most common availability pattern in Barnett falls within the 181-270 days range, representing 47.8% of listings. This suggests many properties have significant open periods on their calendars.
- Approximately 95.6% of listings show high availability (181+ days open annually), indicating potential for increased bookings or specific owner usage patterns.
- For booked days, the 91-180 days range is most frequent in Barnett (47.8%), reflecting common guest stay durations or potential owner blocking patterns.
- A notable 4.3% of properties secure long booking periods (181+ days booked per year), highlighting successful long-term rental strategies or significant owner usage.
Barnett Airbnb Minimum Stay Requirements Analysis
Distribution of Listings by Minimum Night Requirement
1 Night
3 listings
13% of total
2 Nights
7 listings
30.4% of total
3 Nights
3 listings
13% of total
4-6 Nights
1 listings
4.3% of total
30+ Nights
9 listings
39.1% of total
Key Insights
- The most prevalent minimum stay requirement in Barnett is 30+ Nights, adopted by 39.1% of listings. This highlights the market's preference for longer commitments.
- A significant segment (39.1%) caters to monthly stays (30+ nights) in Barnett, pointing to opportunities in the extended-stay market.
Recommendations
- Align with the market by considering a 30+ Nights minimum stay, as 39.1% of Barnett hosts use this setting.
- If feasible, allowing 1-night stays, especially midweek or during low season, could capture last-minute bookings, as only 13% currently do.
- A 2-night minimum appears standard (30.4%). Consider this for weekends or peak periods.
- Explore offering discounts for stays of 30+ nights to attract the 39.1% of the market seeking extended stays.
- Adjust minimum nights based on seasonality – potentially shorter during low season and longer during peak demand periods in Barnett.
Barnett Airbnb Cancellation Policy Trends Analysis (2026)
Super Strict 30 Days
3 listings
13% of total
Flexible
6 listings
26.1% of total
Moderate
3 listings
13% of total
Firm
9 listings
39.1% of total
Strict
2 listings
8.7% of total
Cancellation Policy Insights for Barnett
- The prevailing Airbnb cancellation policy trend in Barnett is Firm, used by 39.1% of listings.
- There's a relatively balanced mix between guest-friendly (39.1%) and stricter (47.8%) policies, offering choices for different guest needs.
- Strict cancellation policies are quite rare (8.7%), potentially making listings with this policy less competitive unless justified by high demand or property type.
Recommendations for Hosts
- Consider adopting a Firm policy to align with the 39.1% market standard in Barnett.
- Using a Strict policy might deter some guests, as only 8.7% of listings use it. Evaluate if potential revenue protection outweighs possible lower booking rates.
- Regularly review your cancellation policy against competitors and market demand shifts in Barnett.
Barnett STR Booking Lead Time Analysis (2026)
Average Booking Lead Time by Month
Booking Lead Time Insights for Barnett
- The overall average booking lead time for vacation rentals in Barnett is 59 days.
- Guests book furthest in advance for stays during July (average 102 days), likely coinciding with peak travel demand or local events.
- The shortest booking windows occur for stays in November (average 11 days), indicating more last-minute travel plans during this time.
- Seasonally, Summer (88 days avg.) sees the longest lead times, while Winter (18 days avg.) has the shortest, reflecting typical travel planning cycles.
Recommendations for Hosts
- Use the overall average lead time (59 days) as a baseline for your pricing and availability strategy in Barnett.
- For July stays, consider implementing length-of-stay discounts or slightly higher rates for bookings made less than 102 days out to capitalize on advance planning.
- During November, focus on last-minute booking availability and promotions, as guests book with very short notice (11 days avg.).
- Target marketing efforts for the Summer season well in advance (at least 88 days) to capture early planners.
- Monitor your own booking lead times against these Barnett averages to identify opportunities for dynamic pricing adjustments.
Popular & Essential Airbnb Amenities in Barnett (2026)
Amenity Prevalence
Amenity Insights for Barnett
- Essential amenities in Barnett that guests expect include: Smoke alarm, Free parking on premises, Wifi, Air conditioning, Dishes and silverware, BBQ grill, Kitchen, Refrigerator, TV. Lacking these (any) could significantly impact bookings.
- Popular amenities like Fire extinguisher are common but not universal. Offering these can provide a competitive edge.
Recommendations for Hosts
- Ensure your listing includes all essential amenities for Barnett: Smoke alarm, Free parking on premises, Wifi, Air conditioning, Dishes and silverware, BBQ grill, Kitchen, Refrigerator, TV.
- Prioritize adding missing essentials: Dishes and silverware, BBQ grill, Kitchen, Refrigerator, TV.
- Consider adding popular differentiators like Fire extinguisher to increase appeal.
- Highlight unique or less common amenities you offer (e.g., hot tub, dedicated workspace, EV charger) in your listing description and photos.
- Regularly check competitor amenities in Barnett to stay competitive.
Barnett Airbnb Guest Demographics & Profile Analysis (2026)
Guest Profile Summary for Barnett
- The typical guest profile for Airbnb in Barnett consists of primarily domestic travelers (100%), often arriving from nearby Kansas City, typically belonging to the Post-2000s (Gen Z/Alpha) group (50%), primarily speaking English or Spanish.
- Domestic travelers account for 100.0% of guests.
- Top languages spoken are English (80.8%) followed by Spanish (11.5%).
- A significant demographic segment is the Post-2000s (Gen Z/Alpha) group, representing 50% of guests.
Recommendations for Hosts
- Target domestic marketing efforts towards travelers from Kansas City and St. Louis.
- Tailor amenities and listing descriptions to appeal to the dominant Post-2000s (Gen Z/Alpha) demographic (e.g., highlight fast WiFi, smart home features, local guides).
- Highlight unique local experiences or amenities relevant to the primary guest profile.
- Consider seasonal promotions aligned with peak travel times for key origin markets.
Nearby Short-Term Rental Market Comparison
How does the Barnett Airbnb market stack up against its neighbors? Compare key performance metrics like average monthly revenue, ADR, and occupancy rates in surrounding areas to understand the broader regional STR landscape.
| Market | Active Properties | Monthly Revenue | Daily Rate | Avg. Occupancy |
|---|---|---|---|---|
| Wright City | 13 | $4,135 | $455.44 | 37% |
| Innsbrook | 199 | $4,100 | $422.60 | 35% |
| Linn Creek | 28 | $3,665 | $404.65 | 37% |
| Sunrise Beach | 279 | $3,450 | $473.67 | 38% |
| Greenview | 11 | $3,219 | $428.61 | 42% |
| Gravois Mills | 133 | $2,984 | $395.30 | 37% |
| Friedenswald | 12 | $2,948 | $294.85 | 38% |
| Climax Springs | 32 | $2,826 | $398.65 | 33% |
| Roach | 27 | $2,741 | $376.61 | 42% |
| Rocheport | 20 | $2,716 | $349.48 | 36% |