Starkville Airbnb Market Analysis 2026: Short Term Rental Data & Vacation Rental Statistics in Mississippi, United States
Is Airbnb profitable in Starkville in 2026? Explore comprehensive Airbnb analytics for Starkville, Mississippi, United States to uncover income potential. This 2026 STR market report for Starkville, based on AirROI data from February 2025 to January 2026, reveals key trends in the market of 354 active listings.
Whether you're considering an Airbnb investment in Starkville, optimizing your existing vacation rental, or exploring rental arbitrage opportunities, understanding the Starkville Airbnb data is crucial. Leveraging the low regulation environment is key to maximizing your short term rental income potential. Let's dive into the specifics.
Key Starkville Airbnb Performance Metrics Overview
Monthly Airbnb Revenue Variations & Income Potential in Starkville (2026)
Understanding the monthly revenue variations for Airbnb listings in Starkville is key to maximizing your short term rental income potential. Seasonality significantly impacts earnings. Our analysis, based on data from the past 12 months, shows that the peak revenue month for STRs in Starkville is typically September, while January often presents the lowest earnings, highlighting opportunities for strategic pricing adjustments during shoulder and low seasons. Explore the typical Airbnb income in Starkville across different performance tiers:
- Best-in-class properties (Top 10%) achieve $4,994+ monthly, often utilizing dynamic pricing and superior guest experiences.
- Strong performing properties (Top 25%) earn $3,285 or more, indicating effective management and desirable locations/amenities.
- Typical properties (Median) generate around $1,995 per month, representing the average market performance.
- Entry-level properties (Bottom 25%) see earnings around $1,041, often with potential for optimization.
Average Monthly Airbnb Earnings Trend in Starkville
Starkville Airbnb Occupancy Rate Trends (2026)
Maximize your bookings by understanding the Starkville STR occupancy trends. Seasonal demand shifts significantly influence how often properties are booked. Typically, Junesees the highest demand (peak season occupancy), while October experiences the lowest (low season). Effective strategies, like adjusting minimum stays or offering promotions, can boost occupancy during slower periods. Here's how different property tiers perform in Starkville:
- Best-in-class properties (Top 10%) achieve 73%+ occupancy, indicating high desirability and potentially optimized availability.
- Strong performing properties (Top 25%) maintain 54% or higher occupancy, suggesting good market fit and guest satisfaction.
- Typical properties (Median) have an occupancy rate around 31%.
- Entry-level properties (Bottom 25%) average 16% occupancy, potentially facing higher vacancy.
Average Monthly Occupancy Rate Trend in Starkville
Average Daily Rate (ADR) Airbnb Trends in Starkville (2026)
Effective short term rental pricing strategy in Starkville involves understanding monthly ADR fluctuations. The Average Daily Rate (ADR) for Airbnb in Starkville typically peaks in November and dips lowest during March. Leveraging Airbnb dynamic pricing tools or strategies based on this seasonality can significantly boost revenue. Here's a look at the typical nightly rates achieved:
- Best-in-class properties (Top 10%) command rates of $467+ per night, often due to premium features or locations.
- Strong performing properties (Top 25%) achieve nightly rates of $316 or more.
- Typical properties (Median) charge around $210 per night.
- Entry-level properties (Bottom 25%) earn around $144 per night.
Average Daily Rate (ADR) Trend by Month in Starkville
Get Live Starkville Market Intelligence 👇

Explore Real-time Analytics
Airbnb Seasonality Analysis & Trends in Starkville (2026)
Peak Season (September, May, November)
- Revenue averages $3,066 per month
- Occupancy rates average 37.2%
- Daily rates average $296
Shoulder Season
- Revenue averages $2,508 per month
- Occupancy maintains around 39.1%
- Daily rates hold near $261
Low Season (January, February, December)
- Revenue drops to average $1,968 per month
- Occupancy decreases to average 32.8%
- Daily rates adjust to average $269
Seasonality Insights for Starkville
- The Airbnb seasonality in Starkville shows moderate seasonality with distinct peak and low periods. While the sections above show seasonal averages, it's also insightful to look at the extremes:
- During the high season, the absolute peak month showcases Starkville's highest earning potential, with monthly revenues capable of climbing to $3,252, occupancy reaching a high of 43.9%, and ADRs peaking at $315.
- Conversely, the slowest single month of the year, typically falling within the low season, marks the market's lowest point. In this month, revenue might dip to $1,714, occupancy could drop to 26.7%, and ADRs may adjust down to $241.
- Understanding both the seasonal averages and these monthly peaks and troughs in revenue, occupancy, and ADR is crucial for maximizing your Airbnb profit potential in Starkville.
Seasonal Strategies for Maximizing Profit
- Peak Season: Maximize revenue through premium pricing and potentially longer minimum stays. Ensure high availability.
- Low Season: Offer competitive pricing, special promotions (e.g., extended stay discounts), and flexible cancellation policies. Target off-season travelers like remote workers or budget-conscious guests.
- Shoulder Seasons: Implement dynamic pricing that balances peak and low rates. Target weekend travelers or specific events. Offer slightly more flexible terms than peak season.
- Regularly analyze your own performance against these Starkville seasonality benchmarks and adjust your pricing and availability strategy accordingly.
Best Areas for Airbnb Investment in Starkville (2026)
Exploring the top neighborhoods for short-term rentals in Starkville? This section highlights key areas, outlining why they are attractive for hosts and guests, along with notable local attractions. Consider these locations based on your target guest profile and investment strategy.
| Neighborhood / Area | Why Host Here? (Target Guests & Appeal) | Key Attractions & Landmarks |
|---|---|---|
| University Drive | Close to Mississippi State University, attracting students and parents during the academic year and sports events. | Mississippi State University, Dudy Noble Field, Davis Wade Stadium, B.B. King Museum, Starkville Municipal Golf Course |
| Downtown Starkville | Vibrant downtown area with shops, cafes, and restaurants, perfect for visitors wanting to explore local culture. | Starkville Community Theatre, Oktibbeha County Heritage Museum, Local restaurants and bars, Art galleries, Annual events like the Cotton District Arts Festival |
| East Starkville | Residential area with easy access to parks and natural attractions, appealing to families and nature lovers. | Noxubee National Wildlife Refuge, Starkville Sportsplex, Parks and recreational areas |
| West Starkville | Predominantly residential, this area is gaining popularity for visitors wanting a quieter stay while close to the university and downtown. | Starkville Public Library, East Mississippi Community College, Local dining spots |
| South Montgomery | A growing neighborhood with newer developments, ideal for families and longer stays. | Community parks, Shopping centers, Local events |
| Northside Starkville | Great access to the university and residential feel, attracting long-term visitors and families. | Parks, Schools, Community events |
| Cotton District | A historic and picturesque area with charming architecture, known for its dining and nightlife, appealing to younger audiences. | Cotton District, Local breweries, Restaurants and nightspots |
| The Village at Starkville | A modern residential area with amenities that cater to families and professionals, suitable for short and long-term stays. | Shopping centers, Fitness facilities, Community parks |
Understanding Airbnb License Requirements & STR Laws in Starkville (2026)
While Starkville, Mississippi, United States currently shows low STR regulations, specific Airbnb license requirements might still exist or change. Always verify the latest short term rental regulations and Airbnb license requirements directly with local government authorities for Starkville to ensure full compliance before hosting.
(Source: AirROI data, 2026, finding no licensed listings among those analyzed)
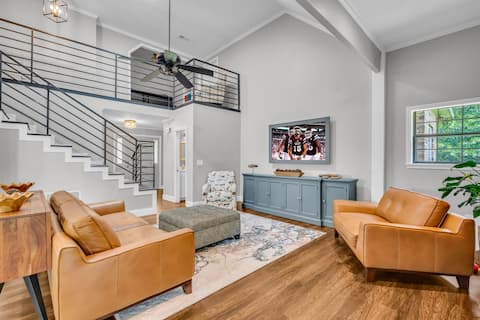
Top Performing Airbnb Properties in Starkville (2026)
Benchmark your potential! Explore examples of top-performing Airbnb properties in Starkvillebased on Trailing Twelve Month (TTM) revenue. Analyze their characteristics, revenue, occupancy rate, and ADR to understand what drives success in this market.

Charter House
Entire Place • 3 bedrooms

Spacious 4 Bedroom House in the Highlands
Entire Place • 4 bedrooms
Secluded | Spacious | Family Friendly
Entire Place • 4 bedrooms

Modern | Patio | Escape
Entire Place • 4 bedrooms

Chadwick on Lee @ Mississippi State Condo G-128
Entire Place • 2 bedrooms
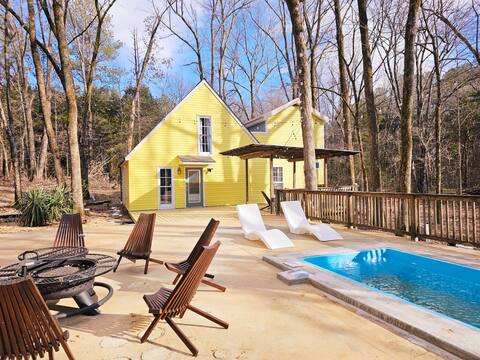
Heated POOL & Pit - Nature Homes Minutes from MSU
Entire Place • 5 bedrooms
Note: Performance varies based on location, size, amenities, seasonality, and management quality. Data reflects the past 12 months.
Top Performing Airbnb Hosts in Starkville (2026)
Learn from the best! This table showcases top-performing Airbnb hosts in Starkville based on the number of properties managed and estimated total revenue over the past year. Analyze their scale and performance metrics.
| Host Name | Properties | Grossing Revenue | Stay Reviews | Avg Rating |
|---|---|---|---|---|
| Jody | 47 | $1,601,689 | 1524 | 4.82/5.0 |
| Haley | 11 | $269,480 | 258 | 4.78/5.0 |
| Far Out Motel | 27 | $200,900 | 256 | 4.75/5.0 |
| Jen | 4 | $161,728 | 745 | 4.92/5.0 |
| Frances | 6 | $157,853 | 609 | 4.88/5.0 |
| Jonathan | 5 | $151,594 | 355 | 4.96/5.0 |
| Beth Ann Fedric | 8 | $146,319 | 177 | 4.96/5.0 |
| Kathy | 1 | $140,612 | 18 | 5.00/5.0 |
| Luke | 2 | $102,697 | 177 | 4.92/5.0 |
| Johnny | 1 | $99,740 | 30 | 4.90/5.0 |
Analyzing the strategies of top hosts, such as their property selection, pricing, and guest communication, can offer valuable lessons for optimizing your own Airbnb operations in Starkville.
Dive Deeper: Advanced Starkville STR Market Data (2026)
Ready to unlock more insights? AirROI provides access to advanced metrics and comprehensive Airbnb data for Starkville. Explore detailed analytics beyond this report to refine your investment strategy, optimize pricing, and maximize your vacation rental profits.
Explore Advanced MetricsStarkville Short-Term Rental Market Composition (2026): Property & Room Types
Room Type Distribution
Property Type Distribution
Market Composition Insights for Starkville
- The Starkville Airbnb market composition is heavily skewed towards Entire Home/Apt listings, which make up 89.8% of the 354 active rentals. This indicates strong guest preference for privacy and space.
- Looking at the property type distribution in Starkville, House properties are the most common (56.5%), reflecting the local real estate landscape.
- Houses represent a significant 56.5% portion, catering likely to families or larger groups.
- The presence of 9.9% Hotel/Boutique listings indicates integration with traditional hospitality.
- Smaller segments like others, outdoor/unique, unique stays (combined 2.5%) offer potential for unique stay experiences.
Starkville Airbnb Room Capacity Analysis (2026): Bedroom Distribution
Distribution of Listings by Number of Bedrooms
Room Capacity Insights for Starkville
- The dominant room capacity in Starkville is 2 bedrooms listings, making up 36.4% of the market. This suggests a strong demand for properties suitable for couples or solo travelers.
- Together, 2 bedrooms and 3 bedrooms properties represent 62.4% of the active Airbnb listings in Starkville, indicating a high concentration in these sizes.
- A significant 37.3% of listings offer 3+ bedrooms, catering to larger groups and families seeking more space in Starkville.
Starkville Vacation Rental Guest Capacity Trends (2026)
Distribution of Listings by Guest Capacity
Guest Capacity Insights for Starkville
- The most common guest capacity trend in Starkville vacation rentals is listings accommodating 6 guests (24.6%). This suggests the primary traveler segment is likely larger groups.
- Properties designed for 6 guests and 4 guests dominate the Starkville STR market, accounting for 47.5% of listings.
- 50.3% of properties accommodate 6+ guests, serving the market segment for larger families or group travel in Starkville.
- On average, properties in Starkville are equipped to host 5.3 guests.
Starkville Airbnb Booking Patterns (2026): Available vs. Booked Days
Available Days Distribution
Booked Days Distribution
Booking Pattern Insights for Starkville
- The most common availability pattern in Starkville falls within the 271-366 days range, representing 54.2% of listings. This suggests many properties have significant open periods on their calendars.
- Approximately 82.4% of listings show high availability (181+ days open annually), indicating potential for increased bookings or specific owner usage patterns.
- For booked days, the 31-90 days range is most frequent in Starkville (38.1%), reflecting common guest stay durations or potential owner blocking patterns.
- A notable 18.0% of properties secure long booking periods (181+ days booked per year), highlighting successful long-term rental strategies or significant owner usage.
Starkville Airbnb Minimum Stay Requirements Analysis
Distribution of Listings by Minimum Night Requirement
1 Night
101 listings
28.5% of total
2 Nights
190 listings
53.7% of total
3 Nights
2 listings
0.6% of total
4-6 Nights
1 listings
0.3% of total
30+ Nights
60 listings
16.9% of total
Key Insights
- The most prevalent minimum stay requirement in Starkville is 2 Nights, adopted by 53.7% of listings. This highlights the market's preference for shorter, flexible bookings.
- A strong majority (82.2%) of the Starkville Airbnb data shows acceptance of very short stays (1-2 nights), indicating a dynamic, high-turnover market.
- A significant segment (16.9%) caters to monthly stays (30+ nights) in Starkville, pointing to opportunities in the extended-stay market.
Recommendations
- Align with the market by considering a 2 Nights minimum stay, as 53.7% of Starkville hosts use this setting.
- If feasible, allowing 1-night stays, especially midweek or during low season, could capture last-minute bookings, as only 28.5% currently do.
- Explore offering discounts for stays of 30+ nights to attract the 16.9% of the market seeking extended stays.
- Adjust minimum nights based on seasonality – potentially shorter during low season and longer during peak demand periods in Starkville.
Starkville Airbnb Cancellation Policy Trends Analysis (2026)
Limited
5 listings
1.4% of total
Flexible
63 listings
17.8% of total
Moderate
92 listings
26.1% of total
Firm
162 listings
45.9% of total
Strict
31 listings
8.8% of total
Cancellation Policy Insights for Starkville
- The prevailing Airbnb cancellation policy trend in Starkville is Firm, used by 45.9% of listings.
- A majority (54.7%) of hosts in Starkville utilize Firm or Strict policies, indicating a market where hosts prioritize booking security.
- Strict cancellation policies are quite rare (8.8%), potentially making listings with this policy less competitive unless justified by high demand or property type.
Recommendations for Hosts
- Consider adopting a Firm policy to align with the 45.9% market standard in Starkville.
- Using a Strict policy might deter some guests, as only 8.8% of listings use it. Evaluate if potential revenue protection outweighs possible lower booking rates.
- Regularly review your cancellation policy against competitors and market demand shifts in Starkville.
Starkville STR Booking Lead Time Analysis (2026)
Average Booking Lead Time by Month
Booking Lead Time Insights for Starkville
- The overall average booking lead time for vacation rentals in Starkville is 57 days.
- Guests book furthest in advance for stays during November (average 102 days), likely coinciding with peak travel demand or local events.
- The shortest booking windows occur for stays in January (average 17 days), indicating more last-minute travel plans during this time.
- Seasonally, Fall (94 days avg.) sees the longest lead times, while Winter (26 days avg.) has the shortest, reflecting typical travel planning cycles.
Recommendations for Hosts
- Use the overall average lead time (57 days) as a baseline for your pricing and availability strategy in Starkville.
- For November stays, consider implementing length-of-stay discounts or slightly higher rates for bookings made less than 102 days out to capitalize on advance planning.
- Target marketing efforts for the Fall season well in advance (at least 94 days) to capture early planners.
- Monitor your own booking lead times against these Starkville averages to identify opportunities for dynamic pricing adjustments.
Popular & Essential Airbnb Amenities in Starkville (2026)
Amenity Prevalence
Amenity Insights for Starkville
- Essential amenities in Starkville that guests expect include: Wifi, Air conditioning, TV, Smoke alarm. Lacking these (any) could significantly impact bookings.
- Popular amenities like Kitchen, Free parking on premises, Heating are common but not universal. Offering these can provide a competitive edge.
Recommendations for Hosts
- Ensure your listing includes all essential amenities for Starkville: Wifi, Air conditioning, TV, Smoke alarm.
- Prioritize adding missing essentials: Wifi, Air conditioning, TV, Smoke alarm.
- Consider adding popular differentiators like Kitchen or Free parking on premises to increase appeal.
- Highlight unique or less common amenities you offer (e.g., hot tub, dedicated workspace, EV charger) in your listing description and photos.
- Regularly check competitor amenities in Starkville to stay competitive.
Starkville Airbnb Guest Demographics & Profile Analysis (2026)
Guest Profile Summary for Starkville
- The typical guest profile for Airbnb in Starkville consists of primarily domestic travelers (99%), often arriving from nearby Memphis, typically belonging to the Post-2000s (Gen Z/Alpha) group (50%), primarily speaking English or Spanish.
- Domestic travelers account for 98.6% of guests.
- Key international markets include United States (98.6%) and Germany (0.3%).
- Top languages spoken are English (80.7%) followed by Spanish (11.5%).
- A significant demographic segment is the Post-2000s (Gen Z/Alpha) group, representing 50% of guests.
Recommendations for Hosts
- Target domestic marketing efforts towards travelers from Memphis and Franklin.
- Tailor amenities and listing descriptions to appeal to the dominant Post-2000s (Gen Z/Alpha) demographic (e.g., highlight fast WiFi, smart home features, local guides).
- Highlight unique local experiences or amenities relevant to the primary guest profile.
- Consider seasonal promotions aligned with peak travel times for key origin markets.
Nearby Short-Term Rental Market Comparison
How does the Starkville Airbnb market stack up against its neighbors? Compare key performance metrics like average monthly revenue, ADR, and occupancy rates in surrounding areas to understand the broader regional STR landscape.
| Market | Active Properties | Monthly Revenue | Daily Rate | Avg. Occupancy |
|---|---|---|---|---|
| Bremen | 23 | $4,914 | $603.74 | 33% |
| Arley | 47 | $4,531 | $525.71 | 35% |
| Crane Hill | 98 | $3,479 | $452.36 | 35% |
| Taylor | 12 | $3,235 | $657.63 | 29% |
| Houston | 13 | $3,234 | $556.49 | 34% |
| Oxford | 967 | $2,713 | $564.99 | 27% |
| Northport | 223 | $2,682 | $432.52 | 30% |
| Town Creek | 13 | $2,496 | $274.93 | 36% |
| Tuscaloosa | 366 | $2,421 | $446.03 | 26% |
| Muscle Shoals | 39 | $2,237 | $233.14 | 40% |