Poplarville Airbnb Market Analysis 2026: Short Term Rental Data & Vacation Rental Statistics in Mississippi, United States
Is Airbnb profitable in Poplarville in 2026? Explore comprehensive Airbnb analytics for Poplarville, Mississippi, United States to uncover income potential. This 2026 STR market report for Poplarville, based on AirROI data from February 2025 to January 2026, reveals key trends in the niche market of 20 active listings.
Whether you're considering an Airbnb investment in Poplarville, optimizing your existing vacation rental, or exploring rental arbitrage opportunities, understanding the Poplarville Airbnb data is crucial. Leveraging the low regulation environment is key to maximizing your short term rental income potential. Let's dive into the specifics.
Key Poplarville Airbnb Performance Metrics Overview
Monthly Airbnb Revenue Variations & Income Potential in Poplarville (2026)
Understanding the monthly revenue variations for Airbnb listings in Poplarville is key to maximizing your short term rental income potential. Seasonality significantly impacts earnings. Our analysis, based on data from the past 12 months, shows that the peak revenue month for STRs in Poplarville is typically March, while January often presents the lowest earnings, highlighting opportunities for strategic pricing adjustments during shoulder and low seasons. Explore the typical Airbnb income in Poplarville across different performance tiers:
- Best-in-class properties (Top 10%) achieve $4,174+ monthly, often utilizing dynamic pricing and superior guest experiences.
- Strong performing properties (Top 25%) earn $2,618 or more, indicating effective management and desirable locations/amenities.
- Typical properties (Median) generate around $1,937 per month, representing the average market performance.
- Entry-level properties (Bottom 25%) see earnings around $1,254, often with potential for optimization.
Average Monthly Airbnb Earnings Trend in Poplarville
Poplarville Airbnb Occupancy Rate Trends (2026)
Maximize your bookings by understanding the Poplarville STR occupancy trends. Seasonal demand shifts significantly influence how often properties are booked. Typically, Marchsees the highest demand (peak season occupancy), while January experiences the lowest (low season). Effective strategies, like adjusting minimum stays or offering promotions, can boost occupancy during slower periods. Here's how different property tiers perform in Poplarville:
- Best-in-class properties (Top 10%) achieve 78%+ occupancy, indicating high desirability and potentially optimized availability.
- Strong performing properties (Top 25%) maintain 64% or higher occupancy, suggesting good market fit and guest satisfaction.
- Typical properties (Median) have an occupancy rate around 41%.
- Entry-level properties (Bottom 25%) average 25% occupancy, potentially facing higher vacancy.
Average Monthly Occupancy Rate Trend in Poplarville
Average Daily Rate (ADR) Airbnb Trends in Poplarville (2026)
Effective short term rental pricing strategy in Poplarville involves understanding monthly ADR fluctuations. The Average Daily Rate (ADR) for Airbnb in Poplarville typically peaks in September and dips lowest during March. Leveraging Airbnb dynamic pricing tools or strategies based on this seasonality can significantly boost revenue. Here's a look at the typical nightly rates achieved:
- Best-in-class properties (Top 10%) command rates of $321+ per night, often due to premium features or locations.
- Strong performing properties (Top 25%) achieve nightly rates of $201 or more.
- Typical properties (Median) charge around $143 per night.
- Entry-level properties (Bottom 25%) earn around $105 per night.
Average Daily Rate (ADR) Trend by Month in Poplarville
Get Live Poplarville Market Intelligence 👇

Explore Real-time Analytics
Airbnb Seasonality Analysis & Trends in Poplarville (2026)
Peak Season (March, July, May)
- Revenue averages $2,748 per month
- Occupancy rates average 53.7%
- Daily rates average $193
Shoulder Season
- Revenue averages $2,278 per month
- Occupancy maintains around 46.0%
- Daily rates hold near $198
Low Season (January, September, December)
- Revenue drops to average $1,712 per month
- Occupancy decreases to average 31.9%
- Daily rates adjust to average $204
Seasonality Insights for Poplarville
- The Airbnb seasonality in Poplarville shows highly seasonal trends requiring careful strategy. While the sections above show seasonal averages, it's also insightful to look at the extremes:
- During the high season, the absolute peak month showcases Poplarville's highest earning potential, with monthly revenues capable of climbing to $2,931, occupancy reaching a high of 58.1%, and ADRs peaking at $210.
- Conversely, the slowest single month of the year, typically falling within the low season, marks the market's lowest point. In this month, revenue might dip to $1,329, occupancy could drop to 26.8%, and ADRs may adjust down to $189.
- Understanding both the seasonal averages and these monthly peaks and troughs in revenue, occupancy, and ADR is crucial for maximizing your Airbnb profit potential in Poplarville.
Seasonal Strategies for Maximizing Profit
- Peak Season: Maximize revenue through premium pricing and potentially longer minimum stays. Ensure high availability.
- Low Season: Offer competitive pricing, special promotions (e.g., extended stay discounts), and flexible cancellation policies. Target off-season travelers like remote workers or budget-conscious guests.
- Shoulder Seasons: Implement dynamic pricing that balances peak and low rates. Target weekend travelers or specific events. Offer slightly more flexible terms than peak season.
- Regularly analyze your own performance against these Poplarville seasonality benchmarks and adjust your pricing and availability strategy accordingly.
Best Areas for Airbnb Investment in Poplarville (2026)
Exploring the top neighborhoods for short-term rentals in Poplarville? This section highlights key areas, outlining why they are attractive for hosts and guests, along with notable local attractions. Consider these locations based on your target guest profile and investment strategy.
| Neighborhood / Area | Why Host Here? (Target Guests & Appeal) | Key Attractions & Landmarks |
|---|---|---|
| Historic Downtown Poplarville | Charming downtown area with historical architecture and community events. Attracts visitors interested in local culture and history. | Poplarville Historic District, Poplarville Farmers Market, Pearl River County Heritage Museum |
| Picayune Park | Local park with recreational facilities, popular for family gatherings and outdoor activities. Provides a serene atmosphere for relaxation and leisure. | Picayune City Park, Recreational trails, Picayune's Main Street |
| Pearl River County | Scenic rural area offering a glimpse into the natural beauty and Southern charm. Great for nature enthusiasts and those wanting a quiet getaway. | Pearl River, Fishing and hunting opportunities, Outdoor trails and parks |
| Big Creek Water Park | Family-friendly water park that attracts visitors looking for summertime fun and activities. Ideal for families with children. | Water slides, Lazy river, Picnic areas and playgrounds |
| Lena's Place | A popular local eatery known for its Southern cuisine and warm atmosphere. Often a hub for visitors looking to experience local flavors. | Local dining, Cultural events, Community gatherings |
| Mississippi award-winning wineries | Nearby wineries attract wine enthusiasts and those looking to explore local wine culture. Perfect for romantic getaways or group tours. | Wine tastings, Vineyard tours, Special events and festivals |
| Train Depot | Historically significant site that appeals to history buffs and train enthusiasts. Offers insights into the area’s past and charm. | Historic train depot, Railroad memorabilia, Local events |
| Hiking Trails | Surrounding areas offer beautiful hiking trails that attract outdoor lovers and adventurers. A great draw for those wanting to explore nature. | Great hiking paths, Scenic views, Wildlife watching |
Understanding Airbnb License Requirements & STR Laws in Poplarville (2026)
While Poplarville, Mississippi, United States currently shows low STR regulations, specific Airbnb license requirements might still exist or change. Always verify the latest short term rental regulations and Airbnb license requirements directly with local government authorities for Poplarville to ensure full compliance before hosting.
(Source: AirROI data, 2026, finding no licensed listings among those analyzed)
Top Performing Airbnb Properties in Poplarville (2026)
Benchmark your potential! Explore examples of top-performing Airbnb properties in Poplarvillebased on Trailing Twelve Month (TTM) revenue. Analyze their characteristics, revenue, occupancy rate, and ADR to understand what drives success in this market.
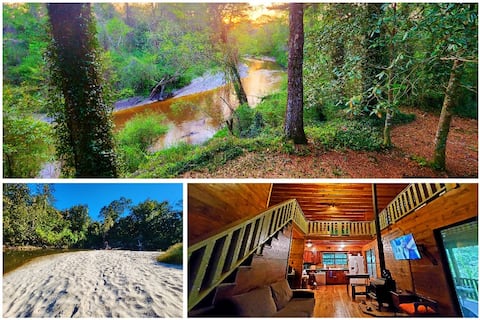
Waterfront Cabin with Private Beach, Views
Entire Place • 3 bedrooms

The Creekside Cabin Retreat #2 “The Lodge”
Entire Place • 2 bedrooms

Historical Country Home with Beautiful View
Entire Place • 2 bedrooms

Peaceful - Outdoor Bathtub/Shower/Pool / 2 porch
Entire Place • 2 bedrooms

Pond View Cottage close to Three Lakes Manor
Entire Place • 1 bedroom

Adorable cottage with pool and hot tub
Entire Place • 1 bedroom
Note: Performance varies based on location, size, amenities, seasonality, and management quality. Data reflects the past 12 months.
Top Performing Airbnb Hosts in Poplarville (2026)
Learn from the best! This table showcases top-performing Airbnb hosts in Poplarville based on the number of properties managed and estimated total revenue over the past year. Analyze their scale and performance metrics.
| Host Name | Properties | Grossing Revenue | Stay Reviews | Avg Rating |
|---|---|---|---|---|
| Polly | 1 | $78,535 | 100 | 4.98/5.0 |
| Melissa | 2 | $62,825 | 277 | 4.96/5.0 |
| Cindy | 2 | $59,313 | 145 | 4.99/5.0 |
| Paulette | 2 | $43,606 | 66 | 5.00/5.0 |
| Brandi | 2 | $37,169 | 66 | 4.88/5.0 |
| Kathleen | 1 | $30,614 | 99 | 4.98/5.0 |
| Craig Stewart | 1 | $21,226 | 23 | 5.00/5.0 |
| Audrey | 1 | $20,741 | 143 | 4.99/5.0 |
| Laura | 1 | $19,972 | 195 | 4.95/5.0 |
| J.D. | 1 | $19,802 | 44 | 4.91/5.0 |
Analyzing the strategies of top hosts, such as their property selection, pricing, and guest communication, can offer valuable lessons for optimizing your own Airbnb operations in Poplarville.
Dive Deeper: Advanced Poplarville STR Market Data (2026)
Ready to unlock more insights? AirROI provides access to advanced metrics and comprehensive Airbnb data for Poplarville. Explore detailed analytics beyond this report to refine your investment strategy, optimize pricing, and maximize your vacation rental profits.
Explore Advanced MetricsPoplarville Short-Term Rental Market Composition (2026): Property & Room Types
Room Type Distribution
Property Type Distribution
Market Composition Insights for Poplarville
- The Poplarville Airbnb market composition is heavily skewed towards Entire Home/Apt listings, which make up 95% of the 20 active rentals. This indicates strong guest preference for privacy and space.
- Looking at the property type distribution in Poplarville, House properties are the most common (60%), reflecting the local real estate landscape.
- Houses represent a significant 60% portion, catering likely to families or larger groups.
Poplarville Airbnb Room Capacity Analysis (2026): Bedroom Distribution
Distribution of Listings by Number of Bedrooms
Room Capacity Insights for Poplarville
- The dominant room capacity in Poplarville is 2 bedrooms listings, making up 45% of the market. This suggests a strong demand for properties suitable for couples or solo travelers.
- Together, 2 bedrooms and 1 bedroom properties represent 75.0% of the active Airbnb listings in Poplarville, indicating a high concentration in these sizes.
- A significant 25.0% of listings offer 3+ bedrooms, catering to larger groups and families seeking more space in Poplarville.
Poplarville Vacation Rental Guest Capacity Trends (2026)
Distribution of Listings by Guest Capacity
Guest Capacity Insights for Poplarville
- The most common guest capacity trend in Poplarville vacation rentals is listings accommodating 4 guests (35%). This suggests the primary traveler segment is likely small families or groups.
- Properties designed for 4 guests and 8+ guests dominate the Poplarville STR market, accounting for 65.0% of listings.
- 40.0% of properties accommodate 6+ guests, serving the market segment for larger families or group travel in Poplarville.
- On average, properties in Poplarville are equipped to host 5.0 guests.
Poplarville Airbnb Booking Patterns (2026): Available vs. Booked Days
Available Days Distribution
Booked Days Distribution
Booking Pattern Insights for Poplarville
- The most common availability pattern in Poplarville falls within the 181-270 days range, representing 45% of listings. This suggests many properties have significant open periods on their calendars.
- Approximately 75.0% of listings show high availability (181+ days open annually), indicating potential for increased bookings or specific owner usage patterns.
- For booked days, the 91-180 days range is most frequent in Poplarville (45%), reflecting common guest stay durations or potential owner blocking patterns.
- A notable 25.0% of properties secure long booking periods (181+ days booked per year), highlighting successful long-term rental strategies or significant owner usage.
Poplarville Airbnb Minimum Stay Requirements Analysis
Distribution of Listings by Minimum Night Requirement
1 Night
5 listings
25% of total
2 Nights
9 listings
45% of total
4-6 Nights
1 listings
5% of total
30+ Nights
5 listings
25% of total
Key Insights
- The most prevalent minimum stay requirement in Poplarville is 2 Nights, adopted by 45% of listings. This highlights the market's preference for shorter, flexible bookings.
- A strong majority (70.0%) of the Poplarville Airbnb data shows acceptance of very short stays (1-2 nights), indicating a dynamic, high-turnover market.
- A significant segment (25%) caters to monthly stays (30+ nights) in Poplarville, pointing to opportunities in the extended-stay market.
Recommendations
- Align with the market by considering a 2 Nights minimum stay, as 45% of Poplarville hosts use this setting.
- If feasible, allowing 1-night stays, especially midweek or during low season, could capture last-minute bookings, as only 25% currently do.
- Explore offering discounts for stays of 30+ nights to attract the 25% of the market seeking extended stays.
- Adjust minimum nights based on seasonality – potentially shorter during low season and longer during peak demand periods in Poplarville.
Poplarville Airbnb Cancellation Policy Trends Analysis (2026)
Flexible
7 listings
35% of total
Moderate
4 listings
20% of total
Firm
8 listings
40% of total
Strict
1 listings
5% of total
Cancellation Policy Insights for Poplarville
- The prevailing Airbnb cancellation policy trend in Poplarville is Firm, used by 40% of listings.
- There's a relatively balanced mix between guest-friendly (55.0%) and stricter (45.0%) policies, offering choices for different guest needs.
- Strict cancellation policies are quite rare (5%), potentially making listings with this policy less competitive unless justified by high demand or property type.
Recommendations for Hosts
- Consider adopting a Firm policy to align with the 40% market standard in Poplarville.
- Using a Strict policy might deter some guests, as only 5% of listings use it. Evaluate if potential revenue protection outweighs possible lower booking rates.
- Regularly review your cancellation policy against competitors and market demand shifts in Poplarville.
Poplarville STR Booking Lead Time Analysis (2026)
Average Booking Lead Time by Month
Booking Lead Time Insights for Poplarville
- The overall average booking lead time for vacation rentals in Poplarville is 42 days.
- Guests book furthest in advance for stays during December (average 55 days), likely coinciding with peak travel demand or local events.
- The shortest booking windows occur for stays in August (average 27 days), indicating more last-minute travel plans during this time.
- Seasonally, Spring (44 days avg.) sees the longest lead times, while Summer (38 days avg.) has the shortest, reflecting typical travel planning cycles.
Recommendations for Hosts
- Use the overall average lead time (42 days) as a baseline for your pricing and availability strategy in Poplarville.
- For December stays, consider implementing length-of-stay discounts or slightly higher rates for bookings made less than 55 days out to capitalize on advance planning.
- Target marketing efforts for the Spring season well in advance (at least 44 days) to capture early planners.
- Monitor your own booking lead times against these Poplarville averages to identify opportunities for dynamic pricing adjustments.
Popular & Essential Airbnb Amenities in Poplarville (2026)
Amenity Prevalence
Amenity Insights for Poplarville
- Essential amenities in Poplarville that guests expect include: Air conditioning, Wifi, Smoke alarm, Fire extinguisher, Heating, Hot water, Kitchen, Free parking on premises, Cooking basics, Dishes and silverware. Lacking these (any) could significantly impact bookings.
Recommendations for Hosts
- Ensure your listing includes all essential amenities for Poplarville: Air conditioning, Wifi, Smoke alarm, Fire extinguisher, Heating, Hot water, Kitchen, Free parking on premises, Cooking basics, Dishes and silverware.
- Prioritize adding missing essentials: Hot water, Kitchen, Free parking on premises, Cooking basics, Dishes and silverware.
- Highlight unique or less common amenities you offer (e.g., hot tub, dedicated workspace, EV charger) in your listing description and photos.
- Regularly check competitor amenities in Poplarville to stay competitive.
Poplarville Airbnb Guest Demographics & Profile Analysis (2026)
Guest Profile Summary for Poplarville
- The typical guest profile for Airbnb in Poplarville consists of primarily domestic travelers (97%), often arriving from nearby New Orleans, typically belonging to the Post-2000s (Gen Z/Alpha) group (50%), primarily speaking English or Dutch.
- Domestic travelers account for 97.2% of guests.
- Key international markets include United States (97.2%) and Netherlands (1.4%).
- Top languages spoken are English (88.7%) followed by Dutch (3.2%).
- A significant demographic segment is the Post-2000s (Gen Z/Alpha) group, representing 50% of guests.
Recommendations for Hosts
- Target domestic marketing efforts towards travelers from New Orleans and Greenville.
- Tailor amenities and listing descriptions to appeal to the dominant Post-2000s (Gen Z/Alpha) demographic (e.g., highlight fast WiFi, smart home features, local guides).
- Highlight unique local experiences or amenities relevant to the primary guest profile.
- Consider seasonal promotions aligned with peak travel times for key origin markets.
Nearby Short-Term Rental Market Comparison
How does the Poplarville Airbnb market stack up against its neighbors? Compare key performance metrics like average monthly revenue, ADR, and occupancy rates in surrounding areas to understand the broader regional STR landscape.
| Market | Active Properties | Monthly Revenue | Daily Rate | Avg. Occupancy |
|---|---|---|---|---|
| Plaquemines Parish | 28 | $4,733 | $413.26 | 40% |
| Dauphin Island | 612 | $3,407 | $376.02 | 38% |
| New Orleans | 4,857 | $3,260 | $298.03 | 42% |
| Grand Isle | 106 | $3,149 | $432.40 | 32% |
| Killian | 14 | $3,089 | $360.39 | 37% |
| Pass Christian | 179 | $2,762 | $294.40 | 36% |
| Ocean Springs | 259 | $2,518 | $217.19 | 42% |
| Ponchatoula | 49 | $2,512 | $231.70 | 39% |
| Bay Saint Louis | 286 | $2,488 | $265.09 | 35% |
| Covington | 65 | $2,427 | $204.72 | 47% |