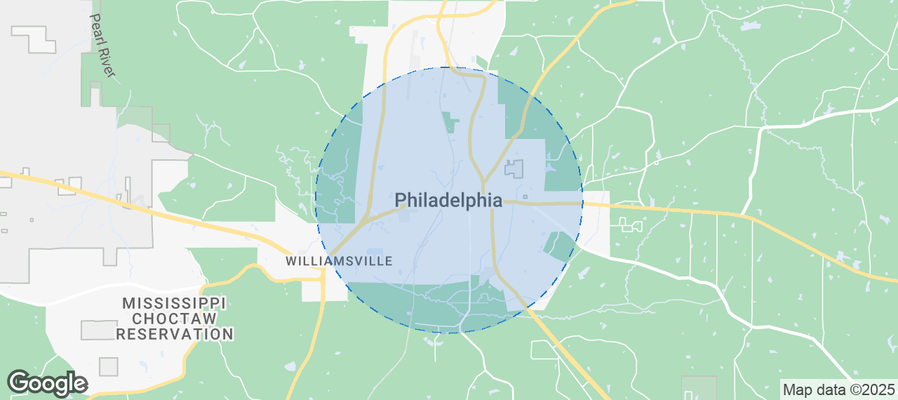
Philadelphia Airbnb Market Analysis 2026: Short Term Rental Data & Vacation Rental Statistics in Mississippi, United States
Is Airbnb profitable in Philadelphia in 2026? Explore comprehensive Airbnb analytics for Philadelphia, Mississippi, United States to uncover income potential. This 2026 STR market report for Philadelphia, based on AirROI data from February 2025 to January 2026, reveals key trends in the niche market of 21 active listings.
Whether you're considering an Airbnb investment in Philadelphia, optimizing your existing vacation rental, or exploring rental arbitrage opportunities, understanding the Philadelphia Airbnb data is crucial. Leveraging the low regulation environment is key to maximizing your short term rental income potential. Let's dive into the specifics.
Key Philadelphia Airbnb Performance Metrics Overview
Monthly Airbnb Revenue Variations & Income Potential in Philadelphia (2026)
Understanding the monthly revenue variations for Airbnb listings in Philadelphia is key to maximizing your short term rental income potential. Seasonality significantly impacts earnings. Our analysis, based on data from the past 12 months, shows that the peak revenue month for STRs in Philadelphia is typically November, while February often presents the lowest earnings, highlighting opportunities for strategic pricing adjustments during shoulder and low seasons. Explore the typical Airbnb income in Philadelphia across different performance tiers:
- Best-in-class properties (Top 10%) achieve $2,853+ monthly, often utilizing dynamic pricing and superior guest experiences.
- Strong performing properties (Top 25%) earn $1,791 or more, indicating effective management and desirable locations/amenities.
- Typical properties (Median) generate around $1,229 per month, representing the average market performance.
- Entry-level properties (Bottom 25%) see earnings around $668, often with potential for optimization.
Average Monthly Airbnb Earnings Trend in Philadelphia
Philadelphia Airbnb Occupancy Rate Trends (2026)
Maximize your bookings by understanding the Philadelphia STR occupancy trends. Seasonal demand shifts significantly influence how often properties are booked. Typically, Novembersees the highest demand (peak season occupancy), while January experiences the lowest (low season). Effective strategies, like adjusting minimum stays or offering promotions, can boost occupancy during slower periods. Here's how different property tiers perform in Philadelphia:
- Best-in-class properties (Top 10%) achieve 59%+ occupancy, indicating high desirability and potentially optimized availability.
- Strong performing properties (Top 25%) maintain 40% or higher occupancy, suggesting good market fit and guest satisfaction.
- Typical properties (Median) have an occupancy rate around 25%.
- Entry-level properties (Bottom 25%) average 14% occupancy, potentially facing higher vacancy.
Average Monthly Occupancy Rate Trend in Philadelphia
Average Daily Rate (ADR) Airbnb Trends in Philadelphia (2026)
Effective short term rental pricing strategy in Philadelphia involves understanding monthly ADR fluctuations. The Average Daily Rate (ADR) for Airbnb in Philadelphia typically peaks in October and dips lowest during March. Leveraging Airbnb dynamic pricing tools or strategies based on this seasonality can significantly boost revenue. Here's a look at the typical nightly rates achieved:
- Best-in-class properties (Top 10%) command rates of $175+ per night, often due to premium features or locations.
- Strong performing properties (Top 25%) achieve nightly rates of $164 or more.
- Typical properties (Median) charge around $148 per night.
- Entry-level properties (Bottom 25%) earn around $127 per night.
Average Daily Rate (ADR) Trend by Month in Philadelphia
Get Live Philadelphia Market Intelligence 👇
Explore Real-time Analytics
Airbnb Seasonality Analysis & Trends in Philadelphia (2026)
Peak Season (November, July, March)
- Revenue averages $1,849 per month
- Occupancy rates average 40.6%
- Daily rates average $155
Shoulder Season
- Revenue averages $1,356 per month
- Occupancy maintains around 30.5%
- Daily rates hold near $157
Low Season (January, February, May)
- Revenue drops to average $1,007 per month
- Occupancy decreases to average 18.4%
- Daily rates adjust to average $152
Seasonality Insights for Philadelphia
- The Airbnb seasonality in Philadelphia shows moderate seasonality with distinct peak and low periods. While the sections above show seasonal averages, it's also insightful to look at the extremes:
- During the high season, the absolute peak month showcases Philadelphia's highest earning potential, with monthly revenues capable of climbing to $1,902, occupancy reaching a high of 43.6%, and ADRs peaking at $165.
- Conversely, the slowest single month of the year, typically falling within the low season, marks the market's lowest point. In this month, revenue might dip to $928, occupancy could drop to 14.5%, and ADRs may adjust down to $149.
- Understanding both the seasonal averages and these monthly peaks and troughs in revenue, occupancy, and ADR is crucial for maximizing your Airbnb profit potential in Philadelphia.
Seasonal Strategies for Maximizing Profit
- Peak Season: Maximize revenue through premium pricing and potentially longer minimum stays. Ensure high availability.
- Low Season: Offer competitive pricing, special promotions (e.g., extended stay discounts), and flexible cancellation policies. Target off-season travelers like remote workers or budget-conscious guests.
- Shoulder Seasons: Implement dynamic pricing that balances peak and low rates. Target weekend travelers or specific events. Offer slightly more flexible terms than peak season.
- Regularly analyze your own performance against these Philadelphia seasonality benchmarks and adjust your pricing and availability strategy accordingly.
Best Areas for Airbnb Investment in Philadelphia (2026)
Exploring the top neighborhoods for short-term rentals in Philadelphia? This section highlights key areas, outlining why they are attractive for hosts and guests, along with notable local attractions. Consider these locations based on your target guest profile and investment strategy.
| Neighborhood / Area | Why Host Here? (Target Guests & Appeal) | Key Attractions & Landmarks |
|---|---|---|
| Historic Downtown Philadelphia | Charming downtown area rich in history and culture. Attractions include museums, historic buildings, and local dining. | Philly Museum of Natural Science, The Neshoba County Courthouse, Local dining options, Shopping and boutiques, Cultural events |
| Neshoba County Fairgrounds | Famous for hosting the Neshoba County Fair, attracting visitors from all over. Great for hosting during the fair season. | Neshoba County Fair, Live music, Food stalls, Carnival rides, Local arts and crafts |
| Lake Pushmataha | Scenic area for outdoor enthusiasts, fishing, and relaxation. Proximity to nature draws tourists looking for peace and activities. | Fishing and boating, Hiking trails, Picnic spots, Wildlife viewing, Lakefront activities |
| Cultural District | Vibrant area with local art galleries, theaters, and music venues. Attracts visitors interested in the arts and entertainment. | Local theaters, Art galleries, Live music venues, Cultural festivals, Community events |
| Cedar Hill | Residential area known for its peaceful environment and family-friendly atmosphere. Ideal for families visiting the area. | Parks and playgrounds, Family-friendly activities, Nearby schools, Community events, Local dining |
| North East Philadelphia | Suburban area within reach of the city's attractions, offering a local experience with access to amenities. | Shopping centers, Local restaurants, Parks, Community events, Family activities |
| Historic District Park | Beautiful park with historical significance, provides outdoor activities and family-friendly recreation options. | Walking trails, Historical sites, Picnic areas, Outdoor events, Visitor center |
| Arts and Crafts District | Emerging area known for local artisans and craft fairs. Attractive for tourists interested in handmade goods and local culture. | Artisan shops, Craft fairs, Workshops, Local galleries, Community markets |
Understanding Airbnb License Requirements & STR Laws in Philadelphia (2026)
While Philadelphia, Mississippi, United States currently shows low STR regulations, specific Airbnb license requirements might still exist or change. Always verify the latest short term rental regulations and Airbnb license requirements directly with local government authorities for Philadelphia to ensure full compliance before hosting.
(Source: AirROI data, 2026, finding no licensed listings among those analyzed)
Top Performing Airbnb Properties in Philadelphia (2026)
Benchmark your potential! Explore examples of top-performing Airbnb properties in Philadelphiabased on Trailing Twelve Month (TTM) revenue. Analyze their characteristics, revenue, occupancy rate, and ADR to understand what drives success in this market.
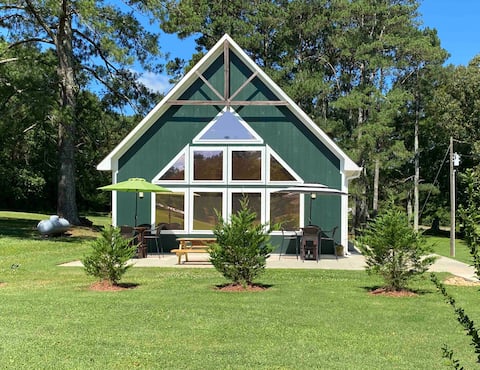
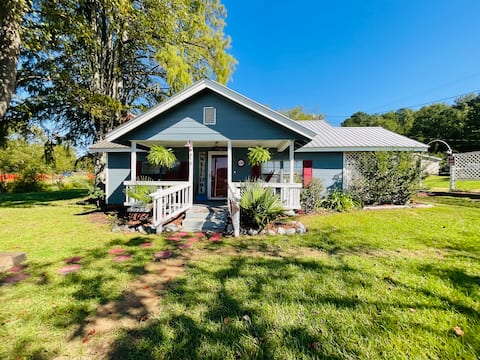
The Green Loft in Philadelphia, MS; (# 1)
Entire Place • 2 bedrooms

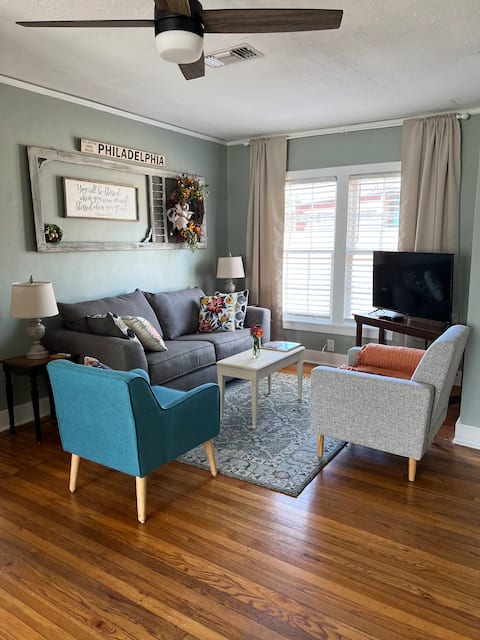
Neshoba Nest
Entire Place • 2 bedrooms
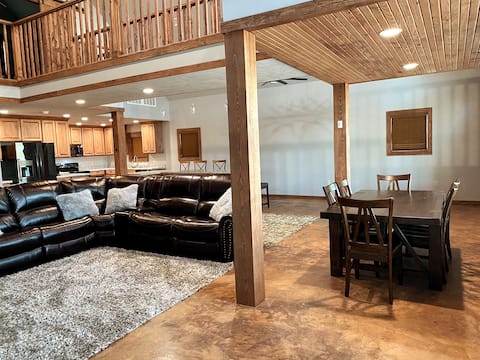
The Steel House on Poplar/Duplex
Entire Place • 2 bedrooms
The Big Green; (# 2)
Entire Place • 1 bedroom
World of Wellness 5
Entire Place • 2 bedrooms
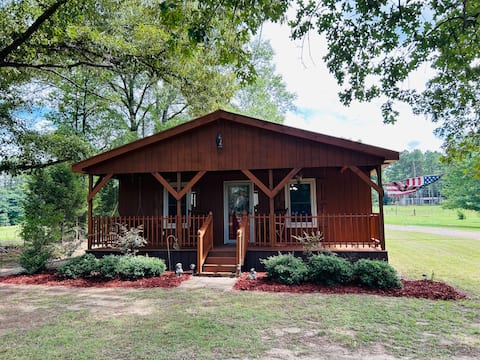
Bear Paws Cabin
Entire Place • 2 bedrooms
Note: Performance varies based on location, size, amenities, seasonality, and management quality. Data reflects the past 12 months.
Top Performing Airbnb Hosts in Philadelphia (2026)
Learn from the best! This table showcases top-performing Airbnb hosts in Philadelphia based on the number of properties managed and estimated total revenue over the past year. Analyze their scale and performance metrics.
| Host Name | Properties | Grossing Revenue | Stay Reviews | Avg Rating |
|---|---|---|---|---|
| Stephanie | 4 | $71,882 | 346 | 4.90/5.0 |
| Gwendolyn Breazeale Alexander | 3 | $40,434 | 119 | 4.94/5.0 |
| Brenda G | 2 | $39,086 | 421 | 4.96/5.0 |
| Brelan | 3 | $33,142 | 80 | 4.92/5.0 |
| Ronald | 1 | $17,726 | 54 | 4.85/5.0 |
| Pat | 2 | $17,640 | 27 | 4.92/5.0 |
| Hermalinda | 4 | $8,823 | 16 | 5.00/5.0 |
| Vikki | 1 | $8,670 | 22 | 5.00/5.0 |
| Jenny | 1 | $3,786 | 2 | Not Rated |
Analyzing the strategies of top hosts, such as their property selection, pricing, and guest communication, can offer valuable lessons for optimizing your own Airbnb operations in Philadelphia.
Dive Deeper: Advanced Philadelphia STR Market Data (2026)
Ready to unlock more insights? AirROI provides access to advanced metrics and comprehensive Airbnb data for Philadelphia. Explore detailed analytics beyond this report to refine your investment strategy, optimize pricing, and maximize your vacation rental profits.
Explore Advanced MetricsPhiladelphia Short-Term Rental Market Composition (2026): Property & Room Types
Room Type Distribution
Property Type Distribution
Market Composition Insights for Philadelphia
- The Philadelphia Airbnb market composition is heavily skewed towards Entire Home/Apt listings, which make up 95.2% of the 21 active rentals. This indicates strong guest preference for privacy and space.
- Looking at the property type distribution in Philadelphia, House properties are the most common (76.2%), reflecting the local real estate landscape.
- Houses represent a significant 76.2% portion, catering likely to families or larger groups.
Philadelphia Airbnb Room Capacity Analysis (2026): Bedroom Distribution
Distribution of Listings by Number of Bedrooms
Room Capacity Insights for Philadelphia
- The dominant room capacity in Philadelphia is 2 bedrooms listings, making up 66.7% of the market. This suggests a strong demand for properties suitable for couples or solo travelers.
- Together, 2 bedrooms and 1 bedroom properties represent 81.0% of the active Airbnb listings in Philadelphia, indicating a high concentration in these sizes.
- Listings with 3+ bedrooms (4.8%) represent a smaller niche, potentially indicating an underserved market for larger group accommodations in Philadelphia.
Philadelphia Vacation Rental Guest Capacity Trends (2026)
Distribution of Listings by Guest Capacity
Guest Capacity Insights for Philadelphia
- The most common guest capacity trend in Philadelphia vacation rentals is listings accommodating 5 guests (33.3%). This suggests the primary traveler segment is likely larger groups.
- Properties designed for 5 guests and 4 guests dominate the Philadelphia STR market, accounting for 61.9% of listings.
- On average, properties in Philadelphia are equipped to host 3.9 guests.
Philadelphia Airbnb Booking Patterns (2026): Available vs. Booked Days
Available Days Distribution
Booked Days Distribution
Booking Pattern Insights for Philadelphia
- The most common availability pattern in Philadelphia falls within the 271-366 days range, representing 61.9% of listings. This suggests many properties have significant open periods on their calendars.
- Approximately 100.0% of listings show high availability (181+ days open annually), indicating potential for increased bookings or specific owner usage patterns.
- For booked days, the 91-180 days range is most frequent in Philadelphia (38.1%), reflecting common guest stay durations or potential owner blocking patterns.
Philadelphia Airbnb Minimum Stay Requirements Analysis
Distribution of Listings by Minimum Night Requirement
1 Night
14 listings
66.7% of total
2 Nights
5 listings
23.8% of total
30+ Nights
2 listings
9.5% of total
Key Insights
- The most prevalent minimum stay requirement in Philadelphia is 1 Night, adopted by 66.7% of listings. This highlights the market's preference for shorter, flexible bookings.
- A strong majority (90.5%) of the Philadelphia Airbnb data shows acceptance of very short stays (1-2 nights), indicating a dynamic, high-turnover market.
Recommendations
- Align with the market by considering a 1 Night minimum stay, as 66.7% of Philadelphia hosts use this setting.
- Explore offering discounts for stays of 30+ nights to attract the 9.5% of the market seeking extended stays.
- Adjust minimum nights based on seasonality – potentially shorter during low season and longer during peak demand periods in Philadelphia.
Philadelphia Airbnb Cancellation Policy Trends Analysis (2026)
Flexible
6 listings
28.6% of total
Moderate
9 listings
42.9% of total
Firm
6 listings
28.6% of total
Cancellation Policy Insights for Philadelphia
- The prevailing Airbnb cancellation policy trend in Philadelphia is Moderate, used by 42.9% of listings.
- The market strongly favors guest-friendly terms, with 71.5% of listings offering Flexible or Moderate policies. This suggests guests in Philadelphia may expect booking flexibility.
Recommendations for Hosts
- Consider adopting a Moderate policy to align with the 42.9% market standard in Philadelphia.
- Regularly review your cancellation policy against competitors and market demand shifts in Philadelphia.
Philadelphia STR Booking Lead Time Analysis (2026)
Average Booking Lead Time by Month
Booking Lead Time Insights for Philadelphia
- The overall average booking lead time for vacation rentals in Philadelphia is 35 days.
- Guests book furthest in advance for stays during May (average 61 days), likely coinciding with peak travel demand or local events.
- The shortest booking windows occur for stays in February (average 11 days), indicating more last-minute travel plans during this time.
- Seasonally, Fall (46 days avg.) sees the longest lead times, while Winter (25 days avg.) has the shortest, reflecting typical travel planning cycles.
Recommendations for Hosts
- Use the overall average lead time (35 days) as a baseline for your pricing and availability strategy in Philadelphia.
- For May stays, consider implementing length-of-stay discounts or slightly higher rates for bookings made less than 61 days out to capitalize on advance planning.
- During February, focus on last-minute booking availability and promotions, as guests book with very short notice (11 days avg.).
- Target marketing efforts for the Fall season well in advance (at least 46 days) to capture early planners.
- Monitor your own booking lead times against these Philadelphia averages to identify opportunities for dynamic pricing adjustments.
Popular & Essential Airbnb Amenities in Philadelphia (2026)
Amenity Prevalence
Amenity Insights for Philadelphia
- Essential amenities in Philadelphia that guests expect include: Free parking on premises, Wifi, TV, Hot water, Air conditioning. Lacking these (any) could significantly impact bookings.
- Popular amenities like Dishes and silverware, Smoke alarm, Microwave are common but not universal. Offering these can provide a competitive edge.
Recommendations for Hosts
- Ensure your listing includes all essential amenities for Philadelphia: Free parking on premises, Wifi, TV, Hot water, Air conditioning.
- Prioritize adding missing essentials: Free parking on premises, Wifi, TV, Hot water, Air conditioning.
- Consider adding popular differentiators like Dishes and silverware or Smoke alarm to increase appeal.
- Highlight unique or less common amenities you offer (e.g., hot tub, dedicated workspace, EV charger) in your listing description and photos.
- Regularly check competitor amenities in Philadelphia to stay competitive.
Philadelphia Airbnb Guest Demographics & Profile Analysis (2026)
Guest Profile Summary for Philadelphia
- The typical guest profile for Airbnb in Philadelphia consists of primarily domestic travelers (98%), often arriving from nearby Hendersonville, typically belonging to the Post-2000s (Gen Z/Alpha) group (50%), primarily speaking English or Spanish.
- Domestic travelers account for 97.6% of guests.
- Key international markets include United States (97.6%) and United Kingdom (2.4%).
- Top languages spoken are English (91.4%) followed by Spanish (5.7%).
- A significant demographic segment is the Post-2000s (Gen Z/Alpha) group, representing 50% of guests.
Recommendations for Hosts
- Target domestic marketing efforts towards travelers from Hendersonville and Ocean Springs.
- Tailor amenities and listing descriptions to appeal to the dominant Post-2000s (Gen Z/Alpha) demographic (e.g., highlight fast WiFi, smart home features, local guides).
- Highlight unique local experiences or amenities relevant to the primary guest profile.
- Consider seasonal promotions aligned with peak travel times for key origin markets.
Nearby Short-Term Rental Market Comparison
How does the Philadelphia Airbnb market stack up against its neighbors? Compare key performance metrics like average monthly revenue, ADR, and occupancy rates in surrounding areas to understand the broader regional STR landscape.
| Market | Active Properties | Monthly Revenue | Daily Rate | Avg. Occupancy |
|---|---|---|---|---|
| Petal | 15 | $2,415 | $216.54 | 41% |
| Cleveland | 18 | $2,118 | $201.82 | 37% |
| Laurel | 158 | $1,944 | $170.74 | 41% |
| Brandon | 80 | $1,917 | $196.65 | 40% |
| Starkville | 354 | $1,892 | $251.44 | 35% |
| Pearl | 13 | $1,769 | $191.82 | 39% |
| Greenwood | 14 | $1,755 | $241.46 | 27% |
| West Point | 17 | $1,730 | $162.66 | 43% |
| Hattiesburg | 178 | $1,634 | $171.60 | 38% |
| Kosciusko | 11 | $1,621 | $163.80 | 33% |