Natchez Airbnb Market Analysis 2026: Short Term Rental Data & Vacation Rental Statistics in Mississippi, United States
Is Airbnb profitable in Natchez in 2026? Explore comprehensive Airbnb analytics for Natchez, Mississippi, United States to uncover income potential. This 2026 STR market report for Natchez, based on AirROI data from February 2025 to January 2026, reveals key trends in the niche market of 157 active listings.
Whether you're considering an Airbnb investment in Natchez, optimizing your existing vacation rental, or exploring rental arbitrage opportunities, understanding the Natchez Airbnb data is crucial. Leveraging the low regulation environment is key to maximizing your short term rental income potential. Let's dive into the specifics.
Key Natchez Airbnb Performance Metrics Overview
Monthly Airbnb Revenue Variations & Income Potential in Natchez (2026)
Understanding the monthly revenue variations for Airbnb listings in Natchez is key to maximizing your short term rental income potential. Seasonality significantly impacts earnings. Our analysis, based on data from the past 12 months, shows that the peak revenue month for STRs in Natchez is typically October, while February often presents the lowest earnings, highlighting opportunities for strategic pricing adjustments during shoulder and low seasons. Explore the typical Airbnb income in Natchez across different performance tiers:
- Best-in-class properties (Top 10%) achieve $3,654+ monthly, often utilizing dynamic pricing and superior guest experiences.
- Strong performing properties (Top 25%) earn $2,427 or more, indicating effective management and desirable locations/amenities.
- Typical properties (Median) generate around $1,479 per month, representing the average market performance.
- Entry-level properties (Bottom 25%) see earnings around $833, often with potential for optimization.
Average Monthly Airbnb Earnings Trend in Natchez
Natchez Airbnb Occupancy Rate Trends (2026)
Maximize your bookings by understanding the Natchez STR occupancy trends. Seasonal demand shifts significantly influence how often properties are booked. Typically, Aprilsees the highest demand (peak season occupancy), while January experiences the lowest (low season). Effective strategies, like adjusting minimum stays or offering promotions, can boost occupancy during slower periods. Here's how different property tiers perform in Natchez:
- Best-in-class properties (Top 10%) achieve 62%+ occupancy, indicating high desirability and potentially optimized availability.
- Strong performing properties (Top 25%) maintain 44% or higher occupancy, suggesting good market fit and guest satisfaction.
- Typical properties (Median) have an occupancy rate around 27%.
- Entry-level properties (Bottom 25%) average 15% occupancy, potentially facing higher vacancy.
Average Monthly Occupancy Rate Trend in Natchez
Average Daily Rate (ADR) Airbnb Trends in Natchez (2026)
Effective short term rental pricing strategy in Natchez involves understanding monthly ADR fluctuations. The Average Daily Rate (ADR) for Airbnb in Natchez typically peaks in October and dips lowest during February. Leveraging Airbnb dynamic pricing tools or strategies based on this seasonality can significantly boost revenue. Here's a look at the typical nightly rates achieved:
- Best-in-class properties (Top 10%) command rates of $289+ per night, often due to premium features or locations.
- Strong performing properties (Top 25%) achieve nightly rates of $212 or more.
- Typical properties (Median) charge around $172 per night.
- Entry-level properties (Bottom 25%) earn around $141 per night.
Average Daily Rate (ADR) Trend by Month in Natchez
Get Live Natchez Market Intelligence 👇

Explore Real-time Analytics
Airbnb Seasonality Analysis & Trends in Natchez (2026)
Peak Season (October, March, May)
- Revenue averages $2,385 per month
- Occupancy rates average 36.6%
- Daily rates average $203
Shoulder Season
- Revenue averages $1,922 per month
- Occupancy maintains around 31.3%
- Daily rates hold near $203
Low Season (January, February, August)
- Revenue drops to average $1,562 per month
- Occupancy decreases to average 27.0%
- Daily rates adjust to average $197
Seasonality Insights for Natchez
- The Airbnb seasonality in Natchez shows moderate seasonality with distinct peak and low periods. While the sections above show seasonal averages, it's also insightful to look at the extremes:
- During the high season, the absolute peak month showcases Natchez's highest earning potential, with monthly revenues capable of climbing to $2,546, occupancy reaching a high of 37.9%, and ADRs peaking at $213.
- Conversely, the slowest single month of the year, typically falling within the low season, marks the market's lowest point. In this month, revenue might dip to $1,471, occupancy could drop to 25.3%, and ADRs may adjust down to $192.
- Understanding both the seasonal averages and these monthly peaks and troughs in revenue, occupancy, and ADR is crucial for maximizing your Airbnb profit potential in Natchez.
Seasonal Strategies for Maximizing Profit
- Peak Season: Maximize revenue through premium pricing and potentially longer minimum stays. Ensure high availability.
- Low Season: Offer competitive pricing, special promotions (e.g., extended stay discounts), and flexible cancellation policies. Target off-season travelers like remote workers or budget-conscious guests.
- Shoulder Seasons: Implement dynamic pricing that balances peak and low rates. Target weekend travelers or specific events. Offer slightly more flexible terms than peak season.
- Regularly analyze your own performance against these Natchez seasonality benchmarks and adjust your pricing and availability strategy accordingly.
Best Areas for Airbnb Investment in Natchez (2026)
Exploring the top neighborhoods for short-term rentals in Natchez? This section highlights key areas, outlining why they are attractive for hosts and guests, along with notable local attractions. Consider these locations based on your target guest profile and investment strategy.
| Neighborhood / Area | Why Host Here? (Target Guests & Appeal) | Key Attractions & Landmarks |
|---|---|---|
| Historic District | Natchez's Historic District is full of antebellum homes and rich history, making it a prime location for tourists interested in Southern heritage. | Natchez National Historical Park, Longwood, Rosalie Mansion, Forks of the Road, St. Mary's Basilica |
| Downtown Natchez | The vibrant heart of Natchez with shops, restaurants, and entertainment options, perfect for guests looking for convenience. | Natchez Bluff, Catherine's Bar, Natchez Grand Hotel, Riverfront Park, The Natchez Community Center |
| Natchez Trace Parkway | A scenic drive that attracts nature lovers and outdoor enthusiasts. Rentals here cater to those wanting to explore the great outdoors. | Natchez Trace Parkway, Emerald Mound, Mount Locust, Cypress Swamp, Chickasaw Village Site |
| Rosalie | An area known for its historic homes and the Mississippi River views, appealing to guests seeking picturesque settings. | Rosalie Mansion, Mississippi River, Historic Natchez Foundation, Natchez Cemetery, Natchez Historic District |
| Magnolia Bluffs Casino | Attracts visitors looking for entertainment and nightlife, providing a fun experience for guests. | Magnolia Bluffs Casino, Gaming Facilities, Buffet and Restaurants, Live Entertainment |
| Natchez State Park | A great location for nature lovers, with hiking trails and camping. Ideal for guests wanting outdoor activities. | Lake St. John, Hiking Trails, Wildlife Observation, Picnic Areas |
| U.S. 61 South | Known as the Great River Road, it's a significant route with easy access to nearby attractions. | Historic Churches, Civil War Battlefields, Local Restaurants, Antique Shops |
| Grove Street | A charming residential area that appeals to families and travelers looking for a quieter neighborhood vibe in Natchez. | Local Cafes, Art Shops, Community Park, Residential Homes |
Understanding Airbnb License Requirements & STR Laws in Natchez (2026)
While Natchez, Mississippi, United States currently shows low STR regulations, specific Airbnb license requirements might still exist or change. Always verify the latest short term rental regulations and Airbnb license requirements directly with local government authorities for Natchez to ensure full compliance before hosting.
(Source: AirROI data, 2026, finding no licensed listings among those analyzed)
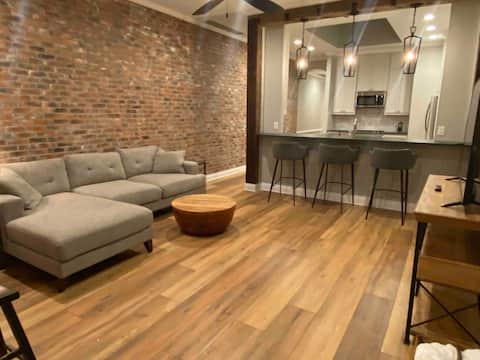
Top Performing Airbnb Properties in Natchez (2026)
Benchmark your potential! Explore examples of top-performing Airbnb properties in Natchezbased on Trailing Twelve Month (TTM) revenue. Analyze their characteristics, revenue, occupancy rate, and ADR to understand what drives success in this market.
The River Walk Inn - Rooms 801-806
Private Room • 6 bedrooms

Spacious 1835 home close to downtown and the river
Entire Place • 4 bedrooms

Dixon Loft - stunning space w/balcony on Main
Entire Place • 3 bedrooms
Natchez Getaway - a fully renovated downtown condo
Entire Place • 3 bedrooms

Historic Downtown Natchez Grand Victorian
Entire Place • 4 bedrooms

Mark Twain #2
Entire Place • 1 bedroom
Note: Performance varies based on location, size, amenities, seasonality, and management quality. Data reflects the past 12 months.
Top Performing Airbnb Hosts in Natchez (2026)
Learn from the best! This table showcases top-performing Airbnb hosts in Natchez based on the number of properties managed and estimated total revenue over the past year. Analyze their scale and performance metrics.
| Host Name | Properties | Grossing Revenue | Stay Reviews | Avg Rating |
|---|---|---|---|---|
| James | 9 | $318,451 | 1037 | 4.92/5.0 |
| Michael | 15 | $163,556 | 77 | 4.81/5.0 |
| Terrel | 4 | $97,078 | 153 | 4.88/5.0 |
| Jacqueline | 1 | $92,585 | 80 | 4.98/5.0 |
| Tanya | 5 | $82,895 | 233 | 4.99/5.0 |
| Kim | 2 | $75,466 | 160 | 4.75/5.0 |
| Richard | 3 | $66,779 | 210 | 4.95/5.0 |
| Jennifer | 1 | $66,574 | 51 | 5.00/5.0 |
| Stacy | 3 | $64,497 | 57 | 4.97/5.0 |
| Joanne | 3 | $62,865 | 1561 | 4.90/5.0 |
Analyzing the strategies of top hosts, such as their property selection, pricing, and guest communication, can offer valuable lessons for optimizing your own Airbnb operations in Natchez.
Dive Deeper: Advanced Natchez STR Market Data (2026)
Ready to unlock more insights? AirROI provides access to advanced metrics and comprehensive Airbnb data for Natchez. Explore detailed analytics beyond this report to refine your investment strategy, optimize pricing, and maximize your vacation rental profits.
Explore Advanced MetricsNatchez Short-Term Rental Market Composition (2026): Property & Room Types
Room Type Distribution
Property Type Distribution
Market Composition Insights for Natchez
- The Natchez Airbnb market composition is heavily skewed towards Entire Home/Apt listings, which make up 62.4% of the 157 active rentals. This indicates strong guest preference for privacy and space.
- However, a notable 34.4% share for Private Rooms suggests opportunities for budget-conscious travelers or hosts renting out spare rooms.
- Looking at the property type distribution in Natchez, House properties are the most common (47.8%), reflecting the local real estate landscape.
- Houses represent a significant 47.8% portion, catering likely to families or larger groups.
- The presence of 34.4% Hotel/Boutique listings indicates integration with traditional hospitality.
- Smaller segments like others, outdoor/unique (combined 1.9%) offer potential for unique stay experiences.
Natchez Airbnb Room Capacity Analysis (2026): Bedroom Distribution
Distribution of Listings by Number of Bedrooms
Room Capacity Insights for Natchez
- The dominant room capacity in Natchez is 2 bedrooms listings, making up 29.9% of the market. This suggests a strong demand for properties suitable for couples or solo travelers.
- Together, 2 bedrooms and 1 bedroom properties represent 57.3% of the active Airbnb listings in Natchez, indicating a high concentration in these sizes.
- A significant 25.4% of listings offer 3+ bedrooms, catering to larger groups and families seeking more space in Natchez.
Natchez Vacation Rental Guest Capacity Trends (2026)
Distribution of Listings by Guest Capacity
Guest Capacity Insights for Natchez
- The most common guest capacity trend in Natchez vacation rentals is listings accommodating 4 guests (19.7%). This suggests the primary traveler segment is likely small families or groups.
- Properties designed for 4 guests and 2 guests dominate the Natchez STR market, accounting for 38.8% of listings.
- 25.5% of properties accommodate 6+ guests, serving the market segment for larger families or group travel in Natchez.
- On average, properties in Natchez are equipped to host 3.4 guests.
Natchez Airbnb Booking Patterns (2026): Available vs. Booked Days
Available Days Distribution
Booked Days Distribution
Booking Pattern Insights for Natchez
- The most common availability pattern in Natchez falls within the 271-366 days range, representing 59.9% of listings. This suggests many properties have significant open periods on their calendars.
- Approximately 88.6% of listings show high availability (181+ days open annually), indicating potential for increased bookings or specific owner usage patterns.
- For booked days, the 31-90 days range is most frequent in Natchez (44.6%), reflecting common guest stay durations or potential owner blocking patterns.
- A notable 12.1% of properties secure long booking periods (181+ days booked per year), highlighting successful long-term rental strategies or significant owner usage.
Natchez Airbnb Minimum Stay Requirements Analysis
Distribution of Listings by Minimum Night Requirement
1 Night
96 listings
61.1% of total
2 Nights
42 listings
26.8% of total
3 Nights
4 listings
2.5% of total
30+ Nights
15 listings
9.6% of total
Key Insights
- The most prevalent minimum stay requirement in Natchez is 1 Night, adopted by 61.1% of listings. This highlights the market's preference for shorter, flexible bookings.
- A strong majority (87.9%) of the Natchez Airbnb data shows acceptance of very short stays (1-2 nights), indicating a dynamic, high-turnover market.
Recommendations
- Align with the market by considering a 1 Night minimum stay, as 61.1% of Natchez hosts use this setting.
- Explore offering discounts for stays of 30+ nights to attract the 9.6% of the market seeking extended stays.
- Adjust minimum nights based on seasonality – potentially shorter during low season and longer during peak demand periods in Natchez.
Natchez Airbnb Cancellation Policy Trends Analysis (2026)
Limited
1 listings
0.6% of total
Flexible
59 listings
37.6% of total
Moderate
55 listings
35% of total
Firm
35 listings
22.3% of total
Strict
7 listings
4.5% of total
Cancellation Policy Insights for Natchez
- The prevailing Airbnb cancellation policy trend in Natchez is Flexible, used by 37.6% of listings.
- The market strongly favors guest-friendly terms, with 72.6% of listings offering Flexible or Moderate policies. This suggests guests in Natchez may expect booking flexibility.
- Strict cancellation policies are quite rare (4.5%), potentially making listings with this policy less competitive unless justified by high demand or property type.
Recommendations for Hosts
- Consider adopting a Flexible policy to align with the 37.6% market standard in Natchez.
- Using a Strict policy might deter some guests, as only 4.5% of listings use it. Evaluate if potential revenue protection outweighs possible lower booking rates.
- Regularly review your cancellation policy against competitors and market demand shifts in Natchez.
Natchez STR Booking Lead Time Analysis (2026)
Average Booking Lead Time by Month
Booking Lead Time Insights for Natchez
- The overall average booking lead time for vacation rentals in Natchez is 65 days.
- Guests book furthest in advance for stays during October (average 116 days), likely coinciding with peak travel demand or local events.
- The shortest booking windows occur for stays in January (average 38 days), indicating more last-minute travel plans during this time.
- Seasonally, Fall (87 days avg.) sees the longest lead times, while Summer (49 days avg.) has the shortest, reflecting typical travel planning cycles.
Recommendations for Hosts
- Use the overall average lead time (65 days) as a baseline for your pricing and availability strategy in Natchez.
- For October stays, consider implementing length-of-stay discounts or slightly higher rates for bookings made less than 116 days out to capitalize on advance planning.
- Target marketing efforts for the Fall season well in advance (at least 87 days) to capture early planners.
- Monitor your own booking lead times against these Natchez averages to identify opportunities for dynamic pricing adjustments.
Popular & Essential Airbnb Amenities in Natchez (2026)
Amenity Prevalence
Amenity Insights for Natchez
- Essential amenities in Natchez that guests expect include: Air conditioning, TV, Wifi, Free parking on premises, Smoke alarm, Heating. Lacking these (any) could significantly impact bookings.
- Popular amenities like Fire extinguisher, Hair dryer, Iron are common but not universal. Offering these can provide a competitive edge.
Recommendations for Hosts
- Ensure your listing includes all essential amenities for Natchez: Air conditioning, TV, Wifi, Free parking on premises, Smoke alarm, Heating.
- Prioritize adding missing essentials: TV, Wifi, Free parking on premises, Smoke alarm, Heating.
- Consider adding popular differentiators like Fire extinguisher or Hair dryer to increase appeal.
- Highlight unique or less common amenities you offer (e.g., hot tub, dedicated workspace, EV charger) in your listing description and photos.
- Regularly check competitor amenities in Natchez to stay competitive.
Natchez Airbnb Guest Demographics & Profile Analysis (2026)
Guest Profile Summary for Natchez
- The typical guest profile for Airbnb in Natchez consists of primarily domestic travelers (94%), often arriving from nearby New Orleans, typically belonging to the Post-2000s (Gen Z/Alpha) group (50%), primarily speaking English or Spanish.
- Domestic travelers account for 94.4% of guests.
- Key international markets include United States (94.4%) and United Kingdom (1.8%).
- Top languages spoken are English (80.4%) followed by Spanish (6.7%).
- A significant demographic segment is the Post-2000s (Gen Z/Alpha) group, representing 50% of guests.
Recommendations for Hosts
- Target domestic marketing efforts towards travelers from New Orleans and Baton Rouge.
- Tailor amenities and listing descriptions to appeal to the dominant Post-2000s (Gen Z/Alpha) demographic (e.g., highlight fast WiFi, smart home features, local guides).
- Highlight unique local experiences or amenities relevant to the primary guest profile.
- Consider seasonal promotions aligned with peak travel times for key origin markets.
Nearby Short-Term Rental Market Comparison
How does the Natchez Airbnb market stack up against its neighbors? Compare key performance metrics like average monthly revenue, ADR, and occupancy rates in surrounding areas to understand the broader regional STR landscape.
| Market | Active Properties | Monthly Revenue | Daily Rate | Avg. Occupancy |
|---|---|---|---|---|
| Killian | 14 | $3,089 | $360.39 | 37% |
| Jonesboro | 11 | $2,988 | $229.32 | 42% |
| Homer | 11 | $2,891 | $236.92 | 40% |
| New Roads | 27 | $2,790 | $361.00 | 32% |
| Ponchatoula | 49 | $2,512 | $231.70 | 39% |
| Covington | 65 | $2,427 | $204.72 | 47% |
| Chatham | 10 | $2,339 | $187.26 | 46% |
| Farmerville | 28 | $2,279 | $196.18 | 40% |
| St. George | 70 | $2,194 | $231.63 | 40% |
| Gonzales | 37 | $2,142 | $175.66 | 44% |