Como Airbnb Market Analysis 2025: Short Term Rental Data & Vacation Rental Statistics in Mississippi, United States
Is Airbnb profitable in Como in 2025? Explore comprehensive Airbnb analytics for Como, Mississippi, United States to uncover income potential. This 2025 STR market report for Como, based on AirROI data from December 2024 to November 2025, reveals key trends in the niche market of 19 active listings.
Whether you're considering an Airbnb investment in Como, optimizing your existing vacation rental, or exploring rental arbitrage opportunities, understanding the Como Airbnb data is crucial. Leveraging the low regulation environment is key to maximizing your short term rental income potential. Let's dive into the specifics.
Key Como Airbnb Performance Metrics Overview
Monthly Airbnb Revenue Variations & Income Potential in Como (2025)
Understanding the monthly revenue variations for Airbnb listings in Como is key to maximizing your short term rental income potential. Seasonality significantly impacts earnings. Our analysis, based on data from the past 12 months, shows that the peak revenue month for STRs in Como is typically March, while January often presents the lowest earnings, highlighting opportunities for strategic pricing adjustments during shoulder and low seasons. Explore the typical Airbnb income in Como across different performance tiers:
- Best-in-class properties (Top 10%) achieve $3,742+ monthly, often utilizing dynamic pricing and superior guest experiences.
- Strong performing properties (Top 25%) earn $2,370 or more, indicating effective management and desirable locations/amenities.
- Typical properties (Median) generate around $1,305 per month, representing the average market performance.
- Entry-level properties (Bottom 25%) see earnings around $744, often with potential for optimization.
Average Monthly Airbnb Earnings Trend in Como
Como Airbnb Occupancy Rate Trends (2025)
Maximize your bookings by understanding the Como STR occupancy trends. Seasonal demand shifts significantly influence how often properties are booked. Typically, Septembersees the highest demand (peak season occupancy), while January experiences the lowest (low season). Effective strategies, like adjusting minimum stays or offering promotions, can boost occupancy during slower periods. Here's how different property tiers perform in Como:
- Best-in-class properties (Top 10%) achieve 64%+ occupancy, indicating high desirability and potentially optimized availability.
- Strong performing properties (Top 25%) maintain 46% or higher occupancy, suggesting good market fit and guest satisfaction.
- Typical properties (Median) have an occupancy rate around 24%.
- Entry-level properties (Bottom 25%) average 14% occupancy, potentially facing higher vacancy.
Average Monthly Occupancy Rate Trend in Como
Average Daily Rate (ADR) Airbnb Trends in Como (2025)
Effective short term rental pricing strategy in Como involves understanding monthly ADR fluctuations. The Average Daily Rate (ADR) for Airbnb in Como typically peaks in November and dips lowest during April. Leveraging Airbnb dynamic pricing tools or strategies based on this seasonality can significantly boost revenue. Here's a look at the typical nightly rates achieved:
- Best-in-class properties (Top 10%) command rates of $271+ per night, often due to premium features or locations.
- Strong performing properties (Top 25%) achieve nightly rates of $211 or more.
- Typical properties (Median) charge around $165 per night.
- Entry-level properties (Bottom 25%) earn around $133 per night.
Average Daily Rate (ADR) Trend by Month in Como
Get Live Como Market Intelligence 👇
Explore Real-time Analytics
Airbnb Seasonality Analysis & Trends in Como (2025)
Peak Season (March, September, July)
- Revenue averages $2,221 per month
- Occupancy rates average 39.5%
- Daily rates average $177
Shoulder Season
- Revenue averages $1,793 per month
- Occupancy maintains around 33.2%
- Daily rates hold near $180
Low Season (January, February, May)
- Revenue drops to average $1,215 per month
- Occupancy decreases to average 22.5%
- Daily rates adjust to average $177
Seasonality Insights for Como
- The Airbnb seasonality in Como shows highly seasonal trends requiring careful strategy. While the sections above show seasonal averages, it's also insightful to look at the extremes:
- During the high season, the absolute peak month showcases Como's highest earning potential, with monthly revenues capable of climbing to $2,324, occupancy reaching a high of 42.3%, and ADRs peaking at $187.
- Conversely, the slowest single month of the year, typically falling within the low season, marks the market's lowest point. In this month, revenue might dip to $958, occupancy could drop to 18.8%, and ADRs may adjust down to $171.
- Understanding both the seasonal averages and these monthly peaks and troughs in revenue, occupancy, and ADR is crucial for maximizing your Airbnb profit potential in Como.
Seasonal Strategies for Maximizing Profit
- Peak Season: Maximize revenue through premium pricing and potentially longer minimum stays. Ensure high availability.
- Low Season: Offer competitive pricing, special promotions (e.g., extended stay discounts), and flexible cancellation policies. Target off-season travelers like remote workers or budget-conscious guests.
- Shoulder Seasons: Implement dynamic pricing that balances peak and low rates. Target weekend travelers or specific events. Offer slightly more flexible terms than peak season.
- Regularly analyze your own performance against these Como seasonality benchmarks and adjust your pricing and availability strategy accordingly.
Best Areas for Airbnb Investment in Como (2025)
Exploring the top neighborhoods for short-term rentals in Como? This section highlights key areas, outlining why they are attractive for hosts and guests, along with notable local attractions. Consider these locations based on your target guest profile and investment strategy.
| Neighborhood / Area | Why Host Here? (Target Guests & Appeal) | Key Attractions & Landmarks |
|---|---|---|
| Downtown Como | The heart of Como with rich history and local shops. It’s attractive for visitors looking to explore small-town charm and enjoy local cuisine. | Como Historic District, Local Restaurants, Como Inn, The Baird House, Como City Park |
| Como Lake Area | This area offers beautiful views of the lake and is perfect for fishing, boating, and relaxing. It's popular among families and outdoor enthusiasts. | Como Lake, Fishing and boating activities, Picnic areas, Nature trails, Wildlife watching |
| Tchula Road | Located close to the main highway with easy access to nearby attractions. It’s ideal for travelers passing through and offers budget-friendly hosting. | Restaurants, Gas stations, Quick access to events, Shopping areas, Nearby historical sites |
| Como Community Park | A family-friendly area that attracts visitors looking for outdoor activities and events. Great for hosting families and groups during summer. | Playgrounds, Picnic areas, Community events, Sports fields, Outdoor concerts |
| Longwood | A quiet neighborhood on the outskirts that offers a serene escape. It attracts visitors looking for peace and nature, making it a great retreat. | Nature walks, Nearby hiking, Peaceful environment, Local wildlife, Scenic views |
| Como Arts District | Known for its local arts and crafts scene, it appeals to tourists interested in culture and creativity. Hosts can attract art lovers and cultural tourists. | Art galleries, Craft shops, Local artisans, Cultural events, Art festivals |
| Historic Como | A preserved area showcasing the historic architecture of Como which invites history buffs and tourists interested in cultural heritage. | Historic buildings, Museums, Cultural tours, Local history, Annual festivals |
| Como Food Scene | This vibrant area offers a variety of dining experiences from local diners to gourmet restaurants, making it a culinary hot spot for food enthusiasts. | Variety of restaurants, Food festivals, Culinary tours, Local wineries, Street food vendors |
Understanding Airbnb License Requirements & STR Laws in Como (2025)
While Como, Mississippi, United States currently shows low STR regulations, specific Airbnb license requirements might still exist or change. Always verify the latest short term rental regulations and Airbnb license requirements directly with local government authorities for Como to ensure full compliance before hosting.
(Source: AirROI data, 2025, finding no licensed listings among those analyzed)
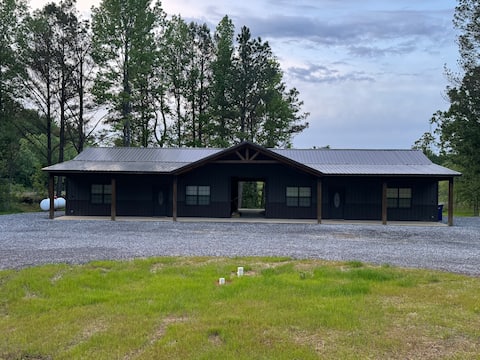
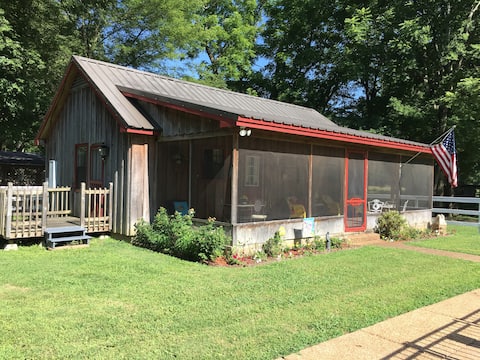
Top Performing Airbnb Properties in Como (2025)
Benchmark your potential! Explore examples of top-performing Airbnb properties in Comobased on Trailing Twelve Month (TTM) revenue. Analyze their characteristics, revenue, occupancy rate, and ADR to understand what drives success in this market.
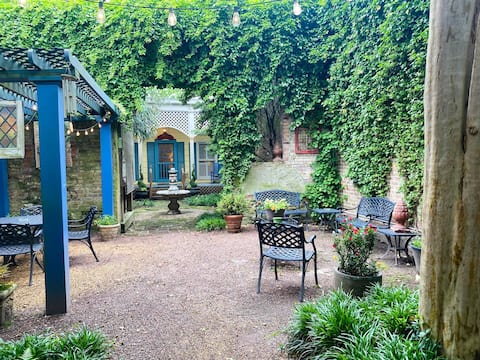
Boutique 2 Bedroom Home with Private Courtyard
Entire Place • 2 bedrooms
Cabin 1 near Sardis Lake/Oxford
Entire Place • 2 bedrooms
Heavens Trees: Small town Guest House
Entire Place • 2 bedrooms
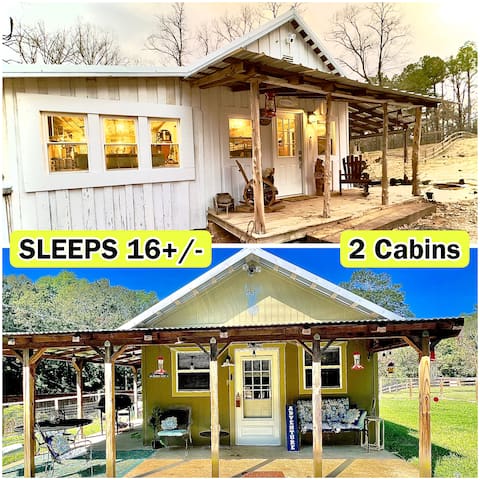
2 Cabins - Sardis Lake
Entire Place • N/A
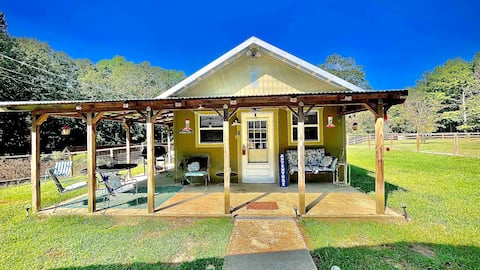
The Cottage at Moon Hollow Farm
Entire Place • 1 bedroom
Sardis Lake • Fast WI-FI • Studio Cabin
Entire Place • N/A
Note: Performance varies based on location, size, amenities, seasonality, and management quality. Data reflects the past 12 months.
Top Performing Airbnb Hosts in Como (2025)
Learn from the best! This table showcases top-performing Airbnb hosts in Como based on the number of properties managed and estimated total revenue over the past year. Analyze their scale and performance metrics.
| Host Name | Properties | Grossing Revenue | Stay Reviews | Avg Rating |
|---|---|---|---|---|
| Christopher And Christina | 3 | $53,457 | 85 | 4.80/5.0 |
| Crystal | 1 | $48,518 | 138 | 4.92/5.0 |
| Tyler | 2 | $46,436 | 26 | 4.96/5.0 |
| Morgan | 1 | $24,987 | 157 | 4.98/5.0 |
| Jan | 2 | $24,629 | 41 | 4.89/5.0 |
| Karen | 1 | $22,354 | 11 | 5.00/5.0 |
| Penny | 3 | $19,295 | 145 | 4.93/5.0 |
| Brenda | 1 | $18,783 | 17 | 5.00/5.0 |
| Krista | 2 | $18,373 | 102 | 4.58/5.0 |
| Darla | 1 | $7,900 | 7 | 4.43/5.0 |
Analyzing the strategies of top hosts, such as their property selection, pricing, and guest communication, can offer valuable lessons for optimizing your own Airbnb operations in Como.
Dive Deeper: Advanced Como STR Market Data (2025)
Ready to unlock more insights? AirROI provides access to advanced metrics and comprehensive Airbnb data for Como. Explore detailed analytics beyond this report to refine your investment strategy, optimize pricing, and maximize your vacation rental profits.
Explore Advanced MetricsComo Short-Term Rental Market Composition (2025): Property & Room Types
Room Type Distribution
Property Type Distribution
Market Composition Insights for Como
- The Como Airbnb market composition is heavily skewed towards Entire Home/Apt listings, which make up 89.5% of the 19 active rentals. This indicates strong guest preference for privacy and space.
- Looking at the property type distribution in Como, Outdoor/Unique properties are the most common (57.9%), reflecting the local real estate landscape.
- Houses represent a significant 36.8% portion, catering likely to families or larger groups.
- The presence of 5.3% Hotel/Boutique listings indicates integration with traditional hospitality.
Como Airbnb Room Capacity Analysis (2025): Bedroom Distribution
Distribution of Listings by Number of Bedrooms
Room Capacity Insights for Como
- The dominant room capacity in Como is 2 bedrooms listings, making up 36.8% of the market. This suggests a strong demand for properties suitable for couples or solo travelers.
- Together, 2 bedrooms and 3 bedrooms properties represent 57.9% of the active Airbnb listings in Como, indicating a high concentration in these sizes.
- A significant 26.4% of listings offer 3+ bedrooms, catering to larger groups and families seeking more space in Como.
Como Vacation Rental Guest Capacity Trends (2025)
Distribution of Listings by Guest Capacity
Guest Capacity Insights for Como
- The most common guest capacity trend in Como vacation rentals is listings accommodating 8+ guests (31.6%). This suggests the primary traveler segment is likely larger groups.
- Properties designed for 8+ guests and 6 guests dominate the Como STR market, accounting for 63.2% of listings.
- 63.2% of properties accommodate 6+ guests, serving the market segment for larger families or group travel in Como.
- On average, properties in Como are equipped to host 5.3 guests.
Como Airbnb Booking Patterns (2025): Available vs. Booked Days
Available Days Distribution
Booked Days Distribution
Booking Pattern Insights for Como
- The most common availability pattern in Como falls within the 271-366 days range, representing 63.2% of listings. This suggests many properties have significant open periods on their calendars.
- Approximately 94.8% of listings show high availability (181+ days open annually), indicating potential for increased bookings or specific owner usage patterns.
- For booked days, the 31-90 days range is most frequent in Como (42.1%), reflecting common guest stay durations or potential owner blocking patterns.
- A notable 5.3% of properties secure long booking periods (181+ days booked per year), highlighting successful long-term rental strategies or significant owner usage.
Como Airbnb Minimum Stay Requirements Analysis
Distribution of Listings by Minimum Night Requirement
1 Night
7 listings
36.8% of total
2 Nights
9 listings
47.4% of total
30+ Nights
3 listings
15.8% of total
Key Insights
- The most prevalent minimum stay requirement in Como is 2 Nights, adopted by 47.4% of listings. This highlights the market's preference for shorter, flexible bookings.
- A strong majority (84.2%) of the Como Airbnb data shows acceptance of very short stays (1-2 nights), indicating a dynamic, high-turnover market.
- A significant segment (15.8%) caters to monthly stays (30+ nights) in Como, pointing to opportunities in the extended-stay market.
Recommendations
- Align with the market by considering a 2 Nights minimum stay, as 47.4% of Como hosts use this setting.
- Explore offering discounts for stays of 30+ nights to attract the 15.8% of the market seeking extended stays.
- Adjust minimum nights based on seasonality – potentially shorter during low season and longer during peak demand periods in Como.
Como Airbnb Cancellation Policy Trends Analysis (2025)
Flexible
3 listings
15.8% of total
Moderate
1 listings
5.3% of total
Firm
11 listings
57.9% of total
Strict
4 listings
21.1% of total
Cancellation Policy Insights for Como
- The prevailing Airbnb cancellation policy trend in Como is Firm, used by 57.9% of listings.
- A majority (79.0%) of hosts in Como utilize Firm or Strict policies, indicating a market where hosts prioritize booking security.
Recommendations for Hosts
- Consider adopting a Firm policy to align with the 57.9% market standard in Como.
- Regularly review your cancellation policy against competitors and market demand shifts in Como.
Como STR Booking Lead Time Analysis (2025)
Average Booking Lead Time by Month
Booking Lead Time Insights for Como
- The overall average booking lead time for vacation rentals in Como is 40 days.
- Guests book furthest in advance for stays during May (average 77 days), likely coinciding with peak travel demand or local events.
- The shortest booking windows occur for stays in January (average 8 days), indicating more last-minute travel plans during this time.
- Seasonally, Spring (52 days avg.) sees the longest lead times, while Winter (26 days avg.) has the shortest, reflecting typical travel planning cycles.
Recommendations for Hosts
- Use the overall average lead time (40 days) as a baseline for your pricing and availability strategy in Como.
- For May stays, consider implementing length-of-stay discounts or slightly higher rates for bookings made less than 77 days out to capitalize on advance planning.
- During January, focus on last-minute booking availability and promotions, as guests book with very short notice (8 days avg.).
- Target marketing efforts for the Spring season well in advance (at least 52 days) to capture early planners.
- Monitor your own booking lead times against these Como averages to identify opportunities for dynamic pricing adjustments.
Popular & Essential Airbnb Amenities in Como (2025)
Amenity Prevalence
Amenity Insights for Como
- Essential amenities in Como that guests expect include: Smoke alarm, Air conditioning, Free parking on premises, Oven, Coffee maker, Dishes and silverware, Cooking basics. Lacking these (any) could significantly impact bookings.
- Popular amenities like Hot water, TV, Stove are common but not universal. Offering these can provide a competitive edge.
Recommendations for Hosts
- Ensure your listing includes all essential amenities for Como: Smoke alarm, Air conditioning, Free parking on premises, Oven, Coffee maker, Dishes and silverware, Cooking basics.
- Consider adding popular differentiators like Hot water or TV to increase appeal.
- Highlight unique or less common amenities you offer (e.g., hot tub, dedicated workspace, EV charger) in your listing description and photos.
- Regularly check competitor amenities in Como to stay competitive.
Como Airbnb Guest Demographics & Profile Analysis (2025)
Guest Profile Summary for Como
- The typical guest profile for Airbnb in Como consists of primarily domestic travelers (100%), often arriving from nearby Olive Branch, typically belonging to the Post-2000s (Gen Z/Alpha) group (50%), primarily speaking English or Spanish.
- Domestic travelers account for 100.0% of guests.
- Top languages spoken are English (87.5%) followed by Spanish (6.3%).
- A significant demographic segment is the Post-2000s (Gen Z/Alpha) group, representing 50% of guests.
Recommendations for Hosts
- Target domestic marketing efforts towards travelers from Olive Branch and Pensacola.
- Tailor amenities and listing descriptions to appeal to the dominant Post-2000s (Gen Z/Alpha) demographic (e.g., highlight fast WiFi, smart home features, local guides).
- Highlight unique local experiences or amenities relevant to the primary guest profile.
- Consider seasonal promotions aligned with peak travel times for key origin markets.
Nearby Short-Term Rental Market Comparison
How does the Como Airbnb market stack up against its neighbors? Compare key performance metrics like average monthly revenue, ADR, and occupancy rates in surrounding areas to understand the broader regional STR landscape.
| Market | Active Properties | Monthly Revenue | Daily Rate | Avg. Occupancy |
|---|---|---|---|---|
| Taylor | 12 | $3,303 | $734.39 | 25% |
| Oxford | 987 | $2,689 | $568.58 | 27% |
| Shelby County | 19 | $2,424 | $243.54 | 38% |
| Cleveland | 17 | $2,239 | $210.81 | 36% |
| Lakeland | 13 | $2,194 | $171.91 | 49% |
| Germantown | 10 | $2,070 | $209.27 | 39% |
| Henderson | 17 | $2,054 | $156.77 | 49% |
| Southaven | 70 | $2,051 | $230.31 | 41% |
| Starkville | 351 | $1,991 | $258.61 | 36% |
| Tupelo | 75 | $1,939 | $146.87 | 48% |