Watersmeet Township Airbnb Market Analysis 2026: Short Term Rental Data & Vacation Rental Statistics in Michigan, United States
Is Airbnb profitable in Watersmeet Township in 2026? Explore comprehensive Airbnb analytics for Watersmeet Township, Michigan, United States to uncover income potential. This 2026 STR market report for Watersmeet Township, based on AirROI data from February 2025 to January 2026, reveals key trends in the niche market of 19 active listings.
Whether you're considering an Airbnb investment in Watersmeet Township, optimizing your existing vacation rental, or exploring rental arbitrage opportunities, understanding the Watersmeet Township Airbnb data is crucial. Leveraging the low regulation environment is key to maximizing your short term rental income potential. Let's dive into the specifics.
Key Watersmeet Township Airbnb Performance Metrics Overview
Monthly Airbnb Revenue Variations & Income Potential in Watersmeet Township (2026)
Understanding the monthly revenue variations for Airbnb listings in Watersmeet Township is key to maximizing your short term rental income potential. Seasonality significantly impacts earnings. Our analysis, based on data from the past 12 months, shows that the peak revenue month for STRs in Watersmeet Township is typically July, while March often presents the lowest earnings, highlighting opportunities for strategic pricing adjustments during shoulder and low seasons. Explore the typical Airbnb income in Watersmeet Township across different performance tiers:
- Best-in-class properties (Top 10%) achieve $4,488+ monthly, often utilizing dynamic pricing and superior guest experiences.
- Strong performing properties (Top 25%) earn $3,069 or more, indicating effective management and desirable locations/amenities.
- Typical properties (Median) generate around $1,845 per month, representing the average market performance.
- Entry-level properties (Bottom 25%) see earnings around $1,137, often with potential for optimization.
Average Monthly Airbnb Earnings Trend in Watersmeet Township
Watersmeet Township Airbnb Occupancy Rate Trends (2026)
Maximize your bookings by understanding the Watersmeet Township STR occupancy trends. Seasonal demand shifts significantly influence how often properties are booked. Typically, Julysees the highest demand (peak season occupancy), while March experiences the lowest (low season). Effective strategies, like adjusting minimum stays or offering promotions, can boost occupancy during slower periods. Here's how different property tiers perform in Watersmeet Township:
- Best-in-class properties (Top 10%) achieve 48%+ occupancy, indicating high desirability and potentially optimized availability.
- Strong performing properties (Top 25%) maintain 37% or higher occupancy, suggesting good market fit and guest satisfaction.
- Typical properties (Median) have an occupancy rate around 21%.
- Entry-level properties (Bottom 25%) average 15% occupancy, potentially facing higher vacancy.
Average Monthly Occupancy Rate Trend in Watersmeet Township
Average Daily Rate (ADR) Airbnb Trends in Watersmeet Township (2026)
Effective short term rental pricing strategy in Watersmeet Township involves understanding monthly ADR fluctuations. The Average Daily Rate (ADR) for Airbnb in Watersmeet Township typically peaks in January and dips lowest during April. Leveraging Airbnb dynamic pricing tools or strategies based on this seasonality can significantly boost revenue. Here's a look at the typical nightly rates achieved:
- Best-in-class properties (Top 10%) command rates of $428+ per night, often due to premium features or locations.
- Strong performing properties (Top 25%) achieve nightly rates of $348 or more.
- Typical properties (Median) charge around $252 per night.
- Entry-level properties (Bottom 25%) earn around $205 per night.
Average Daily Rate (ADR) Trend by Month in Watersmeet Township
Get Live Watersmeet Township Market Intelligence 👇

Explore Real-time Analytics
Airbnb Seasonality Analysis & Trends in Watersmeet Township (2026)
Peak Season (July, August, April)
- Revenue averages $3,707 per month
- Occupancy rates average 42.8%
- Daily rates average $277
Shoulder Season
- Revenue averages $1,983 per month
- Occupancy maintains around 22.9%
- Daily rates hold near $295
Low Season (March, May, October)
- Revenue drops to average $1,296 per month
- Occupancy decreases to average 16.0%
- Daily rates adjust to average $282
Seasonality Insights for Watersmeet Township
- The Airbnb seasonality in Watersmeet Township shows highly seasonal trends requiring careful strategy. While the sections above show seasonal averages, it's also insightful to look at the extremes:
- During the high season, the absolute peak month showcases Watersmeet Township's highest earning potential, with monthly revenues capable of climbing to $4,820, occupancy reaching a high of 53.5%, and ADRs peaking at $321.
- Conversely, the slowest single month of the year, typically falling within the low season, marks the market's lowest point. In this month, revenue might dip to $795, occupancy could drop to 12.0%, and ADRs may adjust down to $260.
- Understanding both the seasonal averages and these monthly peaks and troughs in revenue, occupancy, and ADR is crucial for maximizing your Airbnb profit potential in Watersmeet Township.
Seasonal Strategies for Maximizing Profit
- Peak Season: Maximize revenue through premium pricing and potentially longer minimum stays. Ensure high availability.
- Low Season: Offer competitive pricing, special promotions (e.g., extended stay discounts), and flexible cancellation policies. Target off-season travelers like remote workers or budget-conscious guests.
- Shoulder Seasons: Implement dynamic pricing that balances peak and low rates. Target weekend travelers or specific events. Offer slightly more flexible terms than peak season.
- Regularly analyze your own performance against these Watersmeet Township seasonality benchmarks and adjust your pricing and availability strategy accordingly.
Best Areas for Airbnb Investment in Watersmeet Township (2026)
Exploring the top neighborhoods for short-term rentals in Watersmeet Township? This section highlights key areas, outlining why they are attractive for hosts and guests, along with notable local attractions. Consider these locations based on your target guest profile and investment strategy.
| Neighborhood / Area | Why Host Here? (Target Guests & Appeal) | Key Attractions & Landmarks |
|---|---|---|
| Watersmeet Lake | A serene location ideal for nature lovers and those looking for a peaceful retreat. The lake offers outdoor activities such as fishing and boating, attracting families and visitors seeking tranquility. | Watersmeet Lake, Fishing and boating, Scenic nature trails, Wildlife watching, Picnic areas |
| Ottawa National Forest | A pristine natural area offering vast wilderness and recreational opportunities. Perfect for hiking, camping, and enjoying the outdoors, appealing to adventure seekers and nature enthusiasts. | Hiking trails, Camping sites, Wildlife habitats, Scenic viewpoints, Fishing spots |
| Snowy Mountain | A popular spot for winter sports and outdoor activities. This area attracts tourists during the ski season and outdoor enthusiasts year-round, making it a strong investment for vacation rentals. | Skiing and snowboarding, Snowshoeing, Ice fishing, Winter hiking, Scenic views |
| Sandy Point | A lovely area for beachgoers and summer vacationers, offering sandy beaches and swimming opportunities. Ideal for families and groups looking for summer fun. | Sandy beaches, Swimming areas, Picnic spots, Sunset views, Water sports |
| Historic Watersmeet Town Center | The charming town center features local shops and eateries that cater to visitors and locals alike, making it a convenient base for tourists exploring the region. | Local shops, Restaurants, Cultural events, Art galleries, Community parks |
| Mason Lake | A beautiful spot for relaxation and leisure activities. The clear waters and scenic landscapes attract those looking for a quiet getaway, ideal for weekend rentals. | Mason Lake, Fishing and swimming, Kayaking, Nature trails, Camping areas |
| Lakeside Trails | Great for hiking and biking enthusiasts, offering scenic trails along the lakeside. This area appeals to outdoor lovers and those looking for physical activity during their stay. | Hiking and biking trails, Lakeside views, Wildlife observation, Picnic areas, Scenic overlooks |
| Copper Falls State Park | A stunning natural park featuring waterfalls and scenic viewpoints. Popular among tourists seeking stunning natural beauty and outdoor activities, ideal for eco-tourism. | Copper Falls, Hiking trails, Waterfalls, Nature observation, Visitor center |
Understanding Airbnb License Requirements & STR Laws in Watersmeet Township (2026)
While Watersmeet Township, Michigan, United States currently shows low STR regulations, specific Airbnb license requirements might still exist or change. Always verify the latest short term rental regulations and Airbnb license requirements directly with local government authorities for Watersmeet Township to ensure full compliance before hosting.
(Source: AirROI data, 2026, finding no licensed listings among those analyzed)
Top Performing Airbnb Properties in Watersmeet Township (2026)
Benchmark your potential! Explore examples of top-performing Airbnb properties in Watersmeet Townshipbased on Trailing Twelve Month (TTM) revenue. Analyze their characteristics, revenue, occupancy rate, and ADR to understand what drives success in this market.
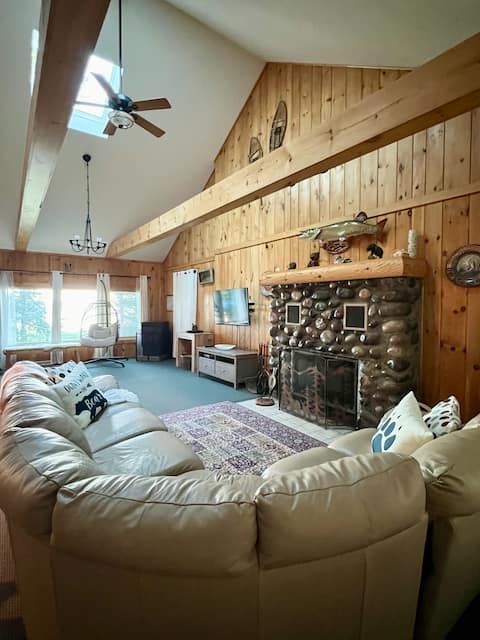
Northwoods Lakeside Retreat on Lac Vieux Desert
Entire Place • 4 bedrooms
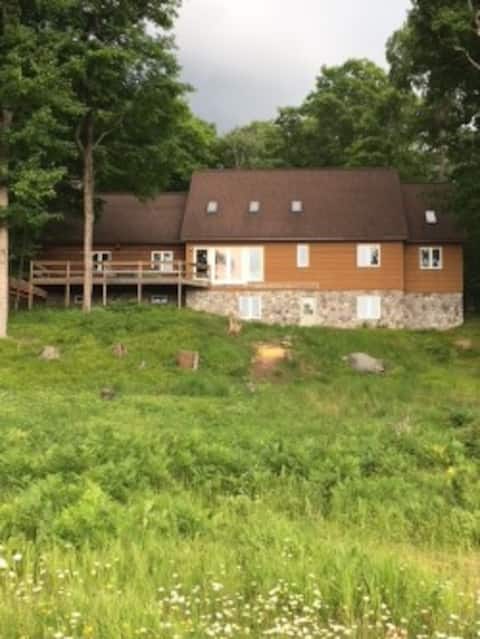
Meadow Vieux
Entire Place • 4 bedrooms

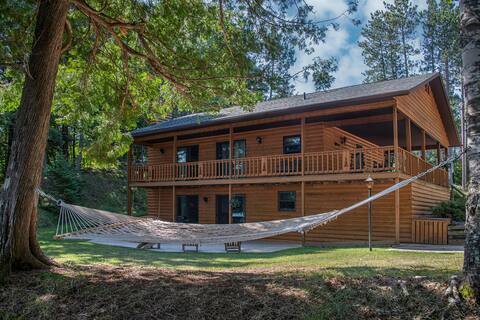
Hideaway at Grace Lake
Entire Place • 5 bedrooms
Cabin 7 on Cisco Chain of Lakes
Entire Place • 2 bedrooms

Birch Haven: Welcome snowmobile/ice fishing folks!
Entire Place • 3 bedrooms

Peaceful 3 bedroom cabin on UTV/snowmobile trails
Entire Place • 3 bedrooms
Note: Performance varies based on location, size, amenities, seasonality, and management quality. Data reflects the past 12 months.
Top Performing Airbnb Hosts in Watersmeet Township (2026)
Learn from the best! This table showcases top-performing Airbnb hosts in Watersmeet Township based on the number of properties managed and estimated total revenue over the past year. Analyze their scale and performance metrics.
| Host Name | Properties | Grossing Revenue | Stay Reviews | Avg Rating |
|---|---|---|---|---|
| Hiller Vacation Homes | 7 | $54,086 | 21 | 4.47/5.0 |
| Jacob | 4 | $50,696 | 5 | Not Rated |
| Michael | 1 | $40,590 | 12 | 5.00/5.0 |
| Brent | 1 | $31,878 | 16 | 4.94/5.0 |
| Michelle | 1 | $31,446 | 4 | 5.00/5.0 |
| Debbie | 2 | $30,964 | 72 | 5.00/5.0 |
| Dana | 1 | $24,820 | 66 | 4.76/5.0 |
| Tony | 1 | $22,442 | 107 | 4.97/5.0 |
| Evolve | 1 | $777 | 4 | 5.00/5.0 |
Analyzing the strategies of top hosts, such as their property selection, pricing, and guest communication, can offer valuable lessons for optimizing your own Airbnb operations in Watersmeet Township.
Dive Deeper: Advanced Watersmeet Township STR Market Data (2026)
Ready to unlock more insights? AirROI provides access to advanced metrics and comprehensive Airbnb data for Watersmeet Township. Explore detailed analytics beyond this report to refine your investment strategy, optimize pricing, and maximize your vacation rental profits.
Explore Advanced MetricsWatersmeet Township Short-Term Rental Market Composition (2026): Property & Room Types
Room Type Distribution
Property Type Distribution
Market Composition Insights for Watersmeet Township
- The Watersmeet Township Airbnb market composition is heavily skewed towards Entire Home/Apt listings, which make up 89.5% of the 19 active rentals. This indicates strong guest preference for privacy and space.
- Looking at the property type distribution in Watersmeet Township, Outdoor/Unique properties are the most common (73.7%), reflecting the local real estate landscape.
- The presence of 10.5% Hotel/Boutique listings indicates integration with traditional hospitality.
Watersmeet Township Airbnb Room Capacity Analysis (2026): Bedroom Distribution
Distribution of Listings by Number of Bedrooms
Room Capacity Insights for Watersmeet Township
- The dominant room capacity in Watersmeet Township is 2 bedrooms listings, making up 36.8% of the market. This suggests a strong demand for properties suitable for couples or solo travelers.
- Together, 2 bedrooms and 3 bedrooms properties represent 57.9% of the active Airbnb listings in Watersmeet Township, indicating a high concentration in these sizes.
- A significant 47.4% of listings offer 3+ bedrooms, catering to larger groups and families seeking more space in Watersmeet Township.
Watersmeet Township Vacation Rental Guest Capacity Trends (2026)
Distribution of Listings by Guest Capacity
Guest Capacity Insights for Watersmeet Township
- The most common guest capacity trend in Watersmeet Township vacation rentals is listings accommodating 8+ guests (63.2%). This suggests the primary traveler segment is likely larger groups.
- Properties designed for 8+ guests and 6 guests dominate the Watersmeet Township STR market, accounting for 79.0% of listings.
- 79.0% of properties accommodate 6+ guests, serving the market segment for larger families or group travel in Watersmeet Township.
- On average, properties in Watersmeet Township are equipped to host 6.3 guests.
Watersmeet Township Airbnb Booking Patterns (2026): Available vs. Booked Days
Available Days Distribution
Booked Days Distribution
Booking Pattern Insights for Watersmeet Township
- The most common availability pattern in Watersmeet Township falls within the 271-366 days range, representing 78.9% of listings. This suggests many properties have significant open periods on their calendars.
- Approximately 100.0% of listings show high availability (181+ days open annually), indicating potential for increased bookings or specific owner usage patterns.
- For booked days, the 31-90 days range is most frequent in Watersmeet Township (42.1%), reflecting common guest stay durations or potential owner blocking patterns.
Watersmeet Township Airbnb Minimum Stay Requirements Analysis
Distribution of Listings by Minimum Night Requirement
1 Night
5 listings
26.3% of total
2 Nights
7 listings
36.8% of total
3 Nights
2 listings
10.5% of total
4-6 Nights
1 listings
5.3% of total
7-29 Nights
1 listings
5.3% of total
30+ Nights
3 listings
15.8% of total
Key Insights
- The most prevalent minimum stay requirement in Watersmeet Township is 2 Nights, adopted by 36.8% of listings. This highlights the market's preference for shorter, flexible bookings.
- A strong majority (63.1%) of the Watersmeet Township Airbnb data shows acceptance of very short stays (1-2 nights), indicating a dynamic, high-turnover market.
- A significant segment (15.8%) caters to monthly stays (30+ nights) in Watersmeet Township, pointing to opportunities in the extended-stay market.
Recommendations
- Align with the market by considering a 2 Nights minimum stay, as 36.8% of Watersmeet Township hosts use this setting.
- If feasible, allowing 1-night stays, especially midweek or during low season, could capture last-minute bookings, as only 26.3% currently do.
- Explore offering discounts for stays of 30+ nights to attract the 15.8% of the market seeking extended stays.
- Adjust minimum nights based on seasonality – potentially shorter during low season and longer during peak demand periods in Watersmeet Township.
Watersmeet Township Airbnb Cancellation Policy Trends Analysis (2026)
Super Strict 30 Days
11 listings
57.9% of total
Flexible
2 listings
10.5% of total
Moderate
3 listings
15.8% of total
Firm
1 listings
5.3% of total
Strict
2 listings
10.5% of total
Cancellation Policy Insights for Watersmeet Township
- The prevailing Airbnb cancellation policy trend in Watersmeet Township is Super Strict 30 Days, used by 57.9% of listings.
- There's a relatively balanced mix between guest-friendly (26.3%) and stricter (15.8%) policies, offering choices for different guest needs.
Recommendations for Hosts
- Consider adopting a Super Strict 30 Days policy to align with the 57.9% market standard in Watersmeet Township.
- Using a Strict policy might deter some guests, as only 10.5% of listings use it. Evaluate if potential revenue protection outweighs possible lower booking rates.
- Regularly review your cancellation policy against competitors and market demand shifts in Watersmeet Township.
Watersmeet Township STR Booking Lead Time Analysis (2026)
Average Booking Lead Time by Month
Booking Lead Time Insights for Watersmeet Township
- The overall average booking lead time for vacation rentals in Watersmeet Township is 99 days.
- Guests book furthest in advance for stays during May (average 157 days), likely coinciding with peak travel demand or local events.
- The shortest booking windows occur for stays in April (average 38 days), indicating more last-minute travel plans during this time.
- Seasonally, Spring (93 days avg.) sees the longest lead times, while Fall (74 days avg.) has the shortest, reflecting typical travel planning cycles.
Recommendations for Hosts
- Use the overall average lead time (99 days) as a baseline for your pricing and availability strategy in Watersmeet Township.
- For May stays, consider implementing length-of-stay discounts or slightly higher rates for bookings made less than 157 days out to capitalize on advance planning.
- Target marketing efforts for the Spring season well in advance (at least 93 days) to capture early planners.
- Monitor your own booking lead times against these Watersmeet Township averages to identify opportunities for dynamic pricing adjustments.
Popular & Essential Airbnb Amenities in Watersmeet Township (2026)
Amenity Prevalence
Amenity Insights for Watersmeet Township
- Essential amenities in Watersmeet Township that guests expect include: Fire extinguisher. Lacking these (this) could significantly impact bookings.
- Popular amenities like Smoke alarm, Waterfront, Carbon monoxide alarm are common but not universal. Offering these can provide a competitive edge.
- Warning: Wifi is not universally provided but is considered essential globally. Ensure reliable Wifi is offered.
Recommendations for Hosts
- Ensure your listing includes all essential amenities for Watersmeet Township: Fire extinguisher.
- Consider adding popular differentiators like Smoke alarm or Waterfront to increase appeal.
- Highlight unique or less common amenities you offer (e.g., hot tub, dedicated workspace, EV charger) in your listing description and photos.
- Regularly check competitor amenities in Watersmeet Township to stay competitive.
Watersmeet Township Airbnb Guest Demographics & Profile Analysis (2026)
Guest Profile Summary for Watersmeet Township
- The typical guest profile for Airbnb in Watersmeet Township consists of primarily domestic travelers (97%), often arriving from nearby Appleton, typically belonging to the Post-2000s (Gen Z/Alpha) group (50%), primarily speaking English or French.
- Domestic travelers account for 97.1% of guests.
- Key international markets include United States (97.1%) and Mongolia (2.9%).
- Top languages spoken are English (92.3%) followed by French (7.7%).
- A significant demographic segment is the Post-2000s (Gen Z/Alpha) group, representing 50% of guests.
Recommendations for Hosts
- Target domestic marketing efforts towards travelers from Appleton and Chicago.
- Tailor amenities and listing descriptions to appeal to the dominant Post-2000s (Gen Z/Alpha) demographic (e.g., highlight fast WiFi, smart home features, local guides).
- Highlight unique local experiences or amenities relevant to the primary guest profile.
- Consider seasonal promotions aligned with peak travel times for key origin markets.
Nearby Short-Term Rental Market Comparison
How does the Watersmeet Township Airbnb market stack up against its neighbors? Compare key performance metrics like average monthly revenue, ADR, and occupancy rates in surrounding areas to understand the broader regional STR landscape.
| Market | Active Properties | Monthly Revenue | Daily Rate | Avg. Occupancy |
|---|---|---|---|---|
| Schroeder Township | 10 | $5,197 | $395.87 | 43% |
| Schroeder | 10 | $5,094 | $482.67 | 46% |
| Lutsen | 22 | $4,676 | $433.38 | 41% |
| Tofte Township | 44 | $4,639 | $307.90 | 48% |
| West Cook | 125 | $4,350 | $360.91 | 47% |
| Lutsen Township | 174 | $4,232 | $437.03 | 37% |
| Allouez Township | 17 | $4,163 | $348.24 | 44% |
| Grand Marais | 73 | $3,751 | $295.88 | 50% |
| Town of Scott | 23 | $3,548 | $326.26 | 39% |
| Republic Township | 17 | $3,315 | $302.69 | 43% |