Troy Airbnb Market Analysis 2026: Short Term Rental Data & Vacation Rental Statistics in Michigan, United States
Is Airbnb profitable in Troy in 2026? Explore comprehensive Airbnb analytics for Troy, Michigan, United States to uncover income potential. This 2026 STR market report for Troy, based on AirROI data from February 2025 to January 2026, reveals key trends in the niche market of 33 active listings.
Whether you're considering an Airbnb investment in Troy, optimizing your existing vacation rental, or exploring rental arbitrage opportunities, understanding the Troy Airbnb data is crucial. Leveraging the low regulation environment is key to maximizing your short term rental income potential. Let's dive into the specifics.
Key Troy Airbnb Performance Metrics Overview
Monthly Airbnb Revenue Variations & Income Potential in Troy (2026)
Understanding the monthly revenue variations for Airbnb listings in Troy is key to maximizing your short term rental income potential. Seasonality significantly impacts earnings. Our analysis, based on data from the past 12 months, shows that the peak revenue month for STRs in Troy is typically July, while February often presents the lowest earnings, highlighting opportunities for strategic pricing adjustments during shoulder and low seasons. Explore the typical Airbnb income in Troy across different performance tiers:
- Best-in-class properties (Top 10%) achieve $6,313+ monthly, often utilizing dynamic pricing and superior guest experiences.
- Strong performing properties (Top 25%) earn $4,655 or more, indicating effective management and desirable locations/amenities.
- Typical properties (Median) generate around $2,550 per month, representing the average market performance.
- Entry-level properties (Bottom 25%) see earnings around $1,164, often with potential for optimization.
Average Monthly Airbnb Earnings Trend in Troy
Troy Airbnb Occupancy Rate Trends (2026)
Maximize your bookings by understanding the Troy STR occupancy trends. Seasonal demand shifts significantly influence how often properties are booked. Typically, Aprilsees the highest demand (peak season occupancy), while June experiences the lowest (low season). Effective strategies, like adjusting minimum stays or offering promotions, can boost occupancy during slower periods. Here's how different property tiers perform in Troy:
- Best-in-class properties (Top 10%) achieve 82%+ occupancy, indicating high desirability and potentially optimized availability.
- Strong performing properties (Top 25%) maintain 67% or higher occupancy, suggesting good market fit and guest satisfaction.
- Typical properties (Median) have an occupancy rate around 46%.
- Entry-level properties (Bottom 25%) average 20% occupancy, potentially facing higher vacancy.
Average Monthly Occupancy Rate Trend in Troy
Average Daily Rate (ADR) Airbnb Trends in Troy (2026)
Effective short term rental pricing strategy in Troy involves understanding monthly ADR fluctuations. The Average Daily Rate (ADR) for Airbnb in Troy typically peaks in July and dips lowest during February. Leveraging Airbnb dynamic pricing tools or strategies based on this seasonality can significantly boost revenue. Here's a look at the typical nightly rates achieved:
- Best-in-class properties (Top 10%) command rates of $361+ per night, often due to premium features or locations.
- Strong performing properties (Top 25%) achieve nightly rates of $253 or more.
- Typical properties (Median) charge around $155 per night.
- Entry-level properties (Bottom 25%) earn around $67 per night.
Average Daily Rate (ADR) Trend by Month in Troy
Get Live Troy Market Intelligence 👇

Explore Real-time Analytics
Airbnb Seasonality Analysis & Trends in Troy (2026)
Peak Season (July, May, August)
- Revenue averages $3,789 per month
- Occupancy rates average 51.3%
- Daily rates average $192
Shoulder Season
- Revenue averages $3,202 per month
- Occupancy maintains around 48.7%
- Daily rates hold near $179
Low Season (January, February, June)
- Revenue drops to average $2,264 per month
- Occupancy decreases to average 34.8%
- Daily rates adjust to average $175
Seasonality Insights for Troy
- The Airbnb seasonality in Troy shows moderate seasonality with distinct peak and low periods. While the sections above show seasonal averages, it's also insightful to look at the extremes:
- During the high season, the absolute peak month showcases Troy's highest earning potential, with monthly revenues capable of climbing to $4,206, occupancy reaching a high of 58.1%, and ADRs peaking at $199.
- Conversely, the slowest single month of the year, typically falling within the low season, marks the market's lowest point. In this month, revenue might dip to $2,051, occupancy could drop to 28.9%, and ADRs may adjust down to $161.
- Understanding both the seasonal averages and these monthly peaks and troughs in revenue, occupancy, and ADR is crucial for maximizing your Airbnb profit potential in Troy.
Seasonal Strategies for Maximizing Profit
- Peak Season: Maximize revenue through premium pricing and potentially longer minimum stays. Ensure high availability.
- Low Season: Offer competitive pricing, special promotions (e.g., extended stay discounts), and flexible cancellation policies. Target off-season travelers like remote workers or budget-conscious guests.
- Shoulder Seasons: Implement dynamic pricing that balances peak and low rates. Target weekend travelers or specific events. Offer slightly more flexible terms than peak season.
- Regularly analyze your own performance against these Troy seasonality benchmarks and adjust your pricing and availability strategy accordingly.
Best Areas for Airbnb Investment in Troy (2026)
Exploring the top neighborhoods for short-term rentals in Troy? This section highlights key areas, outlining why they are attractive for hosts and guests, along with notable local attractions. Consider these locations based on your target guest profile and investment strategy.
| Neighborhood / Area | Why Host Here? (Target Guests & Appeal) | Key Attractions & Landmarks |
|---|---|---|
| Downtown Troy | The heart of Troy with bustling shops, restaurants, and easy access to businesses. Ideal for travelers looking for convenience and urban amenities. | Troy Historic Village, Somerset Collection, Troy Public Library, Troy Community Center |
| Troy Historic Village | A charming area showcasing Troy's rich history with historical buildings and unique shops. Great for tourists looking for local culture and history. | Troy Historic Village Museum, Little Woodward Lake, Troy Farmers Market |
| Somerset Collection | A premier shopping mall featuring high-end retailers and fine dining options. Attracts shoppers and visitors interested in luxury shopping experiences. | Somerset Collection shopping mall, fine dining restaurants, art installations |
| Ted Bates Park | A spacious park offering recreational activities and events. Ideal for families and outdoor enthusiasts looking for green spaces. | Ted Bates Park, picnic areas, walking trails, community events |
| Boulevard Plaza | A plaza featuring a mix of retail shops and dining options. Appeals to shoppers and those looking for nightlife in Troy. | restaurants and cafes, shopping outlets, outdoor seating areas |
| Troy Nature Center | A natural retreat in the city, perfect for those who enjoy outdoor activities and exploring nature. Great for eco-conscious travelers. | nature trails, wildlife observation, educational programs |
| Big Beaver Road | A major thoroughfare in Troy known for its restaurants and office parks. Attracts business travelers and food enthusiasts. | restaurants, business offices, nearby hotels |
| Lakeside Mall | Another popular shopping destination in Troy with a variety of stores and entertainment options. Ideal for family visitors and shoppers alike. | Lakeside Mall, cinema, restaurants |
Understanding Airbnb License Requirements & STR Laws in Troy (2026)
While Troy, Michigan, United States currently shows low STR regulations, specific Airbnb license requirements might still exist or change. Always verify the latest short term rental regulations and Airbnb license requirements directly with local government authorities for Troy to ensure full compliance before hosting.
(Source: AirROI data, 2026, finding no licensed listings among those analyzed)
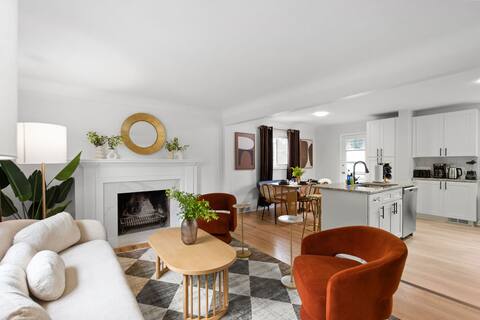
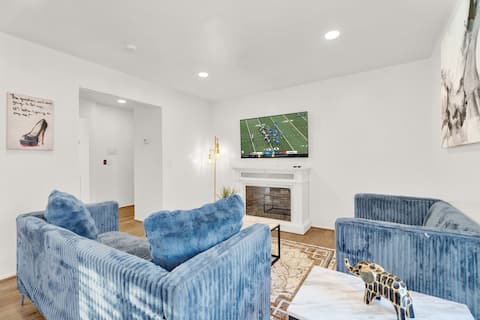
Top Performing Airbnb Properties in Troy (2026)
Benchmark your potential! Explore examples of top-performing Airbnb properties in Troybased on Trailing Twelve Month (TTM) revenue. Analyze their characteristics, revenue, occupancy rate, and ADR to understand what drives success in this market.

Newly Renovated 4 BD/3 BA Birmingham Home Hot Tub
Entire Place • 4 bedrooms
Gorgeous! *Hot Tub* 4 BD/2 BA Birmingham Home
Entire Place • 4 bedrooms

Aesthetic ranch style home with modern furnishings
Entire Place • 3 bedrooms

Somerset Escape 5BR/2.5BA
Entire Place • 5 bedrooms
Vamp Balcony Retreat for 5 | Downtown Bham
Entire Place • 2 bedrooms

Luxury 3BR Near Downtown & Golf | Sleeps 8
Entire Place • 3 bedrooms
Note: Performance varies based on location, size, amenities, seasonality, and management quality. Data reflects the past 12 months.
Top Performing Airbnb Hosts in Troy (2026)
Learn from the best! This table showcases top-performing Airbnb hosts in Troy based on the number of properties managed and estimated total revenue over the past year. Analyze their scale and performance metrics.
| Host Name | Properties | Grossing Revenue | Stay Reviews | Avg Rating |
|---|---|---|---|---|
| Samantha | 3 | $172,159 | 101 | 4.88/5.0 |
| Jesse | 4 | $108,116 | 63 | 4.39/5.0 |
| Alex | 1 | $70,475 | 161 | 4.93/5.0 |
| KeKe | 1 | $51,508 | 149 | 4.79/5.0 |
| Fadi | 1 | $48,327 | 54 | 4.67/5.0 |
| Sam | 1 | $47,644 | 25 | 4.76/5.0 |
| Ryan | 1 | $41,784 | 48 | 4.90/5.0 |
| Maggie | 1 | $31,913 | 56 | 4.77/5.0 |
| Christine | 1 | $30,307 | 78 | 4.96/5.0 |
| StayArbor Hospitality | 2 | $23,385 | 6 | 5.00/5.0 |
Analyzing the strategies of top hosts, such as their property selection, pricing, and guest communication, can offer valuable lessons for optimizing your own Airbnb operations in Troy.
Dive Deeper: Advanced Troy STR Market Data (2026)
Ready to unlock more insights? AirROI provides access to advanced metrics and comprehensive Airbnb data for Troy. Explore detailed analytics beyond this report to refine your investment strategy, optimize pricing, and maximize your vacation rental profits.
Explore Advanced MetricsTroy Short-Term Rental Market Composition (2026): Property & Room Types
Room Type Distribution
Property Type Distribution
Market Composition Insights for Troy
- The Troy Airbnb market composition is heavily skewed towards Entire Home/Apt listings, which make up 66.7% of the 33 active rentals. This indicates strong guest preference for privacy and space.
- However, a notable 33.3% share for Private Rooms suggests opportunities for budget-conscious travelers or hosts renting out spare rooms.
- Looking at the property type distribution in Troy, House properties are the most common (81.8%), reflecting the local real estate landscape.
- Houses represent a significant 81.8% portion, catering likely to families or larger groups.
- The presence of 6.1% Hotel/Boutique listings indicates integration with traditional hospitality.
Troy Airbnb Room Capacity Analysis (2026): Bedroom Distribution
Distribution of Listings by Number of Bedrooms
Room Capacity Insights for Troy
- The dominant room capacity in Troy is 2 bedrooms listings, making up 24.2% of the market. This suggests a strong demand for properties suitable for couples or solo travelers.
- Together, 2 bedrooms and 4 bedrooms properties represent 45.4% of the active Airbnb listings in Troy, indicating a high concentration in these sizes.
- A significant 45.4% of listings offer 3+ bedrooms, catering to larger groups and families seeking more space in Troy.
Troy Vacation Rental Guest Capacity Trends (2026)
Distribution of Listings by Guest Capacity
Guest Capacity Insights for Troy
- The most common guest capacity trend in Troy vacation rentals is listings accommodating 8+ guests (33.3%). This suggests the primary traveler segment is likely larger groups.
- Properties designed for 8+ guests and 4 guests dominate the Troy STR market, accounting for 45.4% of listings.
- 45.4% of properties accommodate 6+ guests, serving the market segment for larger families or group travel in Troy.
- On average, properties in Troy are equipped to host 4.4 guests.
Troy Airbnb Booking Patterns (2026): Available vs. Booked Days
Available Days Distribution
Booked Days Distribution
Booking Pattern Insights for Troy
- The most common availability pattern in Troy falls within the 271-366 days range, representing 57.6% of listings. This suggests many properties have significant open periods on their calendars.
- Approximately 72.8% of listings show high availability (181+ days open annually), indicating potential for increased bookings or specific owner usage patterns.
- For booked days, the 1-30 days range is most frequent in Troy (30.3%), reflecting common guest stay durations or potential owner blocking patterns.
- A notable 27.3% of properties secure long booking periods (181+ days booked per year), highlighting successful long-term rental strategies or significant owner usage.
Troy Airbnb Minimum Stay Requirements Analysis
Distribution of Listings by Minimum Night Requirement
1 Night
5 listings
15.2% of total
2 Nights
3 listings
9.1% of total
3 Nights
2 listings
6.1% of total
4-6 Nights
4 listings
12.1% of total
7-29 Nights
9 listings
27.3% of total
30+ Nights
10 listings
30.3% of total
Key Insights
- The most prevalent minimum stay requirement in Troy is 30+ Nights, adopted by 30.3% of listings. This highlights the market's preference for longer commitments.
- A significant segment (30.3%) caters to monthly stays (30+ nights) in Troy, pointing to opportunities in the extended-stay market.
Recommendations
- Align with the market by considering a 30+ Nights minimum stay, as 30.3% of Troy hosts use this setting.
- If feasible, allowing 1-night stays, especially midweek or during low season, could capture last-minute bookings, as only 15.2% currently do.
- Explore offering discounts for stays of 30+ nights to attract the 30.3% of the market seeking extended stays.
- Adjust minimum nights based on seasonality – potentially shorter during low season and longer during peak demand periods in Troy.
Troy Airbnb Cancellation Policy Trends Analysis (2026)
Limited
1 listings
3% of total
Super Strict 30 Days
3 listings
9.1% of total
Flexible
9 listings
27.3% of total
Moderate
6 listings
18.2% of total
Firm
9 listings
27.3% of total
Strict
5 listings
15.2% of total
Cancellation Policy Insights for Troy
- The prevailing Airbnb cancellation policy trend in Troy is Flexible, used by 27.3% of listings.
- There's a relatively balanced mix between guest-friendly (45.5%) and stricter (42.5%) policies, offering choices for different guest needs.
Recommendations for Hosts
- Consider adopting a Flexible policy to align with the 27.3% market standard in Troy.
- Regularly review your cancellation policy against competitors and market demand shifts in Troy.
Troy STR Booking Lead Time Analysis (2026)
Average Booking Lead Time by Month
Booking Lead Time Insights for Troy
- The overall average booking lead time for vacation rentals in Troy is 25 days.
- Guests book furthest in advance for stays during June (average 161 days), likely coinciding with peak travel demand or local events.
- The shortest booking windows occur for stays in March (average 20 days), indicating more last-minute travel plans during this time.
- Seasonally, Summer (75 days avg.) sees the longest lead times, while Winter (25 days avg.) has the shortest, reflecting typical travel planning cycles.
Recommendations for Hosts
- Use the overall average lead time (25 days) as a baseline for your pricing and availability strategy in Troy.
- For June stays, consider implementing length-of-stay discounts or slightly higher rates for bookings made less than 161 days out to capitalize on advance planning.
- Target marketing efforts for the Summer season well in advance (at least 75 days) to capture early planners.
- Monitor your own booking lead times against these Troy averages to identify opportunities for dynamic pricing adjustments.
Popular & Essential Airbnb Amenities in Troy (2026)
Amenity Prevalence
Amenity Insights for Troy
- Essential amenities in Troy that guests expect include: Free parking on premises, Heating, Wifi, Smoke alarm, Kitchen, Air conditioning, Refrigerator, TV, Washer, Carbon monoxide alarm. Lacking these (any) could significantly impact bookings.
Recommendations for Hosts
- Ensure your listing includes all essential amenities for Troy: Free parking on premises, Heating, Wifi, Smoke alarm, Kitchen, Air conditioning, Refrigerator, TV, Washer, Carbon monoxide alarm.
- Prioritize adding missing essentials: Refrigerator, TV, Washer, Carbon monoxide alarm.
- Highlight unique or less common amenities you offer (e.g., hot tub, dedicated workspace, EV charger) in your listing description and photos.
- Regularly check competitor amenities in Troy to stay competitive.
Troy Airbnb Guest Demographics & Profile Analysis (2026)
Guest Profile Summary for Troy
- The typical guest profile for Airbnb in Troy consists of primarily domestic travelers (91%), often arriving from nearby Chicago, typically belonging to the Post-2000s (Gen Z/Alpha) group (50%), primarily speaking English or Spanish.
- Domestic travelers account for 91.1% of guests.
- Key international markets include United States (91.1%) and Canada (1.8%).
- Top languages spoken are English (63.9%) followed by Spanish (16.9%).
- A significant demographic segment is the Post-2000s (Gen Z/Alpha) group, representing 50% of guests.
Recommendations for Hosts
- Target domestic marketing efforts towards travelers from Chicago and New York.
- Tailor amenities and listing descriptions to appeal to the dominant Post-2000s (Gen Z/Alpha) demographic (e.g., highlight fast WiFi, smart home features, local guides).
- Highlight unique local experiences or amenities relevant to the primary guest profile.
- Consider seasonal promotions aligned with peak travel times for key origin markets.
Nearby Short-Term Rental Market Comparison
How does the Troy Airbnb market stack up against its neighbors? Compare key performance metrics like average monthly revenue, ADR, and occupancy rates in surrounding areas to understand the broader regional STR landscape.
| Market | Active Properties | Monthly Revenue | Daily Rate | Avg. Occupancy |
|---|---|---|---|---|
| Scio Township | 18 | $5,101 | $764.17 | 43% |
| Huron Township | 17 | $5,053 | $484.21 | 40% |
| Forester | 12 | $4,952 | $407.81 | 39% |
| City of Frankenmuth | 31 | $4,860 | $320.28 | 51% |
| Port Sanilac | 32 | $4,603 | $470.83 | 37% |
| Marblehead | 12 | $4,522 | $595.67 | 39% |
| Grass Lake Charter Township | 14 | $4,410 | $365.88 | 45% |
| Ann Arbor | 487 | $4,080 | $443.76 | 43% |
| Erie Township | 10 | $3,857 | $246.01 | 51% |
| Huron | 127 | $3,854 | $378.44 | 41% |