Taylor Airbnb Market Analysis 2026: Short Term Rental Data & Vacation Rental Statistics in Michigan, United States
Is Airbnb profitable in Taylor in 2026? Explore comprehensive Airbnb analytics for Taylor, Michigan, United States to uncover income potential. This 2026 STR market report for Taylor, based on AirROI data from February 2025 to January 2026, reveals key trends in the niche market of 31 active listings.
Whether you're considering an Airbnb investment in Taylor, optimizing your existing vacation rental, or exploring rental arbitrage opportunities, understanding the Taylor Airbnb data is crucial. Leveraging the low regulation environment is key to maximizing your short term rental income potential. Let's dive into the specifics.
Key Taylor Airbnb Performance Metrics Overview
Monthly Airbnb Revenue Variations & Income Potential in Taylor (2026)
Understanding the monthly revenue variations for Airbnb listings in Taylor is key to maximizing your short term rental income potential. Seasonality significantly impacts earnings. Our analysis, based on data from the past 12 months, shows that the peak revenue month for STRs in Taylor is typically July, while February often presents the lowest earnings, highlighting opportunities for strategic pricing adjustments during shoulder and low seasons. Explore the typical Airbnb income in Taylor across different performance tiers:
- Best-in-class properties (Top 10%) achieve $3,906+ monthly, often utilizing dynamic pricing and superior guest experiences.
- Strong performing properties (Top 25%) earn $2,439 or more, indicating effective management and desirable locations/amenities.
- Typical properties (Median) generate around $1,587 per month, representing the average market performance.
- Entry-level properties (Bottom 25%) see earnings around $806, often with potential for optimization.
Average Monthly Airbnb Earnings Trend in Taylor
Taylor Airbnb Occupancy Rate Trends (2026)
Maximize your bookings by understanding the Taylor STR occupancy trends. Seasonal demand shifts significantly influence how often properties are booked. Typically, Julysees the highest demand (peak season occupancy), while January experiences the lowest (low season). Effective strategies, like adjusting minimum stays or offering promotions, can boost occupancy during slower periods. Here's how different property tiers perform in Taylor:
- Best-in-class properties (Top 10%) achieve 75%+ occupancy, indicating high desirability and potentially optimized availability.
- Strong performing properties (Top 25%) maintain 60% or higher occupancy, suggesting good market fit and guest satisfaction.
- Typical properties (Median) have an occupancy rate around 42%.
- Entry-level properties (Bottom 25%) average 22% occupancy, potentially facing higher vacancy.
Average Monthly Occupancy Rate Trend in Taylor
Average Daily Rate (ADR) Airbnb Trends in Taylor (2026)
Effective short term rental pricing strategy in Taylor involves understanding monthly ADR fluctuations. The Average Daily Rate (ADR) for Airbnb in Taylor typically peaks in July and dips lowest during February. Leveraging Airbnb dynamic pricing tools or strategies based on this seasonality can significantly boost revenue. Here's a look at the typical nightly rates achieved:
- Best-in-class properties (Top 10%) command rates of $227+ per night, often due to premium features or locations.
- Strong performing properties (Top 25%) achieve nightly rates of $180 or more.
- Typical properties (Median) charge around $134 per night.
- Entry-level properties (Bottom 25%) earn around $97 per night.
Average Daily Rate (ADR) Trend by Month in Taylor
Get Live Taylor Market Intelligence 👇

Explore Real-time Analytics
Airbnb Seasonality Analysis & Trends in Taylor (2026)
Peak Season (July, June, August)
- Revenue averages $2,604 per month
- Occupancy rates average 53.1%
- Daily rates average $149
Shoulder Season
- Revenue averages $1,852 per month
- Occupancy maintains around 41.5%
- Daily rates hold near $140
Low Season (January, February, March)
- Revenue drops to average $1,251 per month
- Occupancy decreases to average 35.6%
- Daily rates adjust to average $127
Seasonality Insights for Taylor
- The Airbnb seasonality in Taylor shows highly seasonal trends requiring careful strategy. While the sections above show seasonal averages, it's also insightful to look at the extremes:
- During the high season, the absolute peak month showcases Taylor's highest earning potential, with monthly revenues capable of climbing to $2,972, occupancy reaching a high of 58.5%, and ADRs peaking at $151.
- Conversely, the slowest single month of the year, typically falling within the low season, marks the market's lowest point. In this month, revenue might dip to $1,101, occupancy could drop to 25.2%, and ADRs may adjust down to $123.
- Understanding both the seasonal averages and these monthly peaks and troughs in revenue, occupancy, and ADR is crucial for maximizing your Airbnb profit potential in Taylor.
Seasonal Strategies for Maximizing Profit
- Peak Season: Maximize revenue through premium pricing and potentially longer minimum stays. Ensure high availability.
- Low Season: Offer competitive pricing, special promotions (e.g., extended stay discounts), and flexible cancellation policies. Target off-season travelers like remote workers or budget-conscious guests.
- Shoulder Seasons: Implement dynamic pricing that balances peak and low rates. Target weekend travelers or specific events. Offer slightly more flexible terms than peak season.
- Regularly analyze your own performance against these Taylor seasonality benchmarks and adjust your pricing and availability strategy accordingly.
Best Areas for Airbnb Investment in Taylor (2026)
Exploring the top neighborhoods for short-term rentals in Taylor? This section highlights key areas, outlining why they are attractive for hosts and guests, along with notable local attractions. Consider these locations based on your target guest profile and investment strategy.
| Neighborhood / Area | Why Host Here? (Target Guests & Appeal) | Key Attractions & Landmarks |
|---|---|---|
| Downtown Taylor | The heart of Taylor, featuring a mix of businesses, dining, and entertainment options. A prime location for guests seeking convenience and accessibility to local attractions. | Taylor Town Trade Center, Heritage Park, Taylor Meadows Golf Club, Twelve Oaks Mall, Canoeing on the Huron River |
| Heritage Park Area | A picturesque area with a large park that hosts events and recreational activities. Perfect for families and nature lovers looking for a peaceful stay. | Heritage Park, Taylor Sportsplex, Civic Center, Walking trails, Fishing spots |
| Southland Center | A popular shopping mall area that attracts many visitors. Great for hosting guests who enjoy shopping and dining nearby. | Southland Center Mall, Cinemark Theatres, Best Buy, Restaurants, Retail shops |
| Ecorse Creek | A serene area with access to nature, appealing to guests looking for outdoor activities and a quiet environment away from the city bustle. | Ecorse Creek, Walking and biking trails, Fishing spots, Nature parks, Picnic areas |
| Taylor Westfield | A developed area with many residential neighborhoods, close to local amenities and attractions, ideal for longer stays by families and workers. | Taylor Community Library, Taylor Parks, Nearby schools, Shopping and dining options |
| Taylor Market | This area includes local markets, shops, and eateries, providing a local and authentic experience for guests looking to immerse themselves in the community. | Local farmers market, Shops and boutiques, Cafés, Community events, Art fairs |
| Timberline Area | A residential neighborhood known for its quiet atmosphere and family-friendly environment. Attractive for those needing short-term rentals. | Nearby schools, Community parks, Family-friendly eateries, Quiet streets, Access to Main roads |
| Taylor Cultural Center | An area focused on arts and culture with events and educational programs, ideal for those interested in local culture and history. | Taylor Cultural Center, Art exhibitions, Local theater productions, Music events, Historical sites |
Understanding Airbnb License Requirements & STR Laws in Taylor (2026)
While Taylor, Michigan, United States currently shows low STR regulations, specific Airbnb license requirements might still exist or change. Always verify the latest short term rental regulations and Airbnb license requirements directly with local government authorities for Taylor to ensure full compliance before hosting.
(Source: AirROI data, 2026, finding no licensed listings among those analyzed)
Top Performing Airbnb Properties in Taylor (2026)
Benchmark your potential! Explore examples of top-performing Airbnb properties in Taylorbased on Trailing Twelve Month (TTM) revenue. Analyze their characteristics, revenue, occupancy rate, and ADR to understand what drives success in this market.

Comfort 10 min from DTW airport
Entire Place • 3 bedrooms
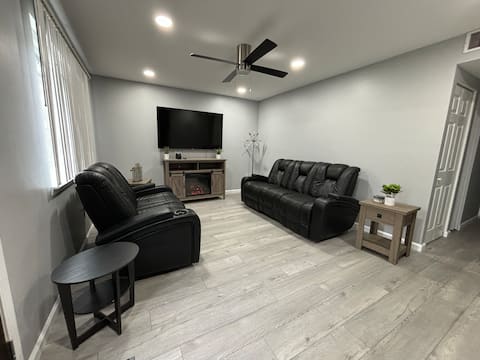
Cozy & Relaxing Home Near DTW
Entire Place • 3 bedrooms
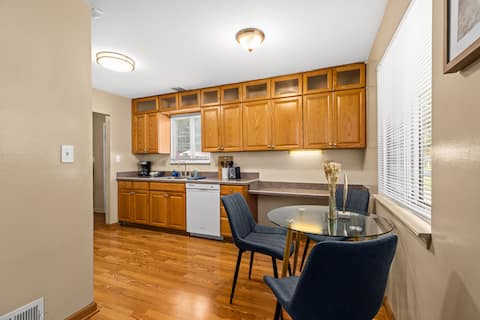
Cozy Ranch Near Airport and Downtown Detroit
Entire Place • 3 bedrooms
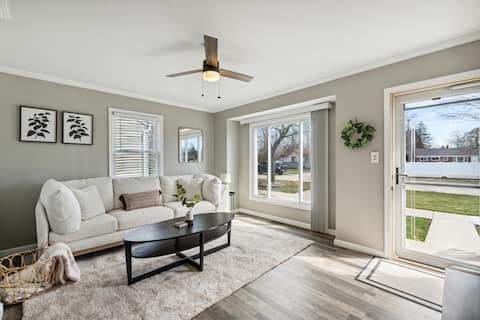
Your Metro Detroit Home Base!
Entire Place • 2 bedrooms
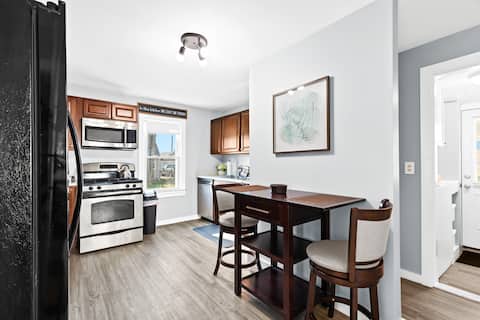
Modern Home Close to Airport and Downtown Detroit
Entire Place • 3 bedrooms
Cozy Retreat~ 2BD Home, Free Parking, Laundry
Entire Place • 2 bedrooms
Note: Performance varies based on location, size, amenities, seasonality, and management quality. Data reflects the past 12 months.
Top Performing Airbnb Hosts in Taylor (2026)
Learn from the best! This table showcases top-performing Airbnb hosts in Taylor based on the number of properties managed and estimated total revenue over the past year. Analyze their scale and performance metrics.
| Host Name | Properties | Grossing Revenue | Stay Reviews | Avg Rating |
|---|---|---|---|---|
| Jeremy | 4 | $57,257 | 45 | 4.04/5.0 |
| Emily | 1 | $45,747 | 100 | 4.90/5.0 |
| The Wolfes | 2 | $43,315 | 227 | 4.78/5.0 |
| Keaton And Hannah | 2 | $40,679 | 19 | 5.00/5.0 |
| Brittany | 1 | $38,507 | 22 | 5.00/5.0 |
| Andrew | 1 | $36,392 | 74 | 4.89/5.0 |
| Philip | 1 | $29,845 | 39 | 4.92/5.0 |
| Shone | 1 | $25,558 | 125 | 4.87/5.0 |
| Cathy | 1 | $13,579 | 205 | 4.89/5.0 |
| Nicole | 1 | $13,027 | 85 | 4.85/5.0 |
Analyzing the strategies of top hosts, such as their property selection, pricing, and guest communication, can offer valuable lessons for optimizing your own Airbnb operations in Taylor.
Dive Deeper: Advanced Taylor STR Market Data (2026)
Ready to unlock more insights? AirROI provides access to advanced metrics and comprehensive Airbnb data for Taylor. Explore detailed analytics beyond this report to refine your investment strategy, optimize pricing, and maximize your vacation rental profits.
Explore Advanced MetricsTaylor Short-Term Rental Market Composition (2026): Property & Room Types
Room Type Distribution
Property Type Distribution
Market Composition Insights for Taylor
- The Taylor Airbnb market composition is heavily skewed towards Entire Home/Apt listings, which make up 77.4% of the 31 active rentals. This indicates strong guest preference for privacy and space.
- Looking at the property type distribution in Taylor, House properties are the most common (80.6%), reflecting the local real estate landscape.
- Houses represent a significant 80.6% portion, catering likely to families or larger groups.
- Smaller segments like others (combined 3.2%) offer potential for unique stay experiences.
Taylor Airbnb Room Capacity Analysis (2026): Bedroom Distribution
Distribution of Listings by Number of Bedrooms
Room Capacity Insights for Taylor
- The dominant room capacity in Taylor is 3 bedrooms listings, making up 54.8% of the market. This suggests a strong demand for properties suitable for families or small groups.
- Together, 3 bedrooms and 2 bedrooms properties represent 74.2% of the active Airbnb listings in Taylor, indicating a high concentration in these sizes.
- A significant 61.3% of listings offer 3+ bedrooms, catering to larger groups and families seeking more space in Taylor.
Taylor Vacation Rental Guest Capacity Trends (2026)
Distribution of Listings by Guest Capacity
Guest Capacity Insights for Taylor
- The most common guest capacity trend in Taylor vacation rentals is listings accommodating 6 guests (22.6%). This suggests the primary traveler segment is likely larger groups.
- Properties designed for 6 guests and 8+ guests dominate the Taylor STR market, accounting for 45.2% of listings.
- 51.7% of properties accommodate 6+ guests, serving the market segment for larger families or group travel in Taylor.
- On average, properties in Taylor are equipped to host 4.9 guests.
Taylor Airbnb Booking Patterns (2026): Available vs. Booked Days
Available Days Distribution
Booked Days Distribution
Booking Pattern Insights for Taylor
- The most common availability pattern in Taylor falls within the 271-366 days range, representing 54.8% of listings. This suggests many properties have significant open periods on their calendars.
- Approximately 83.8% of listings show high availability (181+ days open annually), indicating potential for increased bookings or specific owner usage patterns.
- For booked days, the 31-90 days range is most frequent in Taylor (32.3%), reflecting common guest stay durations or potential owner blocking patterns.
- A notable 19.4% of properties secure long booking periods (181+ days booked per year), highlighting successful long-term rental strategies or significant owner usage.
Taylor Airbnb Minimum Stay Requirements Analysis
Distribution of Listings by Minimum Night Requirement
1 Night
8 listings
26.7% of total
2 Nights
4 listings
13.3% of total
3 Nights
2 listings
6.7% of total
4-6 Nights
2 listings
6.7% of total
7-29 Nights
5 listings
16.7% of total
30+ Nights
9 listings
30% of total
Key Insights
- The most prevalent minimum stay requirement in Taylor is 30+ Nights, adopted by 30% of listings. This highlights the market's preference for longer commitments.
- A significant segment (30%) caters to monthly stays (30+ nights) in Taylor, pointing to opportunities in the extended-stay market.
Recommendations
- Align with the market by considering a 30+ Nights minimum stay, as 30% of Taylor hosts use this setting.
- If feasible, allowing 1-night stays, especially midweek or during low season, could capture last-minute bookings, as only 26.7% currently do.
- Explore offering discounts for stays of 30+ nights to attract the 30% of the market seeking extended stays.
- Adjust minimum nights based on seasonality – potentially shorter during low season and longer during peak demand periods in Taylor.
Taylor Airbnb Cancellation Policy Trends Analysis (2026)
Super Strict 60 Days
1 listings
3.3% of total
Limited
2 listings
6.7% of total
Flexible
10 listings
33.3% of total
Moderate
7 listings
23.3% of total
Firm
7 listings
23.3% of total
Strict
3 listings
10% of total
Cancellation Policy Insights for Taylor
- The prevailing Airbnb cancellation policy trend in Taylor is Flexible, used by 33.3% of listings.
- There's a relatively balanced mix between guest-friendly (56.6%) and stricter (33.3%) policies, offering choices for different guest needs.
Recommendations for Hosts
- Consider adopting a Flexible policy to align with the 33.3% market standard in Taylor.
- Using a Strict policy might deter some guests, as only 10% of listings use it. Evaluate if potential revenue protection outweighs possible lower booking rates.
- Regularly review your cancellation policy against competitors and market demand shifts in Taylor.
Taylor STR Booking Lead Time Analysis (2026)
Average Booking Lead Time by Month
Booking Lead Time Insights for Taylor
- The overall average booking lead time for vacation rentals in Taylor is 26 days.
- Guests book furthest in advance for stays during April (average 38 days), likely coinciding with peak travel demand or local events.
- The shortest booking windows occur for stays in March (average 7 days), indicating more last-minute travel plans during this time.
- Seasonally, Spring (27 days avg.) sees the longest lead times, while Winter (12 days avg.) has the shortest, reflecting typical travel planning cycles.
Recommendations for Hosts
- Use the overall average lead time (26 days) as a baseline for your pricing and availability strategy in Taylor.
- For April stays, consider implementing length-of-stay discounts or slightly higher rates for bookings made less than 38 days out to capitalize on advance planning.
- During March, focus on last-minute booking availability and promotions, as guests book with very short notice (7 days avg.).
- Target marketing efforts for the Spring season well in advance (at least 27 days) to capture early planners.
- Monitor your own booking lead times against these Taylor averages to identify opportunities for dynamic pricing adjustments.
Popular & Essential Airbnb Amenities in Taylor (2026)
Amenity Prevalence
Amenity Insights for Taylor
- Essential amenities in Taylor that guests expect include: Air conditioning, Heating, TV, Wifi, Smoke alarm, Dishes and silverware, Free parking on premises, Dryer, Kitchen. Lacking these (any) could significantly impact bookings.
- Popular amenities like Coffee maker are common but not universal. Offering these can provide a competitive edge.
Recommendations for Hosts
- Ensure your listing includes all essential amenities for Taylor: Air conditioning, Heating, TV, Wifi, Smoke alarm, Dishes and silverware, Free parking on premises, Dryer, Kitchen.
- Prioritize adding missing essentials: Free parking on premises, Dryer, Kitchen.
- Consider adding popular differentiators like Coffee maker to increase appeal.
- Highlight unique or less common amenities you offer (e.g., hot tub, dedicated workspace, EV charger) in your listing description and photos.
- Regularly check competitor amenities in Taylor to stay competitive.
Taylor Airbnb Guest Demographics & Profile Analysis (2026)
Guest Profile Summary for Taylor
- The typical guest profile for Airbnb in Taylor consists of primarily domestic travelers (93%), often arriving from nearby Detroit, typically belonging to the Post-2000s (Gen Z/Alpha) group (50%), primarily speaking English or Spanish.
- Domestic travelers account for 93.1% of guests.
- Key international markets include United States (93.1%) and Canada (1.7%).
- Top languages spoken are English (70.1%) followed by Spanish (8.2%).
- A significant demographic segment is the Post-2000s (Gen Z/Alpha) group, representing 50% of guests.
Recommendations for Hosts
- Target domestic marketing efforts towards travelers from Detroit and Boston.
- Tailor amenities and listing descriptions to appeal to the dominant Post-2000s (Gen Z/Alpha) demographic (e.g., highlight fast WiFi, smart home features, local guides).
- Highlight unique local experiences or amenities relevant to the primary guest profile.
- Consider seasonal promotions aligned with peak travel times for key origin markets.
Nearby Short-Term Rental Market Comparison
How does the Taylor Airbnb market stack up against its neighbors? Compare key performance metrics like average monthly revenue, ADR, and occupancy rates in surrounding areas to understand the broader regional STR landscape.
| Market | Active Properties | Monthly Revenue | Daily Rate | Avg. Occupancy |
|---|---|---|---|---|
| Scio Township | 18 | $5,101 | $764.17 | 43% |
| Huron Township | 17 | $5,053 | $484.21 | 40% |
| Forester | 12 | $4,952 | $407.81 | 39% |
| City of Frankenmuth | 31 | $4,860 | $320.28 | 51% |
| Port Sanilac | 32 | $4,603 | $470.83 | 37% |
| Marblehead | 12 | $4,522 | $595.67 | 39% |
| Grass Lake Charter Township | 14 | $4,410 | $365.88 | 45% |
| Ann Arbor | 487 | $4,080 | $443.76 | 43% |
| Erie Township | 10 | $3,857 | $246.01 | 51% |
| Huron | 127 | $3,854 | $378.44 | 41% |