South Haven Charter Township Airbnb Market Analysis 2026: Short Term Rental Data & Vacation Rental Statistics in Michigan, United States
Is Airbnb profitable in South Haven Charter Township in 2026? Explore comprehensive Airbnb analytics for South Haven Charter Township, Michigan, United States to uncover income potential. This 2026 STR market report for South Haven Charter Township, based on AirROI data from February 2025 to January 2026, reveals key trends in the niche market of 45 active listings.
Whether you're considering an Airbnb investment in South Haven Charter Township, optimizing your existing vacation rental, or exploring rental arbitrage opportunities, understanding the South Haven Charter Township Airbnb data is crucial. Leveraging the low regulation environment is key to maximizing your short term rental income potential. Let's dive into the specifics.
Key South Haven Charter Township Airbnb Performance Metrics Overview
Monthly Airbnb Revenue Variations & Income Potential in South Haven Charter Township (2026)
Understanding the monthly revenue variations for Airbnb listings in South Haven Charter Township is key to maximizing your short term rental income potential. Seasonality significantly impacts earnings. Our analysis, based on data from the past 12 months, shows that the peak revenue month for STRs in South Haven Charter Township is typically July, while February often presents the lowest earnings, highlighting opportunities for strategic pricing adjustments during shoulder and low seasons. Explore the typical Airbnb income in South Haven Charter Township across different performance tiers:
- Best-in-class properties (Top 10%) achieve $13,297+ monthly, often utilizing dynamic pricing and superior guest experiences.
- Strong performing properties (Top 25%) earn $6,737 or more, indicating effective management and desirable locations/amenities.
- Typical properties (Median) generate around $3,801 per month, representing the average market performance.
- Entry-level properties (Bottom 25%) see earnings around $2,149, often with potential for optimization.
Average Monthly Airbnb Earnings Trend in South Haven Charter Township
South Haven Charter Township Airbnb Occupancy Rate Trends (2026)
Maximize your bookings by understanding the South Haven Charter Township STR occupancy trends. Seasonal demand shifts significantly influence how often properties are booked. Typically, Julysees the highest demand (peak season occupancy), while January experiences the lowest (low season). Effective strategies, like adjusting minimum stays or offering promotions, can boost occupancy during slower periods. Here's how different property tiers perform in South Haven Charter Township:
- Best-in-class properties (Top 10%) achieve 63%+ occupancy, indicating high desirability and potentially optimized availability.
- Strong performing properties (Top 25%) maintain 51% or higher occupancy, suggesting good market fit and guest satisfaction.
- Typical properties (Median) have an occupancy rate around 35%.
- Entry-level properties (Bottom 25%) average 23% occupancy, potentially facing higher vacancy.
Average Monthly Occupancy Rate Trend in South Haven Charter Township
Average Daily Rate (ADR) Airbnb Trends in South Haven Charter Township (2026)
Effective short term rental pricing strategy in South Haven Charter Township involves understanding monthly ADR fluctuations. The Average Daily Rate (ADR) for Airbnb in South Haven Charter Township typically peaks in June and dips lowest during March. Leveraging Airbnb dynamic pricing tools or strategies based on this seasonality can significantly boost revenue. Here's a look at the typical nightly rates achieved:
- Best-in-class properties (Top 10%) command rates of $859+ per night, often due to premium features or locations.
- Strong performing properties (Top 25%) achieve nightly rates of $510 or more.
- Typical properties (Median) charge around $326 per night.
- Entry-level properties (Bottom 25%) earn around $244 per night.
Average Daily Rate (ADR) Trend by Month in South Haven Charter Township
Get Live South Haven Charter Township Market Intelligence 👇

Explore Real-time Analytics
Airbnb Seasonality Analysis & Trends in South Haven Charter Township (2026)
Peak Season (July, August, June)
- Revenue averages $11,454 per month
- Occupancy rates average 59.5%
- Daily rates average $546
Shoulder Season
- Revenue averages $4,361 per month
- Occupancy maintains around 35.2%
- Daily rates hold near $427
Low Season (January, February, December)
- Revenue drops to average $2,653 per month
- Occupancy decreases to average 23.5%
- Daily rates adjust to average $418
Seasonality Insights for South Haven Charter Township
- The Airbnb seasonality in South Haven Charter Township shows highly seasonal trends requiring careful strategy. While the sections above show seasonal averages, it's also insightful to look at the extremes:
- During the high season, the absolute peak month showcases South Haven Charter Township's highest earning potential, with monthly revenues capable of climbing to $14,389, occupancy reaching a high of 70.0%, and ADRs peaking at $553.
- Conversely, the slowest single month of the year, typically falling within the low season, marks the market's lowest point. In this month, revenue might dip to $2,353, occupancy could drop to 18.2%, and ADRs may adjust down to $384.
- Understanding both the seasonal averages and these monthly peaks and troughs in revenue, occupancy, and ADR is crucial for maximizing your Airbnb profit potential in South Haven Charter Township.
Seasonal Strategies for Maximizing Profit
- Peak Season: Maximize revenue through premium pricing and potentially longer minimum stays. Ensure high availability.
- Low Season: Offer competitive pricing, special promotions (e.g., extended stay discounts), and flexible cancellation policies. Target off-season travelers like remote workers or budget-conscious guests.
- Shoulder Seasons: Implement dynamic pricing that balances peak and low rates. Target weekend travelers or specific events. Offer slightly more flexible terms than peak season.
- Regularly analyze your own performance against these South Haven Charter Township seasonality benchmarks and adjust your pricing and availability strategy accordingly.
Best Areas for Airbnb Investment in South Haven Charter Township (2026)
Exploring the top neighborhoods for short-term rentals in South Haven Charter Township? This section highlights key areas, outlining why they are attractive for hosts and guests, along with notable local attractions. Consider these locations based on your target guest profile and investment strategy.
| Neighborhood / Area | Why Host Here? (Target Guests & Appeal) | Key Attractions & Landmarks |
|---|---|---|
| South Beach | Iconic area known for its beautiful beaches, vibrant nightlife, and historic buildings. Primarily attracts tourists and beach lovers looking for a sunny getaway. | South Beach, Ocean Drive, Art Deco District, Lummus Park, Versace Mansion, Lincoln Road |
| Downtown South Haven | The heart of the city with local shops, restaurants, and cultural attractions. Ideal for travelers wanting to experience local flavor and community vibes. | South Haven Lighthouse, Wells Street Beach, Blue Coast Artists Gallery, Local shops and eateries |
| Lake Michigan Shore | A scenic area along the Lake Michigan coastline, perfect for outdoor enthusiasts and families seeking fun in the sun. | Lake Michigan beaches, Paw Paw River, Outdoor parks, Beach access, Fishing spots |
| Haven Peaches | Known for its agricultural charm, this area draws visitors interested in farm-to-table experiences and seasonal festivities. | Local farms and markets, Peach orchards, Annual Peach Festival |
| South Haven Historical District | Rich in history and charming architecture, attracting guests who appreciate culture, local history, and picturesque settings. | Historical buildings, Museums, Local history tours |
| North Beach | A quieter beach area ideal for relaxation and enjoying nature, suitable for families and couples seeking peace. | North Beach Park, Nature trails, Relaxation spots |
| Van Buren State Park | A nature lover's paradise with hiking trails, beaches, and camping facilities. Great for adventure seekers and those wanting outdoor activities. | Hiking trails, Campgrounds, Scenic vistas |
| Saugatuck-Douglas | A nearby artsy community known for its galleries, shops, and beautiful waterfronts, attracting visitors seeking a unique cultural experience. | Saugatuck Dunes State Park, Art galleries, Local wine shops, Saugatuck Chain Ferry |
Understanding Airbnb License Requirements & STR Laws in South Haven Charter Township (2026)
While South Haven Charter Township, Michigan, United States currently shows low STR regulations, specific Airbnb license requirements might still exist or change. Always verify the latest short term rental regulations and Airbnb license requirements directly with local government authorities for South Haven Charter Township to ensure full compliance before hosting.
(Source: AirROI data, 2026, finding no licensed listings among those analyzed)
Top Performing Airbnb Properties in South Haven Charter Township (2026)
Benchmark your potential! Explore examples of top-performing Airbnb properties in South Haven Charter Townshipbased on Trailing Twelve Month (TTM) revenue. Analyze their characteristics, revenue, occupancy rate, and ADR to understand what drives success in this market.
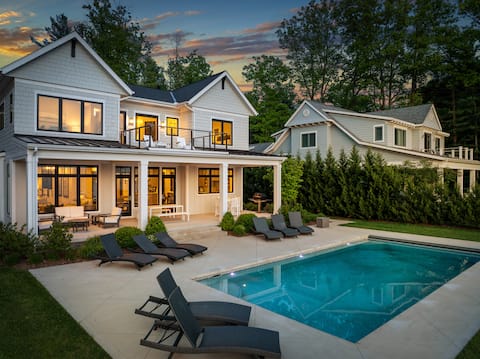
Michigan Shores | Lake View, Pool & Game Room
Entire Place • 4 bedrooms

4-Cabins | Pickleball | Hot Tub | Sauna | Fire Pit
Entire Place • 6 bedrooms
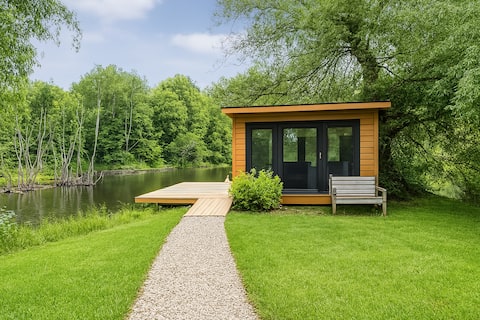
The River Retreat
Entire Place • 5 bedrooms
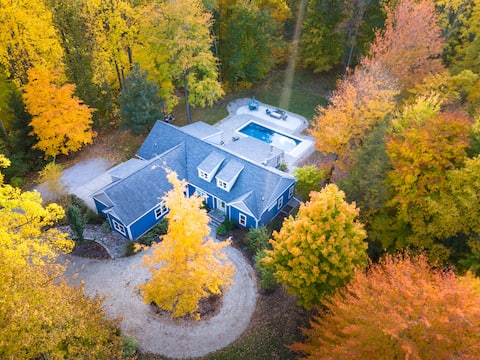
Water-Winter Wonderland! Hot Tub & Game Room
Entire Place • 5 bedrooms
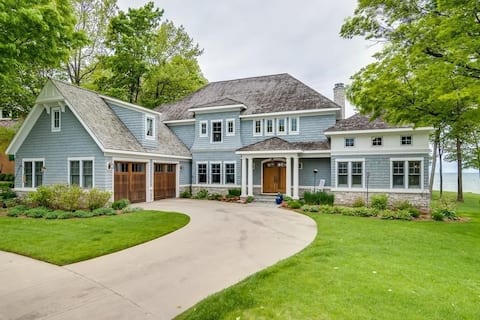
Lake Views, Hot Tub, Fire Pit & Association Pool
Entire Place • 5 bedrooms
Pool, Hot Tub & Screened Porch w/Fireplace
Entire Place • 4 bedrooms
Note: Performance varies based on location, size, amenities, seasonality, and management quality. Data reflects the past 12 months.
Top Performing Airbnb Hosts in South Haven Charter Township (2026)
Learn from the best! This table showcases top-performing Airbnb hosts in South Haven Charter Township based on the number of properties managed and estimated total revenue over the past year. Analyze their scale and performance metrics.
| Host Name | Properties | Grossing Revenue | Stay Reviews | Avg Rating |
|---|---|---|---|---|
| Wander | 1 | $275,994 | 11 | 4.82/5.0 |
| Terri | 2 | $270,802 | 9 | 4.67/5.0 |
| StayDogRentals - Jason | 1 | $187,608 | 52 | 4.92/5.0 |
| Sherry | 5 | $158,877 | 76 | 5.00/5.0 |
| Aaron | 1 | $152,697 | 51 | 4.90/5.0 |
| Jay | 1 | $144,418 | 85 | 4.99/5.0 |
| Jaqua | 2 | $91,435 | 11 | 4.33/5.0 |
| Kati | 1 | $87,723 | 50 | 4.84/5.0 |
| Mark | 1 | $86,824 | 20 | 5.00/5.0 |
| Taylor | 1 | $72,891 | 60 | 4.93/5.0 |
Analyzing the strategies of top hosts, such as their property selection, pricing, and guest communication, can offer valuable lessons for optimizing your own Airbnb operations in South Haven Charter Township.
Dive Deeper: Advanced South Haven Charter Township STR Market Data (2026)
Ready to unlock more insights? AirROI provides access to advanced metrics and comprehensive Airbnb data for South Haven Charter Township. Explore detailed analytics beyond this report to refine your investment strategy, optimize pricing, and maximize your vacation rental profits.
Explore Advanced MetricsSouth Haven Charter Township Short-Term Rental Market Composition (2026): Property & Room Types
Room Type Distribution
Property Type Distribution
Market Composition Insights for South Haven Charter Township
- The South Haven Charter Township Airbnb market composition is heavily skewed towards Entire Home/Apt listings, which make up 77.8% of the 45 active rentals. This indicates strong guest preference for privacy and space.
- Looking at the property type distribution in South Haven Charter Township, House properties are the most common (68.9%), reflecting the local real estate landscape.
- Houses represent a significant 68.9% portion, catering likely to families or larger groups.
- The presence of 17.8% Hotel/Boutique listings indicates integration with traditional hospitality.
- Smaller segments like unique stays (combined 2.2%) offer potential for unique stay experiences.
South Haven Charter Township Airbnb Room Capacity Analysis (2026): Bedroom Distribution
Distribution of Listings by Number of Bedrooms
Room Capacity Insights for South Haven Charter Township
- The dominant room capacity in South Haven Charter Township is 4 bedrooms listings, making up 22.2% of the market. This suggests a strong demand for properties suitable for families or small groups.
- Together, 4 bedrooms and 3 bedrooms properties represent 44.4% of the active Airbnb listings in South Haven Charter Township, indicating a high concentration in these sizes.
- A significant 62.2% of listings offer 3+ bedrooms, catering to larger groups and families seeking more space in South Haven Charter Township.
South Haven Charter Township Vacation Rental Guest Capacity Trends (2026)
Distribution of Listings by Guest Capacity
Guest Capacity Insights for South Haven Charter Township
- The most common guest capacity trend in South Haven Charter Township vacation rentals is listings accommodating 8+ guests (60%). This suggests the primary traveler segment is likely larger groups.
- Properties designed for 8+ guests and 6 guests dominate the South Haven Charter Township STR market, accounting for 68.9% of listings.
- 71.1% of properties accommodate 6+ guests, serving the market segment for larger families or group travel in South Haven Charter Township.
- On average, properties in South Haven Charter Township are equipped to host 5.8 guests.
South Haven Charter Township Airbnb Booking Patterns (2026): Available vs. Booked Days
Available Days Distribution
Booked Days Distribution
Booking Pattern Insights for South Haven Charter Township
- The most common availability pattern in South Haven Charter Township falls within the 181-270 days range, representing 51.1% of listings. This suggests many properties have significant open periods on their calendars.
- Approximately 88.9% of listings show high availability (181+ days open annually), indicating potential for increased bookings or specific owner usage patterns.
- For booked days, the 91-180 days range is most frequent in South Haven Charter Township (51.1%), reflecting common guest stay durations or potential owner blocking patterns.
- A notable 11.1% of properties secure long booking periods (181+ days booked per year), highlighting successful long-term rental strategies or significant owner usage.
South Haven Charter Township Airbnb Minimum Stay Requirements Analysis
Distribution of Listings by Minimum Night Requirement
1 Night
11 listings
24.4% of total
2 Nights
5 listings
11.1% of total
3 Nights
3 listings
6.7% of total
4-6 Nights
3 listings
6.7% of total
30+ Nights
23 listings
51.1% of total
Key Insights
- The most prevalent minimum stay requirement in South Haven Charter Township is 30+ Nights, adopted by 51.1% of listings. This highlights the market's preference for longer commitments.
- A significant segment (51.1%) caters to monthly stays (30+ nights) in South Haven Charter Township, pointing to opportunities in the extended-stay market.
Recommendations
- Align with the market by considering a 30+ Nights minimum stay, as 51.1% of South Haven Charter Township hosts use this setting.
- If feasible, allowing 1-night stays, especially midweek or during low season, could capture last-minute bookings, as only 24.4% currently do.
- Explore offering discounts for stays of 30+ nights to attract the 51.1% of the market seeking extended stays.
- Adjust minimum nights based on seasonality – potentially shorter during low season and longer during peak demand periods in South Haven Charter Township.
South Haven Charter Township Airbnb Cancellation Policy Trends Analysis (2026)
Super Strict 30 Days
3 listings
6.7% of total
Limited
1 listings
2.2% of total
Super Strict 60 Days
4 listings
8.9% of total
Flexible
5 listings
11.1% of total
Moderate
10 listings
22.2% of total
Firm
14 listings
31.1% of total
Strict
8 listings
17.8% of total
Cancellation Policy Insights for South Haven Charter Township
- The prevailing Airbnb cancellation policy trend in South Haven Charter Township is Firm, used by 31.1% of listings.
- There's a relatively balanced mix between guest-friendly (33.3%) and stricter (48.9%) policies, offering choices for different guest needs.
Recommendations for Hosts
- Consider adopting a Firm policy to align with the 31.1% market standard in South Haven Charter Township.
- Regularly review your cancellation policy against competitors and market demand shifts in South Haven Charter Township.
South Haven Charter Township STR Booking Lead Time Analysis (2026)
Average Booking Lead Time by Month
Booking Lead Time Insights for South Haven Charter Township
- The overall average booking lead time for vacation rentals in South Haven Charter Township is 68 days.
- Guests book furthest in advance for stays during July (average 120 days), likely coinciding with peak travel demand or local events.
- The shortest booking windows occur for stays in January (average 15 days), indicating more last-minute travel plans during this time.
- Seasonally, Summer (94 days avg.) sees the longest lead times, while Winter (24 days avg.) has the shortest, reflecting typical travel planning cycles.
Recommendations for Hosts
- Use the overall average lead time (68 days) as a baseline for your pricing and availability strategy in South Haven Charter Township.
- For July stays, consider implementing length-of-stay discounts or slightly higher rates for bookings made less than 120 days out to capitalize on advance planning.
- Target marketing efforts for the Summer season well in advance (at least 94 days) to capture early planners.
- Monitor your own booking lead times against these South Haven Charter Township averages to identify opportunities for dynamic pricing adjustments.
Popular & Essential Airbnb Amenities in South Haven Charter Township (2026)
Amenity Prevalence
Amenity Insights for South Haven Charter Township
- Essential amenities in South Haven Charter Township that guests expect include: Wifi, Free parking on premises, Hair dryer, Air conditioning, Smoke alarm, Hot water, Refrigerator. Lacking these (any) could significantly impact bookings.
- Popular amenities like Carbon monoxide alarm, Heating, Microwave are common but not universal. Offering these can provide a competitive edge.
Recommendations for Hosts
- Ensure your listing includes all essential amenities for South Haven Charter Township: Wifi, Free parking on premises, Hair dryer, Air conditioning, Smoke alarm, Hot water, Refrigerator.
- Prioritize adding missing essentials: Hair dryer, Air conditioning, Smoke alarm, Hot water, Refrigerator.
- Consider adding popular differentiators like Carbon monoxide alarm or Heating to increase appeal.
- Highlight unique or less common amenities you offer (e.g., hot tub, dedicated workspace, EV charger) in your listing description and photos.
- Regularly check competitor amenities in South Haven Charter Township to stay competitive.
South Haven Charter Township Airbnb Guest Demographics & Profile Analysis (2026)
Guest Profile Summary for South Haven Charter Township
- The typical guest profile for Airbnb in South Haven Charter Township consists of primarily domestic travelers (97%), often arriving from nearby Chicago, typically belonging to the Post-2000s (Gen Z/Alpha) group (50%), primarily speaking English or Spanish.
- Domestic travelers account for 96.9% of guests.
- Key international markets include United States (96.9%) and United Kingdom (0.4%).
- Top languages spoken are English (77.8%) followed by Spanish (10%).
- A significant demographic segment is the Post-2000s (Gen Z/Alpha) group, representing 50% of guests.
Recommendations for Hosts
- Target domestic marketing efforts towards travelers from Chicago and Indianapolis.
- Tailor amenities and listing descriptions to appeal to the dominant Post-2000s (Gen Z/Alpha) demographic (e.g., highlight fast WiFi, smart home features, local guides).
- Highlight unique local experiences or amenities relevant to the primary guest profile.
- Consider seasonal promotions aligned with peak travel times for key origin markets.
Nearby Short-Term Rental Market Comparison
How does the South Haven Charter Township Airbnb market stack up against its neighbors? Compare key performance metrics like average monthly revenue, ADR, and occupancy rates in surrounding areas to understand the broader regional STR landscape.
| Market | Active Properties | Monthly Revenue | Daily Rate | Avg. Occupancy |
|---|---|---|---|---|
| Laketown Township | 59 | $6,112 | $529.59 | 44% |
| Port Sheldon Township | 26 | $6,015 | $566.98 | 47% |
| Ganges Township | 69 | $5,687 | $636.25 | 38% |
| Saugatuck Township | 141 | $5,627 | $508.58 | 43% |
| Paw Paw Township | 10 | $5,458 | $418.85 | 49% |
| New Buffalo Township | 260 | $5,145 | $633.18 | 36% |
| Bertrand Township | 22 | $5,011 | $365.69 | 40% |
| Union Pier | 16 | $4,998 | $659.10 | 36% |
| Fremont | 16 | $4,898 | $436.31 | 42% |
| Grattan Township | 16 | $4,890 | $353.91 | 56% |