Rochester Hills Airbnb Market Analysis 2026: Short Term Rental Data & Vacation Rental Statistics in Michigan, United States
Is Airbnb profitable in Rochester Hills in 2026? Explore comprehensive Airbnb analytics for Rochester Hills, Michigan, United States to uncover income potential. This 2026 STR market report for Rochester Hills, based on AirROI data from February 2025 to January 2026, reveals key trends in the niche market of 21 active listings.
Whether you're considering an Airbnb investment in Rochester Hills, optimizing your existing vacation rental, or exploring rental arbitrage opportunities, understanding the Rochester Hills Airbnb data is crucial. Leveraging the low regulation environment is key to maximizing your short term rental income potential. Let's dive into the specifics.
Key Rochester Hills Airbnb Performance Metrics Overview
Monthly Airbnb Revenue Variations & Income Potential in Rochester Hills (2026)
Understanding the monthly revenue variations for Airbnb listings in Rochester Hills is key to maximizing your short term rental income potential. Seasonality significantly impacts earnings. Our analysis, based on data from the past 12 months, shows that the peak revenue month for STRs in Rochester Hills is typically July, while January often presents the lowest earnings, highlighting opportunities for strategic pricing adjustments during shoulder and low seasons. Explore the typical Airbnb income in Rochester Hills across different performance tiers:
- Best-in-class properties (Top 10%) achieve $4,857+ monthly, often utilizing dynamic pricing and superior guest experiences.
- Strong performing properties (Top 25%) earn $3,149 or more, indicating effective management and desirable locations/amenities.
- Typical properties (Median) generate around $1,436 per month, representing the average market performance.
- Entry-level properties (Bottom 25%) see earnings around $762, often with potential for optimization.
Average Monthly Airbnb Earnings Trend in Rochester Hills
Rochester Hills Airbnb Occupancy Rate Trends (2026)
Maximize your bookings by understanding the Rochester Hills STR occupancy trends. Seasonal demand shifts significantly influence how often properties are booked. Typically, Augustsees the highest demand (peak season occupancy), while January experiences the lowest (low season). Effective strategies, like adjusting minimum stays or offering promotions, can boost occupancy during slower periods. Here's how different property tiers perform in Rochester Hills:
- Best-in-class properties (Top 10%) achieve 82%+ occupancy, indicating high desirability and potentially optimized availability.
- Strong performing properties (Top 25%) maintain 68% or higher occupancy, suggesting good market fit and guest satisfaction.
- Typical properties (Median) have an occupancy rate around 44%.
- Entry-level properties (Bottom 25%) average 22% occupancy, potentially facing higher vacancy.
Average Monthly Occupancy Rate Trend in Rochester Hills
Average Daily Rate (ADR) Airbnb Trends in Rochester Hills (2026)
Effective short term rental pricing strategy in Rochester Hills involves understanding monthly ADR fluctuations. The Average Daily Rate (ADR) for Airbnb in Rochester Hills typically peaks in June and dips lowest during January. Leveraging Airbnb dynamic pricing tools or strategies based on this seasonality can significantly boost revenue. Here's a look at the typical nightly rates achieved:
- Best-in-class properties (Top 10%) command rates of $504+ per night, often due to premium features or locations.
- Strong performing properties (Top 25%) achieve nightly rates of $186 or more.
- Typical properties (Median) charge around $96 per night.
- Entry-level properties (Bottom 25%) earn around $65 per night.
Average Daily Rate (ADR) Trend by Month in Rochester Hills
Get Live Rochester Hills Market Intelligence 👇

Explore Real-time Analytics
Airbnb Seasonality Analysis & Trends in Rochester Hills (2026)
Peak Season (July, August, May)
- Revenue averages $2,765 per month
- Occupancy rates average 60.5%
- Daily rates average $174
Shoulder Season
- Revenue averages $2,223 per month
- Occupancy maintains around 47.4%
- Daily rates hold near $171
Low Season (January, February, November)
- Revenue drops to average $1,307 per month
- Occupancy decreases to average 30.3%
- Daily rates adjust to average $164
Seasonality Insights for Rochester Hills
- The Airbnb seasonality in Rochester Hills shows highly seasonal trends requiring careful strategy. While the sections above show seasonal averages, it's also insightful to look at the extremes:
- During the high season, the absolute peak month showcases Rochester Hills's highest earning potential, with monthly revenues capable of climbing to $2,898, occupancy reaching a high of 66.1%, and ADRs peaking at $177.
- Conversely, the slowest single month of the year, typically falling within the low season, marks the market's lowest point. In this month, revenue might dip to $1,122, occupancy could drop to 23.8%, and ADRs may adjust down to $159.
- Understanding both the seasonal averages and these monthly peaks and troughs in revenue, occupancy, and ADR is crucial for maximizing your Airbnb profit potential in Rochester Hills.
Seasonal Strategies for Maximizing Profit
- Peak Season: Maximize revenue through premium pricing and potentially longer minimum stays. Ensure high availability.
- Low Season: Offer competitive pricing, special promotions (e.g., extended stay discounts), and flexible cancellation policies. Target off-season travelers like remote workers or budget-conscious guests.
- Shoulder Seasons: Implement dynamic pricing that balances peak and low rates. Target weekend travelers or specific events. Offer slightly more flexible terms than peak season.
- Regularly analyze your own performance against these Rochester Hills seasonality benchmarks and adjust your pricing and availability strategy accordingly.
Best Areas for Airbnb Investment in Rochester Hills (2026)
Exploring the top neighborhoods for short-term rentals in Rochester Hills? This section highlights key areas, outlining why they are attractive for hosts and guests, along with notable local attractions. Consider these locations based on your target guest profile and investment strategy.
| Neighborhood / Area | Why Host Here? (Target Guests & Appeal) | Key Attractions & Landmarks |
|---|---|---|
| Downtown Rochester | Heart of the city with a blend of commerce, dining, and cultural attractions. Great for visitors wanting to experience local events and festivals. | Rochester Municipal Park, Rochester Hills Museum at Van Hoosen Farm, Rochester Farmers Market, Local shops and restaurants, Stony Creek Metropark |
| Rochester Hills | Suburban area with a family-friendly atmosphere, offering parks and outdoor activities. Ideal for families and longer stays. | Redwood Park, Pine trace Golf Club, The Clinton River Trail, Rochester Hills Public Library, Great Lakes Crossing Outlets |
| Orchid Neighborhood | A quiet and beautiful residential area known for its scenic views and local parks, perfect for guests seeking a peaceful getaway. | Orchid Park, Mountain biking trails, Nature Reserve, Close proximity to downtown amenities |
| Bald Mountain State Recreation Area | A large state park offering camping, hiking, and nature activities, appealing to nature lovers and outdoor enthusiasts. | Hiking trails, Camping grounds, Fishing spots, Picnicking areas, Wildlife watching |
| Brewster-Douglas Neighborhood | An up-and-coming area with access to local businesses and entertainment, catering to a younger demographic. | Local cafes and eateries, Art installations, Community events, Proximity to public transport |
| Stony Creek Metropark | A vast regional park offering a variety of outdoor recreational activities, attracting visitors who enjoy nature and sports. | Swimming areas, Picnic shelters, Hiking and biking trails, Golf courses, Boat rentals |
| Oakland University Area | Nearby university attracts visitors for campus tours, events, and family visits, ideal for short-term stays. | Oakland University, Meadow Brook Hall, Nature trails, Cultural events |
| Troy Transit Center Area | Hub for business travelers and visitors to the nearby corporate offices and shopping centers, suitable for all types of guests. | Troy Historic Village, Local shopping centers, Dining options, Access to public transport |
Understanding Airbnb License Requirements & STR Laws in Rochester Hills (2026)
While Rochester Hills, Michigan, United States currently shows low STR regulations, specific Airbnb license requirements might still exist or change. Always verify the latest short term rental regulations and Airbnb license requirements directly with local government authorities for Rochester Hills to ensure full compliance before hosting.
(Source: AirROI data, 2026, finding no licensed listings among those analyzed)
Top Performing Airbnb Properties in Rochester Hills (2026)
Benchmark your potential! Explore examples of top-performing Airbnb properties in Rochester Hillsbased on Trailing Twelve Month (TTM) revenue. Analyze their characteristics, revenue, occupancy rate, and ADR to understand what drives success in this market.
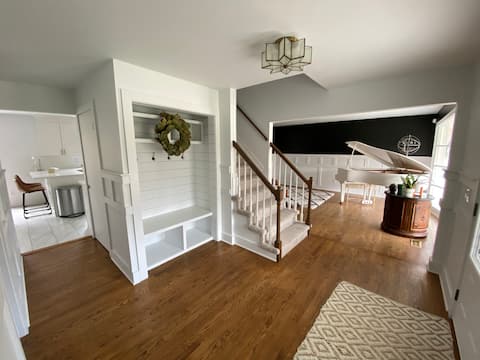
4BR Colonial Home (Executive or Family Rental)
Entire Place • 4 bedrooms

Retreat in the Hills
Entire Place • 4 bedrooms
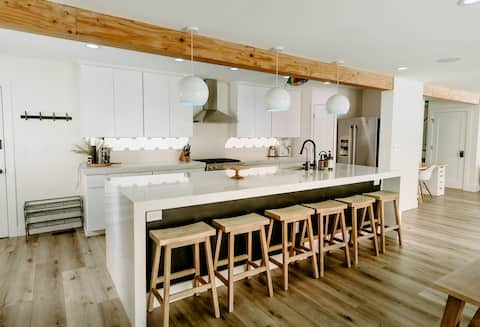
Modern Contemporary Farmhouse
Entire Place • 4 bedrooms

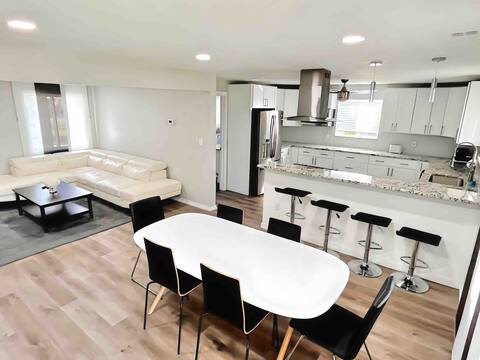
Comfy 2 bedroom house in RH -Mid and Long term
Entire Place • 2 bedrooms
#1 LUX 4 Bed, Private Yard W/ Pickleball+ B-ball
Entire Place • 4 bedrooms
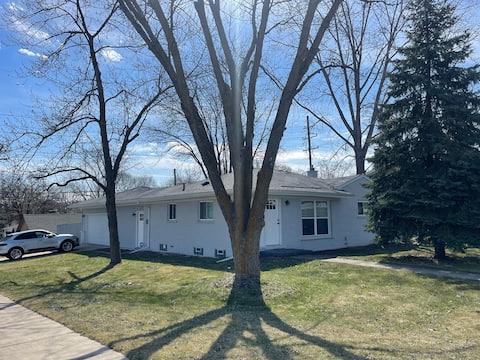
Ranch 3 Bedrooms 2 Baths.
Entire Place • 3 bedrooms
Note: Performance varies based on location, size, amenities, seasonality, and management quality. Data reflects the past 12 months.
Top Performing Airbnb Hosts in Rochester Hills (2026)
Learn from the best! This table showcases top-performing Airbnb hosts in Rochester Hills based on the number of properties managed and estimated total revenue over the past year. Analyze their scale and performance metrics.
| Host Name | Properties | Grossing Revenue | Stay Reviews | Avg Rating |
|---|---|---|---|---|
| Gabe | 1 | $51,881 | 78 | 4.96/5.0 |
| Ron | 1 | $42,278 | 15 | 5.00/5.0 |
| Fen | 4 | $41,606 | 97 | 4.89/5.0 |
| Ligia | 1 | $35,839 | 94 | 4.85/5.0 |
| Jim D | 1 | $30,414 | 42 | 4.95/5.0 |
| StayArbor Hospitality | 2 | $24,361 | 47 | 4.85/5.0 |
| Daniel | 1 | $23,743 | 46 | 4.96/5.0 |
| Joyce | 1 | $23,005 | 21 | 4.57/5.0 |
| Easy Clean Homes MI | 1 | $14,347 | 11 | 5.00/5.0 |
| Harijanto | 1 | $10,860 | 34 | 4.97/5.0 |
Analyzing the strategies of top hosts, such as their property selection, pricing, and guest communication, can offer valuable lessons for optimizing your own Airbnb operations in Rochester Hills.
Dive Deeper: Advanced Rochester Hills STR Market Data (2026)
Ready to unlock more insights? AirROI provides access to advanced metrics and comprehensive Airbnb data for Rochester Hills. Explore detailed analytics beyond this report to refine your investment strategy, optimize pricing, and maximize your vacation rental profits.
Explore Advanced MetricsRochester Hills Short-Term Rental Market Composition (2026): Property & Room Types
Room Type Distribution
Property Type Distribution
Market Composition Insights for Rochester Hills
- The Rochester Hills Airbnb market composition is heavily skewed towards Entire Home/Apt listings, which make up 52.4% of the 21 active rentals. This indicates strong guest preference for privacy and space.
- However, a notable 47.6% share for Private Rooms suggests opportunities for budget-conscious travelers or hosts renting out spare rooms.
- Looking at the property type distribution in Rochester Hills, House properties are the most common (95.2%), reflecting the local real estate landscape.
- Houses represent a significant 95.2% portion, catering likely to families or larger groups.
- Smaller segments like apartment/condo (combined 4.8%) offer potential for unique stay experiences.
Rochester Hills Airbnb Room Capacity Analysis (2026): Bedroom Distribution
Distribution of Listings by Number of Bedrooms
Room Capacity Insights for Rochester Hills
- The dominant room capacity in Rochester Hills is 4 bedrooms listings, making up 23.8% of the market. This suggests a strong demand for properties suitable for families or small groups.
- Together, 4 bedrooms and 3 bedrooms properties represent 38.1% of the active Airbnb listings in Rochester Hills, indicating a high concentration in these sizes.
- A significant 42.9% of listings offer 3+ bedrooms, catering to larger groups and families seeking more space in Rochester Hills.
Rochester Hills Vacation Rental Guest Capacity Trends (2026)
Distribution of Listings by Guest Capacity
Guest Capacity Insights for Rochester Hills
- The most common guest capacity trend in Rochester Hills vacation rentals is listings accommodating 8+ guests (28.6%). This suggests the primary traveler segment is likely larger groups.
- Properties designed for 8+ guests and 6 guests dominate the Rochester Hills STR market, accounting for 42.9% of listings.
- 42.9% of properties accommodate 6+ guests, serving the market segment for larger families or group travel in Rochester Hills.
- On average, properties in Rochester Hills are equipped to host 3.6 guests.
Rochester Hills Airbnb Booking Patterns (2026): Available vs. Booked Days
Available Days Distribution
Booked Days Distribution
Booking Pattern Insights for Rochester Hills
- The most common availability pattern in Rochester Hills falls within the 271-366 days range, representing 47.6% of listings. This suggests many properties have significant open periods on their calendars.
- Approximately 76.2% of listings show high availability (181+ days open annually), indicating potential for increased bookings or specific owner usage patterns.
- For booked days, the 91-180 days range is most frequent in Rochester Hills (33.3%), reflecting common guest stay durations or potential owner blocking patterns.
- A notable 23.8% of properties secure long booking periods (181+ days booked per year), highlighting successful long-term rental strategies or significant owner usage.
Rochester Hills Airbnb Minimum Stay Requirements Analysis
Distribution of Listings by Minimum Night Requirement
1 Night
3 listings
14.3% of total
3 Nights
1 listings
4.8% of total
4-6 Nights
7 listings
33.3% of total
7-29 Nights
4 listings
19% of total
30+ Nights
6 listings
28.6% of total
Key Insights
- The most prevalent minimum stay requirement in Rochester Hills is 4-6 Nights, adopted by 33.3% of listings. This highlights the market's preference for longer commitments.
- Very short stays (1-2 nights) are less common (14.3%), suggesting hosts prefer slightly longer bookings to optimize turnover.
- A significant segment (28.6%) caters to monthly stays (30+ nights) in Rochester Hills, pointing to opportunities in the extended-stay market.
Recommendations
- Align with the market by considering a 4-6 Nights minimum stay, as 33.3% of Rochester Hills hosts use this setting.
- If feasible, allowing 1-night stays, especially midweek or during low season, could capture last-minute bookings, as only 14.3% currently do.
- Explore offering discounts for stays of 30+ nights to attract the 28.6% of the market seeking extended stays.
- Adjust minimum nights based on seasonality – potentially shorter during low season and longer during peak demand periods in Rochester Hills.
Rochester Hills Airbnb Cancellation Policy Trends Analysis (2026)
Super Strict 60 Days
1 listings
4.8% of total
Flexible
5 listings
23.8% of total
Moderate
5 listings
23.8% of total
Firm
9 listings
42.9% of total
Strict
1 listings
4.8% of total
Cancellation Policy Insights for Rochester Hills
- The prevailing Airbnb cancellation policy trend in Rochester Hills is Firm, used by 42.9% of listings.
- There's a relatively balanced mix between guest-friendly (47.6%) and stricter (47.7%) policies, offering choices for different guest needs.
- Strict cancellation policies are quite rare (4.8%), potentially making listings with this policy less competitive unless justified by high demand or property type.
Recommendations for Hosts
- Consider adopting a Firm policy to align with the 42.9% market standard in Rochester Hills.
- Using a Strict policy might deter some guests, as only 4.8% of listings use it. Evaluate if potential revenue protection outweighs possible lower booking rates.
- Regularly review your cancellation policy against competitors and market demand shifts in Rochester Hills.
Rochester Hills STR Booking Lead Time Analysis (2026)
Average Booking Lead Time by Month
Booking Lead Time Insights for Rochester Hills
- The overall average booking lead time for vacation rentals in Rochester Hills is 42 days.
- Guests book furthest in advance for stays during July (average 87 days), likely coinciding with peak travel demand or local events.
- The shortest booking windows occur for stays in December (average 10 days), indicating more last-minute travel plans during this time.
- Seasonally, Summer (62 days avg.) sees the longest lead times, while Winter (16 days avg.) has the shortest, reflecting typical travel planning cycles.
Recommendations for Hosts
- Use the overall average lead time (42 days) as a baseline for your pricing and availability strategy in Rochester Hills.
- For July stays, consider implementing length-of-stay discounts or slightly higher rates for bookings made less than 87 days out to capitalize on advance planning.
- During December, focus on last-minute booking availability and promotions, as guests book with very short notice (10 days avg.).
- Target marketing efforts for the Summer season well in advance (at least 62 days) to capture early planners.
- Monitor your own booking lead times against these Rochester Hills averages to identify opportunities for dynamic pricing adjustments.
Popular & Essential Airbnb Amenities in Rochester Hills (2026)
Amenity Prevalence
Amenity Insights for Rochester Hills
- Essential amenities in Rochester Hills that guests expect include: Air conditioning, Smoke alarm, Washer, Dryer, Wifi, Free parking on premises, Essentials, Heating, Hangers, Hot water. Lacking these (any) could significantly impact bookings.
Recommendations for Hosts
- Ensure your listing includes all essential amenities for Rochester Hills: Air conditioning, Smoke alarm, Washer, Dryer, Wifi, Free parking on premises, Essentials, Heating, Hangers, Hot water.
- Prioritize adding missing essentials: Heating, Hangers, Hot water.
- Highlight unique or less common amenities you offer (e.g., hot tub, dedicated workspace, EV charger) in your listing description and photos.
- Regularly check competitor amenities in Rochester Hills to stay competitive.
Rochester Hills Airbnb Guest Demographics & Profile Analysis (2026)
Guest Profile Summary for Rochester Hills
- The typical guest profile for Airbnb in Rochester Hills consists of primarily domestic travelers (89%), often arriving from nearby Phoenix, typically belonging to the Post-2000s (Gen Z/Alpha) group (50%), primarily speaking English or Spanish.
- Domestic travelers account for 88.5% of guests.
- Key international markets include United States (88.5%) and Canada (2.6%).
- Top languages spoken are English (64.4%) followed by Spanish (6.7%).
- A significant demographic segment is the Post-2000s (Gen Z/Alpha) group, representing 50% of guests.
Recommendations for Hosts
- Target domestic marketing efforts towards travelers from Phoenix and Troy.
- Tailor amenities and listing descriptions to appeal to the dominant Post-2000s (Gen Z/Alpha) demographic (e.g., highlight fast WiFi, smart home features, local guides).
- Highlight unique local experiences or amenities relevant to the primary guest profile.
- Consider seasonal promotions aligned with peak travel times for key origin markets.
Nearby Short-Term Rental Market Comparison
How does the Rochester Hills Airbnb market stack up against its neighbors? Compare key performance metrics like average monthly revenue, ADR, and occupancy rates in surrounding areas to understand the broader regional STR landscape.
| Market | Active Properties | Monthly Revenue | Daily Rate | Avg. Occupancy |
|---|---|---|---|---|
| Scio Township | 18 | $5,101 | $764.17 | 43% |
| Huron Township | 17 | $5,053 | $484.21 | 40% |
| Forester | 12 | $4,952 | $407.81 | 39% |
| City of Frankenmuth | 31 | $4,860 | $320.28 | 51% |
| Port Sanilac | 32 | $4,603 | $470.83 | 37% |
| Marblehead | 12 | $4,522 | $595.67 | 39% |
| Grass Lake Charter Township | 14 | $4,410 | $365.88 | 45% |
| Ann Arbor | 487 | $4,080 | $443.76 | 43% |
| Erie Township | 10 | $3,857 | $246.01 | 51% |
| Huron | 127 | $3,854 | $378.44 | 41% |