Park Township Airbnb Market Analysis 2026: Short Term Rental Data & Vacation Rental Statistics in Michigan, United States
Is Airbnb profitable in Park Township in 2026? Explore comprehensive Airbnb analytics for Park Township, Michigan, United States to uncover income potential. This 2026 STR market report for Park Township, based on AirROI data from February 2025 to January 2026, reveals key trends in the niche market of 84 active listings.
Whether you're considering an Airbnb investment in Park Township, optimizing your existing vacation rental, or exploring rental arbitrage opportunities, understanding the Park Township Airbnb data is crucial. Leveraging the low regulation environment is key to maximizing your short term rental income potential. Let's dive into the specifics.
Key Park Township Airbnb Performance Metrics Overview
Monthly Airbnb Revenue Variations & Income Potential in Park Township (2026)
Understanding the monthly revenue variations for Airbnb listings in Park Township is key to maximizing your short term rental income potential. Seasonality significantly impacts earnings. Our analysis, based on data from the past 12 months, shows that the peak revenue month for STRs in Park Township is typically July, while January often presents the lowest earnings, highlighting opportunities for strategic pricing adjustments during shoulder and low seasons. Explore the typical Airbnb income in Park Township across different performance tiers:
- Best-in-class properties (Top 10%) achieve $10,311+ monthly, often utilizing dynamic pricing and superior guest experiences.
- Strong performing properties (Top 25%) earn $7,177 or more, indicating effective management and desirable locations/amenities.
- Typical properties (Median) generate around $4,682 per month, representing the average market performance.
- Entry-level properties (Bottom 25%) see earnings around $2,440, often with potential for optimization.
Average Monthly Airbnb Earnings Trend in Park Township
Park Township Airbnb Occupancy Rate Trends (2026)
Maximize your bookings by understanding the Park Township STR occupancy trends. Seasonal demand shifts significantly influence how often properties are booked. Typically, Julysees the highest demand (peak season occupancy), while January experiences the lowest (low season). Effective strategies, like adjusting minimum stays or offering promotions, can boost occupancy during slower periods. Here's how different property tiers perform in Park Township:
- Best-in-class properties (Top 10%) achieve 75%+ occupancy, indicating high desirability and potentially optimized availability.
- Strong performing properties (Top 25%) maintain 60% or higher occupancy, suggesting good market fit and guest satisfaction.
- Typical properties (Median) have an occupancy rate around 43%.
- Entry-level properties (Bottom 25%) average 25% occupancy, potentially facing higher vacancy.
Average Monthly Occupancy Rate Trend in Park Township
Average Daily Rate (ADR) Airbnb Trends in Park Township (2026)
Effective short term rental pricing strategy in Park Township involves understanding monthly ADR fluctuations. The Average Daily Rate (ADR) for Airbnb in Park Township typically peaks in July and dips lowest during February. Leveraging Airbnb dynamic pricing tools or strategies based on this seasonality can significantly boost revenue. Here's a look at the typical nightly rates achieved:
- Best-in-class properties (Top 10%) command rates of $670+ per night, often due to premium features or locations.
- Strong performing properties (Top 25%) achieve nightly rates of $464 or more.
- Typical properties (Median) charge around $331 per night.
- Entry-level properties (Bottom 25%) earn around $222 per night.
Average Daily Rate (ADR) Trend by Month in Park Township
Get Live Park Township Market Intelligence 👇

Explore Real-time Analytics
Airbnb Seasonality Analysis & Trends in Park Township (2026)
Peak Season (July, August, June)
- Revenue averages $10,235 per month
- Occupancy rates average 63.9%
- Daily rates average $454
Shoulder Season
- Revenue averages $4,635 per month
- Occupancy maintains around 38.7%
- Daily rates hold near $381
Low Season (January, February, March)
- Revenue drops to average $2,533 per month
- Occupancy decreases to average 31.4%
- Daily rates adjust to average $355
Seasonality Insights for Park Township
- The Airbnb seasonality in Park Township shows highly seasonal trends requiring careful strategy. While the sections above show seasonal averages, it's also insightful to look at the extremes:
- During the high season, the absolute peak month showcases Park Township's highest earning potential, with monthly revenues capable of climbing to $12,251, occupancy reaching a high of 71.3%, and ADRs peaking at $464.
- Conversely, the slowest single month of the year, typically falling within the low season, marks the market's lowest point. In this month, revenue might dip to $2,211, occupancy could drop to 20.7%, and ADRs may adjust down to $354.
- Understanding both the seasonal averages and these monthly peaks and troughs in revenue, occupancy, and ADR is crucial for maximizing your Airbnb profit potential in Park Township.
Seasonal Strategies for Maximizing Profit
- Peak Season: Maximize revenue through premium pricing and potentially longer minimum stays. Ensure high availability.
- Low Season: Offer competitive pricing, special promotions (e.g., extended stay discounts), and flexible cancellation policies. Target off-season travelers like remote workers or budget-conscious guests.
- Shoulder Seasons: Implement dynamic pricing that balances peak and low rates. Target weekend travelers or specific events. Offer slightly more flexible terms than peak season.
- Regularly analyze your own performance against these Park Township seasonality benchmarks and adjust your pricing and availability strategy accordingly.
Best Areas for Airbnb Investment in Park Township (2026)
Exploring the top neighborhoods for short-term rentals in Park Township? This section highlights key areas, outlining why they are attractive for hosts and guests, along with notable local attractions. Consider these locations based on your target guest profile and investment strategy.
| Neighborhood / Area | Why Host Here? (Target Guests & Appeal) | Key Attractions & Landmarks |
|---|---|---|
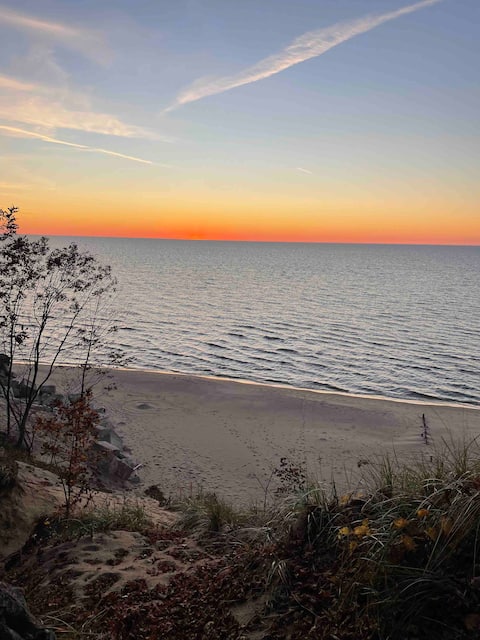
| Lake Michigan Shoreline | Beautiful waterfront area popular for beach vacations and summer getaways. Attracts families and outdoor enthusiasts looking for a relaxing retreat. | Lake Michigan Beaches, Mount Baldhead, Saugatuck Dunes State Park, Oval Beach, Downtown Saugatuck |
| Holland State Park | Famous for its stunning lighthouse and beaches, ideal for summer tourism and outdoor activities. Attracts visitors during the tulip festival and summer beach season. | Big Red Lighthouse, Holland State Park Beach, Lake Macatawa, Windmill Island Gardens, Tulip Time Festival |
| Downtown Holland | Vibrant downtown area with shops, restaurants, and cultural attractions. Popular for travelers seeking local dining and a historic atmosphere. | Holland Museum, Windmill Island Gardens, Shopping on 8th Street, Local breweries and cafes |
| St. Joseph | Charming town with beautiful beaches and a vibrant downtown. A great spot for families and those looking to enjoy beach life and local attractions. | Silver Beach County Park, St. Joseph Lighthouse, Tiscornia Park, Historic Arts District |
| Grand Haven | Known for its picturesque waterfront and vibrant boardwalk, this location attracts summer tourists looking for fun in the sun and water activities. | Grand Haven State Park, Grand Haven Pier and Lighthouse, Boardwalk attractions, Lake Michigan beaches |
| Saugatuck | Artistic community with galleries, shops, and access to beautiful natural landscapes. Attracts those looking for culture and outdoor activities. | Saugatuck Dunes State Park, Downtown Saugatuck galleries, Boat rentals and sightseeing, Oval Beach |
| South Haven | Historic beach town with charming shops, a beautiful harbor, and great local food. Popular among beachgoers and boating enthusiasts. | South Haven Lighthouse, South Beach, Kal-Haven Trail, Local wineries and farms |
| Kalamazoo | Growing cultural hub with a strong craft beer scene and unique local attractions. Draws those interested in exploring a vibrant city atmosphere. | Kalamazoo Institute of Arts, Bell's Brewery, Kalamazoo Nature Center, Air Zoo Aerospace & Science Museum |
Understanding Airbnb License Requirements & STR Laws in Park Township (2026)
While Park Township, Michigan, United States currently shows low STR regulations, specific Airbnb license requirements might still exist or change. Always verify the latest short term rental regulations and Airbnb license requirements directly with local government authorities for Park Township to ensure full compliance before hosting.
(Source: AirROI data, 2026, based on 1% licensed listings)
Top Performing Airbnb Properties in Park Township (2026)
Benchmark your potential! Explore examples of top-performing Airbnb properties in Park Townshipbased on Trailing Twelve Month (TTM) revenue. Analyze their characteristics, revenue, occupancy rate, and ADR to understand what drives success in this market.
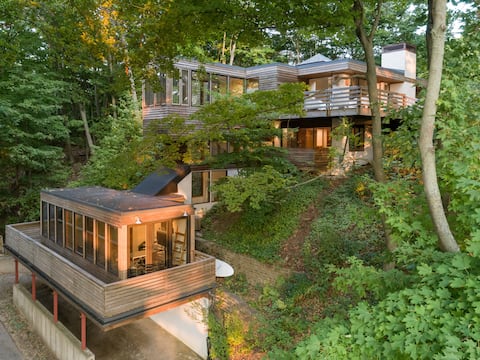
Huge Mid Century Beach Home w/Beach Access
Entire Place • 6 bedrooms
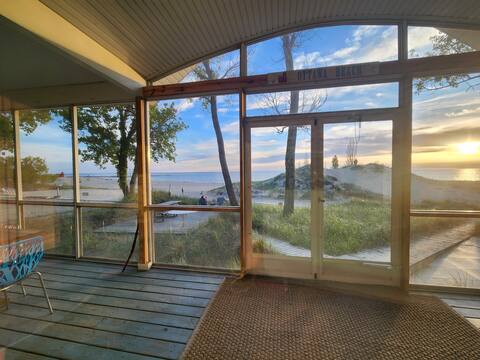
Zero steps to the beach, On Lake Michigan
Entire Place • 5 bedrooms

Boutique 5br Retreat Sleeps 15 | Pool, Hot Tub, Fr
Entire Place • 5 bedrooms

Macatawa Lake Side Cottage
Entire Place • 4 bedrooms
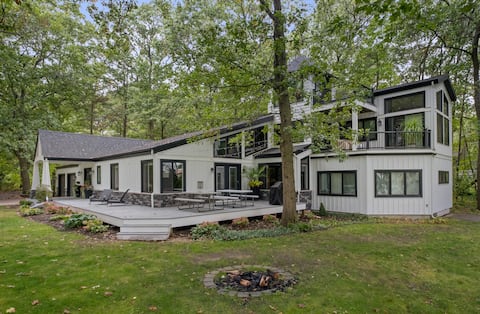
Spacious Home on Large Lot Near Lake Michigan
Entire Place • 5 bedrooms
Spacious Home across Lake Michigan w/ Pool!
Entire Place • 6 bedrooms
Note: Performance varies based on location, size, amenities, seasonality, and management quality. Data reflects the past 12 months.
Top Performing Airbnb Hosts in Park Township (2026)
Learn from the best! This table showcases top-performing Airbnb hosts in Park Township based on the number of properties managed and estimated total revenue over the past year. Analyze their scale and performance metrics.
| Host Name | Properties | Grossing Revenue | Stay Reviews | Avg Rating |
|---|---|---|---|---|
| Harriet | 6 | $386,767 | 1571 | 4.91/5.0 |
| Beth | 3 | $340,443 | 246 | 4.93/5.0 |
| BVW Unsalted | 3 | $265,101 | 20 | 4.75/5.0 |
| Sterling Sands | 5 | $244,633 | 15 | 4.92/5.0 |
| The Lakeshore Life | 3 | $167,268 | 60 | 4.79/5.0 |
| Phoebe N Baitao Thecyandoor.Co | 2 | $146,618 | 300 | 4.93/5.0 |
| Rich | 4 | $129,955 | 384 | 4.86/5.0 |
| Scott | 2 | $129,837 | 146 | 4.92/5.0 |
| Jerome And Julie | 1 | $106,103 | 122 | 4.97/5.0 |
| Jorge | 1 | $96,562 | 8 | 4.50/5.0 |
Analyzing the strategies of top hosts, such as their property selection, pricing, and guest communication, can offer valuable lessons for optimizing your own Airbnb operations in Park Township.
Dive Deeper: Advanced Park Township STR Market Data (2026)
Ready to unlock more insights? AirROI provides access to advanced metrics and comprehensive Airbnb data for Park Township. Explore detailed analytics beyond this report to refine your investment strategy, optimize pricing, and maximize your vacation rental profits.
Explore Advanced MetricsPark Township Short-Term Rental Market Composition (2026): Property & Room Types
Room Type Distribution
Property Type Distribution
Market Composition Insights for Park Township
- The Park Township Airbnb market composition is heavily skewed towards Entire Home/Apt listings, which make up 97.6% of the 84 active rentals. This indicates strong guest preference for privacy and space.
- Looking at the property type distribution in Park Township, House properties are the most common (89.3%), reflecting the local real estate landscape.
- Houses represent a significant 89.3% portion, catering likely to families or larger groups.
- Smaller segments like apartment/condo, hotel/boutique, others, outdoor/unique (combined 10.8%) offer potential for unique stay experiences.
Park Township Airbnb Room Capacity Analysis (2026): Bedroom Distribution
Distribution of Listings by Number of Bedrooms
Room Capacity Insights for Park Township
- The dominant room capacity in Park Township is 3 bedrooms listings, making up 33.3% of the market. This suggests a strong demand for properties suitable for families or small groups.
- Together, 3 bedrooms and 4 bedrooms properties represent 64.3% of the active Airbnb listings in Park Township, indicating a high concentration in these sizes.
- A significant 81.0% of listings offer 3+ bedrooms, catering to larger groups and families seeking more space in Park Township.
Park Township Vacation Rental Guest Capacity Trends (2026)
Distribution of Listings by Guest Capacity
Guest Capacity Insights for Park Township
- The most common guest capacity trend in Park Township vacation rentals is listings accommodating 8+ guests (66.7%). This suggests the primary traveler segment is likely larger groups.
- Properties designed for 8+ guests and 6 guests dominate the Park Township STR market, accounting for 82.2% of listings.
- 87.0% of properties accommodate 6+ guests, serving the market segment for larger families or group travel in Park Township.
- On average, properties in Park Township are equipped to host 7.1 guests.
Park Township Airbnb Booking Patterns (2026): Available vs. Booked Days
Available Days Distribution
Booked Days Distribution
Booking Pattern Insights for Park Township
- The most common availability pattern in Park Township falls within the 181-270 days range, representing 46.4% of listings. This suggests many properties have significant open periods on their calendars.
- Approximately 82.1% of listings show high availability (181+ days open annually), indicating potential for increased bookings or specific owner usage patterns.
- For booked days, the 91-180 days range is most frequent in Park Township (45.2%), reflecting common guest stay durations or potential owner blocking patterns.
- A notable 19.1% of properties secure long booking periods (181+ days booked per year), highlighting successful long-term rental strategies or significant owner usage.
Park Township Airbnb Minimum Stay Requirements Analysis
Distribution of Listings by Minimum Night Requirement
1 Night
6 listings
7.1% of total
2 Nights
8 listings
9.5% of total
3 Nights
3 listings
3.6% of total
4-6 Nights
13 listings
15.5% of total
7-29 Nights
29 listings
34.5% of total
30+ Nights
25 listings
29.8% of total
Key Insights
- The most prevalent minimum stay requirement in Park Township is 7-29 Nights, adopted by 34.5% of listings. This highlights the market's preference for shorter, flexible bookings.
- Very short stays (1-2 nights) are less common (16.6%), suggesting hosts prefer slightly longer bookings to optimize turnover.
- A significant segment (29.8%) caters to monthly stays (30+ nights) in Park Township, pointing to opportunities in the extended-stay market.
Recommendations
- Align with the market by considering a 7-29 Nights minimum stay, as 34.5% of Park Township hosts use this setting.
- If feasible, allowing 1-night stays, especially midweek or during low season, could capture last-minute bookings, as only 7.1% currently do.
- Explore offering discounts for stays of 30+ nights to attract the 29.8% of the market seeking extended stays.
- Adjust minimum nights based on seasonality – potentially shorter during low season and longer during peak demand periods in Park Township.
Park Township Airbnb Cancellation Policy Trends Analysis (2026)
Super Strict 30 Days
8 listings
9.5% of total
Limited
1 listings
1.2% of total
Super Strict 60 Days
3 listings
3.6% of total
Flexible
9 listings
10.7% of total
Moderate
12 listings
14.3% of total
Firm
28 listings
33.3% of total
Strict
23 listings
27.4% of total
Cancellation Policy Insights for Park Township
- The prevailing Airbnb cancellation policy trend in Park Township is Firm, used by 33.3% of listings.
- A majority (60.7%) of hosts in Park Township utilize Firm or Strict policies, indicating a market where hosts prioritize booking security.
Recommendations for Hosts
- Consider adopting a Firm policy to align with the 33.3% market standard in Park Township.
- Regularly review your cancellation policy against competitors and market demand shifts in Park Township.
Park Township STR Booking Lead Time Analysis (2026)
Average Booking Lead Time by Month
Booking Lead Time Insights for Park Township
- The overall average booking lead time for vacation rentals in Park Township is 78 days.
- Guests book furthest in advance for stays during July (average 131 days), likely coinciding with peak travel demand or local events.
- The shortest booking windows occur for stays in January (average 30 days), indicating more last-minute travel plans during this time.
- Seasonally, Summer (128 days avg.) sees the longest lead times, while Winter (38 days avg.) has the shortest, reflecting typical travel planning cycles.
Recommendations for Hosts
- Use the overall average lead time (78 days) as a baseline for your pricing and availability strategy in Park Township.
- For July stays, consider implementing length-of-stay discounts or slightly higher rates for bookings made less than 131 days out to capitalize on advance planning.
- Target marketing efforts for the Summer season well in advance (at least 128 days) to capture early planners.
- Monitor your own booking lead times against these Park Township averages to identify opportunities for dynamic pricing adjustments.
Popular & Essential Airbnb Amenities in Park Township (2026)
Amenity Prevalence
Amenity Insights for Park Township
- Essential amenities in Park Township that guests expect include: TV, Wifi, Kitchen, Smoke alarm, Free parking on premises, Refrigerator, Air conditioning, Heating, Coffee maker, Dishes and silverware. Lacking these (any) could significantly impact bookings.
Recommendations for Hosts
- Ensure your listing includes all essential amenities for Park Township: TV, Wifi, Kitchen, Smoke alarm, Free parking on premises, Refrigerator, Air conditioning, Heating, Coffee maker, Dishes and silverware.
- Prioritize adding missing essentials: Wifi, Kitchen, Smoke alarm, Free parking on premises, Refrigerator, Air conditioning, Heating, Coffee maker, Dishes and silverware.
- Highlight unique or less common amenities you offer (e.g., hot tub, dedicated workspace, EV charger) in your listing description and photos.
- Regularly check competitor amenities in Park Township to stay competitive.
Park Township Airbnb Guest Demographics & Profile Analysis (2026)
Guest Profile Summary for Park Township
- The typical guest profile for Airbnb in Park Township consists of primarily domestic travelers (98%), often arriving from nearby Chicago, typically belonging to the Post-2000s (Gen Z/Alpha) group (50%), primarily speaking English or Spanish.
- Domestic travelers account for 98.1% of guests.
- Key international markets include United States (98.1%) and Canada (0.4%).
- Top languages spoken are English (75.3%) followed by Spanish (9.5%).
- A significant demographic segment is the Post-2000s (Gen Z/Alpha) group, representing 50% of guests.
Recommendations for Hosts
- Target domestic marketing efforts towards travelers from Chicago and Ann Arbor.
- Tailor amenities and listing descriptions to appeal to the dominant Post-2000s (Gen Z/Alpha) demographic (e.g., highlight fast WiFi, smart home features, local guides).
- Highlight unique local experiences or amenities relevant to the primary guest profile.
- Consider seasonal promotions aligned with peak travel times for key origin markets.
Nearby Short-Term Rental Market Comparison
How does the Park Township Airbnb market stack up against its neighbors? Compare key performance metrics like average monthly revenue, ADR, and occupancy rates in surrounding areas to understand the broader regional STR landscape.
| Market | Active Properties | Monthly Revenue | Daily Rate | Avg. Occupancy |
|---|---|---|---|---|
| Laketown Township | 59 | $6,112 | $529.59 | 44% |
| Port Sheldon Township | 26 | $6,015 | $566.98 | 47% |
| Ganges Township | 69 | $5,687 | $636.25 | 38% |
| Saugatuck Township | 141 | $5,627 | $508.58 | 43% |
| Paw Paw Township | 10 | $5,458 | $418.85 | 49% |
| New Buffalo Township | 260 | $5,145 | $633.18 | 36% |
| Bertrand Township | 22 | $5,011 | $365.69 | 40% |
| Union Pier | 16 | $4,998 | $659.10 | 36% |
| Fremont | 16 | $4,898 | $436.31 | 42% |
| Grattan Township | 16 | $4,890 | $353.91 | 56% |