Niles Airbnb Market Analysis 2026: Short Term Rental Data & Vacation Rental Statistics in Michigan, United States
Is Airbnb profitable in Niles in 2026? Explore comprehensive Airbnb analytics for Niles, Michigan, United States to uncover income potential. This 2026 STR market report for Niles, based on AirROI data from February 2025 to January 2026, reveals key trends in the niche market of 31 active listings.
Whether you're considering an Airbnb investment in Niles, optimizing your existing vacation rental, or exploring rental arbitrage opportunities, understanding the Niles Airbnb data is crucial. Leveraging the low regulation environment is key to maximizing your short term rental income potential. Let's dive into the specifics.
Key Niles Airbnb Performance Metrics Overview
Monthly Airbnb Revenue Variations & Income Potential in Niles (2026)
Understanding the monthly revenue variations for Airbnb listings in Niles is key to maximizing your short term rental income potential. Seasonality significantly impacts earnings. Our analysis, based on data from the past 12 months, shows that the peak revenue month for STRs in Niles is typically July, while January often presents the lowest earnings, highlighting opportunities for strategic pricing adjustments during shoulder and low seasons. Explore the typical Airbnb income in Niles across different performance tiers:
- Best-in-class properties (Top 10%) achieve $3,981+ monthly, often utilizing dynamic pricing and superior guest experiences.
- Strong performing properties (Top 25%) earn $3,286 or more, indicating effective management and desirable locations/amenities.
- Typical properties (Median) generate around $2,170 per month, representing the average market performance.
- Entry-level properties (Bottom 25%) see earnings around $1,436, often with potential for optimization.
Average Monthly Airbnb Earnings Trend in Niles
Niles Airbnb Occupancy Rate Trends (2026)
Maximize your bookings by understanding the Niles STR occupancy trends. Seasonal demand shifts significantly influence how often properties are booked. Typically, Julysees the highest demand (peak season occupancy), while December experiences the lowest (low season). Effective strategies, like adjusting minimum stays or offering promotions, can boost occupancy during slower periods. Here's how different property tiers perform in Niles:
- Best-in-class properties (Top 10%) achieve 88%+ occupancy, indicating high desirability and potentially optimized availability.
- Strong performing properties (Top 25%) maintain 75% or higher occupancy, suggesting good market fit and guest satisfaction.
- Typical properties (Median) have an occupancy rate around 52%.
- Entry-level properties (Bottom 25%) average 30% occupancy, potentially facing higher vacancy.
Average Monthly Occupancy Rate Trend in Niles
Average Daily Rate (ADR) Airbnb Trends in Niles (2026)
Effective short term rental pricing strategy in Niles involves understanding monthly ADR fluctuations. The Average Daily Rate (ADR) for Airbnb in Niles typically peaks in October and dips lowest during February. Leveraging Airbnb dynamic pricing tools or strategies based on this seasonality can significantly boost revenue. Here's a look at the typical nightly rates achieved:
- Best-in-class properties (Top 10%) command rates of $278+ per night, often due to premium features or locations.
- Strong performing properties (Top 25%) achieve nightly rates of $188 or more.
- Typical properties (Median) charge around $136 per night.
- Entry-level properties (Bottom 25%) earn around $101 per night.
Average Daily Rate (ADR) Trend by Month in Niles
Get Live Niles Market Intelligence 👇

Explore Real-time Analytics
Airbnb Seasonality Analysis & Trends in Niles (2026)
Peak Season (July, September, June)
- Revenue averages $2,950 per month
- Occupancy rates average 60.4%
- Daily rates average $165
Shoulder Season
- Revenue averages $2,446 per month
- Occupancy maintains around 50.7%
- Daily rates hold near $195
Low Season (January, February, March)
- Revenue drops to average $1,934 per month
- Occupancy decreases to average 48.8%
- Daily rates adjust to average $161
Seasonality Insights for Niles
- The Airbnb seasonality in Niles shows moderate seasonality with distinct peak and low periods. While the sections above show seasonal averages, it's also insightful to look at the extremes:
- During the high season, the absolute peak month showcases Niles's highest earning potential, with monthly revenues capable of climbing to $3,227, occupancy reaching a high of 64.6%, and ADRs peaking at $248.
- Conversely, the slowest single month of the year, typically falling within the low season, marks the market's lowest point. In this month, revenue might dip to $1,883, occupancy could drop to 40.6%, and ADRs may adjust down to $130.
- Understanding both the seasonal averages and these monthly peaks and troughs in revenue, occupancy, and ADR is crucial for maximizing your Airbnb profit potential in Niles.
Seasonal Strategies for Maximizing Profit
- Peak Season: Maximize revenue through premium pricing and potentially longer minimum stays. Ensure high availability.
- Low Season: Offer competitive pricing, special promotions (e.g., extended stay discounts), and flexible cancellation policies. Target off-season travelers like remote workers or budget-conscious guests.
- Shoulder Seasons: Implement dynamic pricing that balances peak and low rates. Target weekend travelers or specific events. Offer slightly more flexible terms than peak season.
- Regularly analyze your own performance against these Niles seasonality benchmarks and adjust your pricing and availability strategy accordingly.
Best Areas for Airbnb Investment in Niles (2026)
Exploring the top neighborhoods for short-term rentals in Niles? This section highlights key areas, outlining why they are attractive for hosts and guests, along with notable local attractions. Consider these locations based on your target guest profile and investment strategy.
| Neighborhood / Area | Why Host Here? (Target Guests & Appeal) | Key Attractions & Landmarks |
|---|---|---|
| Downtown Niles | The heart of Niles, featuring local shops, restaurants, and events. A central spot for tourists and locals, making it ideal for short-term rentals. | Niles Riverfront Park, Niles Historical Museum, Hollyhock House, Italian Festival, Downtown Farmers Market |
| Lake Michigan Shores | A picturesque area along Lake Michigan, perfect for beach lovers and water activities. Attracts families and those looking for a serene getaway. | Silver Beach County Park, Warren Dunes State Park, Lake Michigan, New Buffalo Beach, Minnie A. H. J. Lake |
| Niles Community Park | A local favorite with plenty of outdoor activities and green spaces, great for families seeking short escapes to nature. | Niles Community Park, Ball fields, Playgrounds, Walking trails, Picnic areas |
| Buchanan | Nearby Buchanan offers a cozy small-town charm with its own attractions and festivals, drawing visitors from around the region. | Buchanan Art Center, Redbud Trail, Wine country tours, Local craft shops, Annual Buchanan community events |
| Galien | A tranquil and scenic area close to nature; ideal for those looking for hiking and outdoor experiences, appealing to nature enthusiasts. | Galien River County Park, Hiking trails, Wildlife observation, Picnic areas |
| Three Oaks | Just a short drive from Niles, this charming village offers unique shops, dining, and cultural experiences, making it attractive to visitors. | The Acorn Theater, Three Oaks Artisan Market, Local wineries, Shops in downtown Three Oaks, Outdoor concerts |
| Southwest Michigan Wine Country | Famous for its wineries and vineyards, this area attracts wine enthusiasts and those looking for picturesque scenery. | Wineries and tasting rooms, Scenic drives, Wine and food festivals, Harvest events, Lake views |
| Union Pier | A coastal village popular with tourists for its beaches and vacation homes, great for summertime rentals and family getaways. | Union Pier Beach, Local shops and dining, Art galleries, Community events, Beaches along Lake Michigan |
Understanding Airbnb License Requirements & STR Laws in Niles (2026)
While Niles, Michigan, United States currently shows low STR regulations, specific Airbnb license requirements might still exist or change. Always verify the latest short term rental regulations and Airbnb license requirements directly with local government authorities for Niles to ensure full compliance before hosting.
(Source: AirROI data, 2026, finding no licensed listings among those analyzed)
Top Performing Airbnb Properties in Niles (2026)
Benchmark your potential! Explore examples of top-performing Airbnb properties in Nilesbased on Trailing Twelve Month (TTM) revenue. Analyze their characteristics, revenue, occupancy rate, and ADR to understand what drives success in this market.
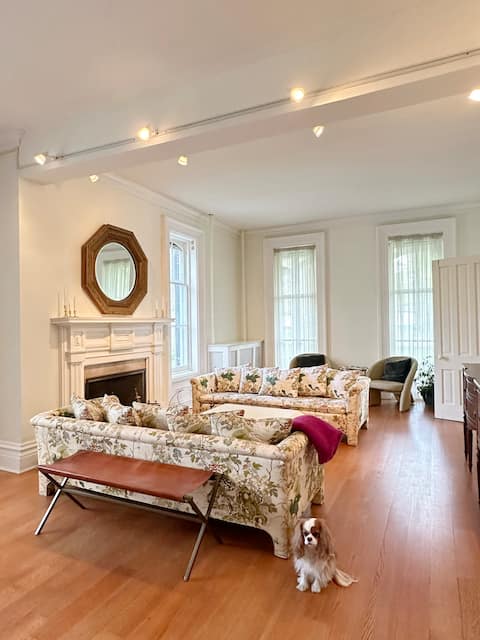
Breathtaking Historic Home easy drive to the Lake!
Entire Place • 4 bedrooms

Rivers Edge Lofts - Unit 10
Entire Place • 2 bedrooms
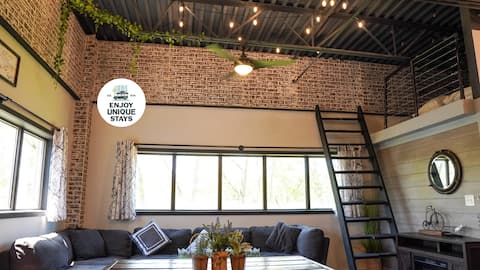
Rivers Edge Lofts - Unit 6
Entire Place • 3 bedrooms

Riverwalk Retreat on Main, fully updated Victorian
Entire Place • 5 bedrooms
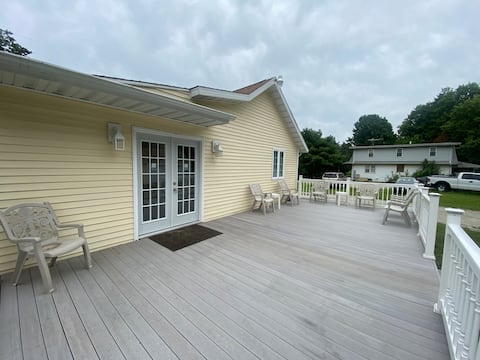
The Yellow House
Entire Place • 4 bedrooms

Riverside Retreat! Walk to Downtown, YMCA, Fishing
Entire Place • 2 bedrooms
Note: Performance varies based on location, size, amenities, seasonality, and management quality. Data reflects the past 12 months.
Top Performing Airbnb Hosts in Niles (2026)
Learn from the best! This table showcases top-performing Airbnb hosts in Niles based on the number of properties managed and estimated total revenue over the past year. Analyze their scale and performance metrics.
| Host Name | Properties | Grossing Revenue | Stay Reviews | Avg Rating |
|---|---|---|---|---|
| Enjoy Unique Stays | 10 | $333,250 | 1416 | 4.78/5.0 |
| Ryan | 2 | $65,123 | 63 | 4.89/5.0 |
| Nancy | 1 | $46,976 | 66 | 4.91/5.0 |
| Jane | 1 | $42,940 | 212 | 4.97/5.0 |
| Carla | 1 | $42,666 | 39 | 4.82/5.0 |
| Heather | 2 | $35,266 | 79 | 4.63/5.0 |
| Teri | 1 | $30,110 | 53 | 5.00/5.0 |
| Tad | 2 | $27,969 | 84 | 4.95/5.0 |
| Harry | 1 | $24,188 | 186 | 4.98/5.0 |
| Kelly | 1 | $23,132 | 144 | 4.89/5.0 |
Analyzing the strategies of top hosts, such as their property selection, pricing, and guest communication, can offer valuable lessons for optimizing your own Airbnb operations in Niles.
Dive Deeper: Advanced Niles STR Market Data (2026)
Ready to unlock more insights? AirROI provides access to advanced metrics and comprehensive Airbnb data for Niles. Explore detailed analytics beyond this report to refine your investment strategy, optimize pricing, and maximize your vacation rental profits.
Explore Advanced MetricsNiles Short-Term Rental Market Composition (2026): Property & Room Types
Room Type Distribution
Property Type Distribution
Market Composition Insights for Niles
- The Niles Airbnb market composition is heavily skewed towards Entire Home/Apt listings, which make up 96.8% of the 31 active rentals. This indicates strong guest preference for privacy and space.
- Looking at the property type distribution in Niles, Apartment/Condo properties are the most common (58.1%), reflecting the local real estate landscape.
- Houses represent a significant 29% portion, catering likely to families or larger groups.
- Smaller segments like others (combined 3.2%) offer potential for unique stay experiences.
Niles Airbnb Room Capacity Analysis (2026): Bedroom Distribution
Distribution of Listings by Number of Bedrooms
Room Capacity Insights for Niles
- The dominant room capacity in Niles is 1 bedroom listings, making up 32.3% of the market. This suggests a strong demand for properties suitable for couples or solo travelers.
- Together, 1 bedroom and 2 bedrooms properties represent 54.9% of the active Airbnb listings in Niles, indicating a high concentration in these sizes.
- A significant 29.1% of listings offer 3+ bedrooms, catering to larger groups and families seeking more space in Niles.
Niles Vacation Rental Guest Capacity Trends (2026)
Distribution of Listings by Guest Capacity
Guest Capacity Insights for Niles
- The most common guest capacity trend in Niles vacation rentals is listings accommodating 8+ guests (29%). This suggests the primary traveler segment is likely larger groups.
- Properties designed for 8+ guests and 4 guests dominate the Niles STR market, accounting for 54.8% of listings.
- 38.7% of properties accommodate 6+ guests, serving the market segment for larger families or group travel in Niles.
- On average, properties in Niles are equipped to host 4.9 guests.
Niles Airbnb Booking Patterns (2026): Available vs. Booked Days
Available Days Distribution
Booked Days Distribution
Booking Pattern Insights for Niles
- The most common availability pattern in Niles falls within the 91-180 days range, representing 48.4% of listings. This suggests many properties have significant open periods on their calendars.
- Approximately 45.2% of listings show high availability (181+ days open annually), indicating potential for increased bookings or specific owner usage patterns.
- For booked days, the 181-270 days range is most frequent in Niles (45.2%), reflecting common guest stay durations or potential owner blocking patterns.
- A notable 54.9% of properties secure long booking periods (181+ days booked per year), highlighting successful long-term rental strategies or significant owner usage.
Niles Airbnb Minimum Stay Requirements Analysis
Distribution of Listings by Minimum Night Requirement
1 Night
11 listings
35.5% of total
2 Nights
10 listings
32.3% of total
4-6 Nights
3 listings
9.7% of total
30+ Nights
7 listings
22.6% of total
Key Insights
- The most prevalent minimum stay requirement in Niles is 1 Night, adopted by 35.5% of listings. This highlights the market's preference for shorter, flexible bookings.
- A strong majority (67.8%) of the Niles Airbnb data shows acceptance of very short stays (1-2 nights), indicating a dynamic, high-turnover market.
- A significant segment (22.6%) caters to monthly stays (30+ nights) in Niles, pointing to opportunities in the extended-stay market.
Recommendations
- Align with the market by considering a 1 Night minimum stay, as 35.5% of Niles hosts use this setting.
- Explore offering discounts for stays of 30+ nights to attract the 22.6% of the market seeking extended stays.
- Adjust minimum nights based on seasonality – potentially shorter during low season and longer during peak demand periods in Niles.
Niles Airbnb Cancellation Policy Trends Analysis (2026)
Limited
2 listings
6.5% of total
Super Strict 30 Days
1 listings
3.2% of total
Flexible
4 listings
12.9% of total
Moderate
7 listings
22.6% of total
Firm
8 listings
25.8% of total
Strict
9 listings
29% of total
Cancellation Policy Insights for Niles
- The prevailing Airbnb cancellation policy trend in Niles is Strict, used by 29% of listings.
- A majority (54.8%) of hosts in Niles utilize Firm or Strict policies, indicating a market where hosts prioritize booking security.
Recommendations for Hosts
- Consider adopting a Strict policy to align with the 29% market standard in Niles.
- Regularly review your cancellation policy against competitors and market demand shifts in Niles.
Niles STR Booking Lead Time Analysis (2026)
Average Booking Lead Time by Month
Booking Lead Time Insights for Niles
- The overall average booking lead time for vacation rentals in Niles is 36 days.
- Guests book furthest in advance for stays during October (average 78 days), likely coinciding with peak travel demand or local events.
- The shortest booking windows occur for stays in April (average 11 days), indicating more last-minute travel plans during this time.
- Seasonally, Fall (66 days avg.) sees the longest lead times, while Winter (12 days avg.) has the shortest, reflecting typical travel planning cycles.
Recommendations for Hosts
- Use the overall average lead time (36 days) as a baseline for your pricing and availability strategy in Niles.
- For October stays, consider implementing length-of-stay discounts or slightly higher rates for bookings made less than 78 days out to capitalize on advance planning.
- During April, focus on last-minute booking availability and promotions, as guests book with very short notice (11 days avg.).
- Target marketing efforts for the Fall season well in advance (at least 66 days) to capture early planners.
- Monitor your own booking lead times against these Niles averages to identify opportunities for dynamic pricing adjustments.
Popular & Essential Airbnb Amenities in Niles (2026)
Amenity Prevalence
Amenity Insights for Niles
- Popular amenities like Smoke alarm, Hot water, Air conditioning are common but not universal. Offering these can provide a competitive edge.
- Warning: Wifi is not universally provided but is considered essential globally. Ensure reliable Wifi is offered.
Recommendations for Hosts
- Consider adding popular differentiators like Smoke alarm or Hot water to increase appeal.
- Highlight unique or less common amenities you offer (e.g., hot tub, dedicated workspace, EV charger) in your listing description and photos.
- Regularly check competitor amenities in Niles to stay competitive.
Niles Airbnb Guest Demographics & Profile Analysis (2026)
Guest Profile Summary for Niles
- The typical guest profile for Airbnb in Niles consists of primarily domestic travelers (98%), often arriving from nearby Goshen, typically belonging to the Post-2000s (Gen Z/Alpha) group (50%), primarily speaking English or Spanish.
- Domestic travelers account for 98.3% of guests.
- Key international markets include United States (98.3%) and DC (0.6%).
- Top languages spoken are English (70.7%) followed by Spanish (11.7%).
- A significant demographic segment is the Post-2000s (Gen Z/Alpha) group, representing 50% of guests.
Recommendations for Hosts
- Target domestic marketing efforts towards travelers from Goshen and Chicago.
- Tailor amenities and listing descriptions to appeal to the dominant Post-2000s (Gen Z/Alpha) demographic (e.g., highlight fast WiFi, smart home features, local guides).
- Highlight unique local experiences or amenities relevant to the primary guest profile.
- Consider seasonal promotions aligned with peak travel times for key origin markets.
Nearby Short-Term Rental Market Comparison
How does the Niles Airbnb market stack up against its neighbors? Compare key performance metrics like average monthly revenue, ADR, and occupancy rates in surrounding areas to understand the broader regional STR landscape.
| Market | Active Properties | Monthly Revenue | Daily Rate | Avg. Occupancy |
|---|---|---|---|---|
| Laketown Township | 59 | $6,112 | $529.59 | 44% |
| Port Sheldon Township | 26 | $6,015 | $566.98 | 47% |
| Ganges Township | 69 | $5,687 | $636.25 | 38% |
| Saugatuck Township | 141 | $5,627 | $508.58 | 43% |
| Paw Paw Township | 10 | $5,458 | $418.85 | 49% |
| New Buffalo Township | 260 | $5,145 | $633.18 | 36% |
| Bertrand Township | 22 | $5,011 | $365.69 | 40% |
| Union Pier | 16 | $4,998 | $659.10 | 36% |
| Fremont | 16 | $4,898 | $436.31 | 42% |
| Fennville | 34 | $4,874 | $542.47 | 42% |