Lansing Airbnb Market Analysis 2026: Short Term Rental Data & Vacation Rental Statistics in Michigan, United States
Is Airbnb profitable in Lansing in 2026? Explore comprehensive Airbnb analytics for Lansing, Michigan, United States to uncover income potential. This 2026 STR market report for Lansing, based on AirROI data from February 2025 to January 2026, reveals key trends in the market of 263 active listings.
Whether you're considering an Airbnb investment in Lansing, optimizing your existing vacation rental, or exploring rental arbitrage opportunities, understanding the Lansing Airbnb data is crucial. Leveraging the low regulation environment is key to maximizing your short term rental income potential. Let's dive into the specifics.
Key Lansing Airbnb Performance Metrics Overview
Monthly Airbnb Revenue Variations & Income Potential in Lansing (2026)
Understanding the monthly revenue variations for Airbnb listings in Lansing is key to maximizing your short term rental income potential. Seasonality significantly impacts earnings. Our analysis, based on data from the past 12 months, shows that the peak revenue month for STRs in Lansing is typically August, while January often presents the lowest earnings, highlighting opportunities for strategic pricing adjustments during shoulder and low seasons. Explore the typical Airbnb income in Lansing across different performance tiers:
- Best-in-class properties (Top 10%) achieve $4,244+ monthly, often utilizing dynamic pricing and superior guest experiences.
- Strong performing properties (Top 25%) earn $2,763 or more, indicating effective management and desirable locations/amenities.
- Typical properties (Median) generate around $1,590 per month, representing the average market performance.
- Entry-level properties (Bottom 25%) see earnings around $775, often with potential for optimization.
Average Monthly Airbnb Earnings Trend in Lansing
Lansing Airbnb Occupancy Rate Trends (2026)
Maximize your bookings by understanding the Lansing STR occupancy trends. Seasonal demand shifts significantly influence how often properties are booked. Typically, Augustsees the highest demand (peak season occupancy), while January experiences the lowest (low season). Effective strategies, like adjusting minimum stays or offering promotions, can boost occupancy during slower periods. Here's how different property tiers perform in Lansing:
- Best-in-class properties (Top 10%) achieve 84%+ occupancy, indicating high desirability and potentially optimized availability.
- Strong performing properties (Top 25%) maintain 68% or higher occupancy, suggesting good market fit and guest satisfaction.
- Typical properties (Median) have an occupancy rate around 45%.
- Entry-level properties (Bottom 25%) average 25% occupancy, potentially facing higher vacancy.
Average Monthly Occupancy Rate Trend in Lansing
Average Daily Rate (ADR) Airbnb Trends in Lansing (2026)
Effective short term rental pricing strategy in Lansing involves understanding monthly ADR fluctuations. The Average Daily Rate (ADR) for Airbnb in Lansing typically peaks in October and dips lowest during February. Leveraging Airbnb dynamic pricing tools or strategies based on this seasonality can significantly boost revenue. Here's a look at the typical nightly rates achieved:
- Best-in-class properties (Top 10%) command rates of $231+ per night, often due to premium features or locations.
- Strong performing properties (Top 25%) achieve nightly rates of $167 or more.
- Typical properties (Median) charge around $104 per night.
- Entry-level properties (Bottom 25%) earn around $65 per night.
Average Daily Rate (ADR) Trend by Month in Lansing
Get Live Lansing Market Intelligence 👇

Explore Real-time Analytics
Airbnb Seasonality Analysis & Trends in Lansing (2026)
Peak Season (August, July, June)
- Revenue averages $2,485 per month
- Occupancy rates average 56.2%
- Daily rates average $125
Shoulder Season
- Revenue averages $1,974 per month
- Occupancy maintains around 44.5%
- Daily rates hold near $130
Low Season (January, February, April)
- Revenue drops to average $1,627 per month
- Occupancy decreases to average 40.9%
- Daily rates adjust to average $121
Seasonality Insights for Lansing
- The Airbnb seasonality in Lansing shows moderate seasonality with distinct peak and low periods. While the sections above show seasonal averages, it's also insightful to look at the extremes:
- During the high season, the absolute peak month showcases Lansing's highest earning potential, with monthly revenues capable of climbing to $2,607, occupancy reaching a high of 60.2%, and ADRs peaking at $141.
- Conversely, the slowest single month of the year, typically falling within the low season, marks the market's lowest point. In this month, revenue might dip to $1,565, occupancy could drop to 36.6%, and ADRs may adjust down to $113.
- Understanding both the seasonal averages and these monthly peaks and troughs in revenue, occupancy, and ADR is crucial for maximizing your Airbnb profit potential in Lansing.
Seasonal Strategies for Maximizing Profit
- Peak Season: Maximize revenue through premium pricing and potentially longer minimum stays. Ensure high availability.
- Low Season: Offer competitive pricing, special promotions (e.g., extended stay discounts), and flexible cancellation policies. Target off-season travelers like remote workers or budget-conscious guests.
- Shoulder Seasons: Implement dynamic pricing that balances peak and low rates. Target weekend travelers or specific events. Offer slightly more flexible terms than peak season.
- Regularly analyze your own performance against these Lansing seasonality benchmarks and adjust your pricing and availability strategy accordingly.
Best Areas for Airbnb Investment in Lansing (2026)
Exploring the top neighborhoods for short-term rentals in Lansing? This section highlights key areas, outlining why they are attractive for hosts and guests, along with notable local attractions. Consider these locations based on your target guest profile and investment strategy.
| Neighborhood / Area | Why Host Here? (Target Guests & Appeal) | Key Attractions & Landmarks |
|---|---|---|
| Old Town | A historic neighborhood with a charming atmosphere, great restaurants, and local boutiques. Old Town has a vibrant arts scene and hosts community events, making it appealing to both residents and visitors. | Old Town Commercial Association, Eagle Eye Golf Club, Lansing River Trail, The Lansing Art Gallery, Red Cedar River |
| Downtown Lansing | The cultural and political heart of the city, Downtown Lansing features a mix of governmental buildings, parks, and modern amenities. It's ideal for business travelers and tourists exploring Michigan's capital. | Michigan State Capitol, Cooley Law School Stadium, Lansing Center, Scott Sunken Gardens, Impression 5 Science Center |
| REO Town | An up-and-coming neighborhood known for its revitalization and eclectic vibe. REO Town offers unique shops, art galleries, and a selection of local dining options, appealing to younger crowds. | REO Town Marketplace, The Robin Theatre, Artisan Village, Duncan’s Pub, REO Town's public art installations |
| East Lansing | Home to Michigan State University, East Lansing has a vibrant student population and a lively atmosphere. It attracts visitors for sports games and academic events throughout the year. | Michigan State University, Spartan Stadium, Beaumont Tower, The Wharton Center, Red Cedar River |
| Holt | A family-friendly suburban area with parks and good schools. Holt offers a quieter atmosphere ideal for families vacationing in the Lansing area, with easy access to major attractions. | Holt Community Park, Dewitt Township Park, Lansing Mall, Cedar Street Park, Granger Meadows Park |
| Lansing's West Side | Known for its diverse community and historic homes, the West Side offers a mix of urban and residential experiences. It features local eateries and is close to downtown attractions. | Lansing City Market, Burchard Park, Old Town, Patria Hall, Westside Park |
| South Lansing | A predominantly residential area that offers an array of parks and suburban comforts. South Lansing is appealing for those looking for local experiences slightly off the beaten path. | Potato Creek Park, Hunter Park, South Lansing Community Center, Eagle View Golf Course, Ferguson Field |
| Lansing Township | Close to several major attractions and a quieter alternative for those looking to explore the Lansing area. Lansing Township features parks, shopping, and family-friendly spaces. | Lansing Mall, Granger Park, Fenner Nature Center, Kerns Park, Lansing Township Parks Department |
Understanding Airbnb License Requirements & STR Laws in Lansing (2026)
While Lansing, Michigan, United States currently shows low STR regulations, specific Airbnb license requirements might still exist or change. Always verify the latest short term rental regulations and Airbnb license requirements directly with local government authorities for Lansing to ensure full compliance before hosting.
(Source: AirROI data, 2026, finding no licensed listings among those analyzed)
Top Performing Airbnb Properties in Lansing (2026)
Benchmark your potential! Explore examples of top-performing Airbnb properties in Lansingbased on Trailing Twelve Month (TTM) revenue. Analyze their characteristics, revenue, occupancy rate, and ADR to understand what drives success in this market.
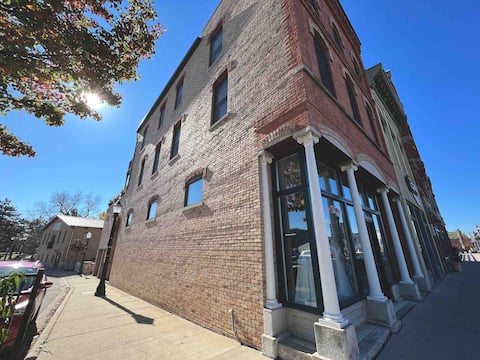
Historic Old Town Lofts & Deck - Old Town Lansing
Entire Place • 4 bedrooms
Emerald Square I 4 King Beds I 3 Bath I Loft Area
Entire Place • 5 bedrooms
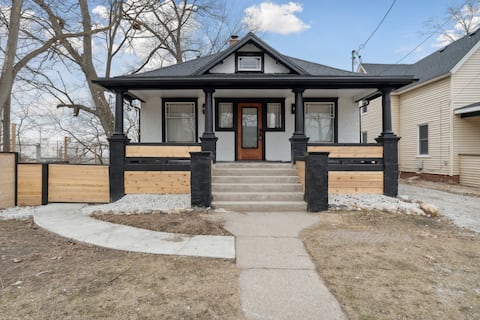
Your Weekend Home with Hot Tub
Entire Place • 3 bedrooms
Downtown Delight I 4 BR & 2 BA I Sleeps 16
Entire Place • 4 bedrooms
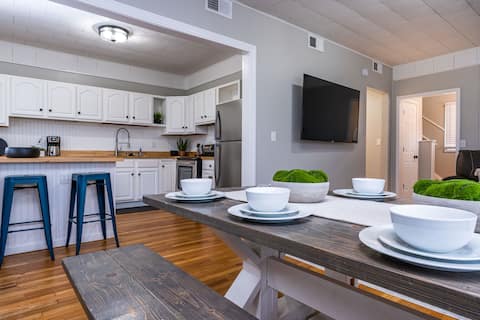
Modern Stay Near Downtown & MSU w/Game Room
Entire Place • 3 bedrooms
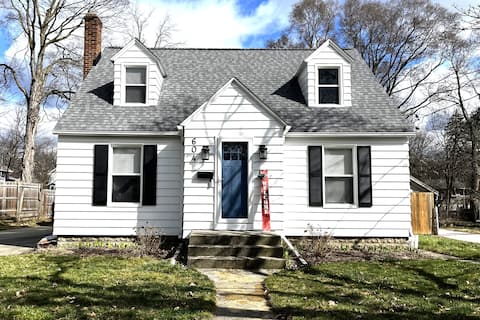
4 BR I 2 BA Lansing Home
Entire Place • 4 bedrooms
Note: Performance varies based on location, size, amenities, seasonality, and management quality. Data reflects the past 12 months.
Top Performing Airbnb Hosts in Lansing (2026)
Learn from the best! This table showcases top-performing Airbnb hosts in Lansing based on the number of properties managed and estimated total revenue over the past year. Analyze their scale and performance metrics.
| Host Name | Properties | Grossing Revenue | Stay Reviews | Avg Rating |
|---|---|---|---|---|
| Dean | 27 | $623,648 | 2168 | 4.73/5.0 |
| Jessica | 12 | $482,619 | 639 | 4.70/5.0 |
| Aura | 6 | $306,773 | 315 | 5.00/5.0 |
| Brent | 8 | $268,193 | 454 | 4.92/5.0 |
| Van & Leigh | 11 | $200,403 | 3238 | 4.88/5.0 |
| Teresa | 7 | $177,131 | 333 | 4.84/5.0 |
| Goldilocks | 11 | $176,905 | 1011 | 4.90/5.0 |
| Rhett | 3 | $145,042 | 1104 | 4.94/5.0 |
| The Gilson Group | 3 | $119,854 | 110 | 4.61/5.0 |
| Rivka Beth-Sara | 3 | $103,209 | 539 | 4.91/5.0 |
Analyzing the strategies of top hosts, such as their property selection, pricing, and guest communication, can offer valuable lessons for optimizing your own Airbnb operations in Lansing.
Dive Deeper: Advanced Lansing STR Market Data (2026)
Ready to unlock more insights? AirROI provides access to advanced metrics and comprehensive Airbnb data for Lansing. Explore detailed analytics beyond this report to refine your investment strategy, optimize pricing, and maximize your vacation rental profits.
Explore Advanced MetricsLansing Short-Term Rental Market Composition (2026): Property & Room Types
Room Type Distribution
Property Type Distribution
Market Composition Insights for Lansing
- The Lansing Airbnb market composition is heavily skewed towards Entire Home/Apt listings, which make up 77.2% of the 263 active rentals. This indicates strong guest preference for privacy and space.
- Looking at the property type distribution in Lansing, House properties are the most common (59.3%), reflecting the local real estate landscape.
- Houses represent a significant 59.3% portion, catering likely to families or larger groups.
- Smaller segments like others (combined 1.1%) offer potential for unique stay experiences.
Lansing Airbnb Room Capacity Analysis (2026): Bedroom Distribution
Distribution of Listings by Number of Bedrooms
Room Capacity Insights for Lansing
- The dominant room capacity in Lansing is 1 bedroom listings, making up 24.7% of the market. This suggests a strong demand for properties suitable for couples or solo travelers.
- Together, 1 bedroom and 2 bedrooms properties represent 48.3% of the active Airbnb listings in Lansing, indicating a high concentration in these sizes.
- A significant 27.4% of listings offer 3+ bedrooms, catering to larger groups and families seeking more space in Lansing.
Lansing Vacation Rental Guest Capacity Trends (2026)
Distribution of Listings by Guest Capacity
Guest Capacity Insights for Lansing
- The most common guest capacity trend in Lansing vacation rentals is listings accommodating 4 guests (23.6%). This suggests the primary traveler segment is likely small families or groups.
- Properties designed for 4 guests and 8+ guests dominate the Lansing STR market, accounting for 39.2% of listings.
- 32.7% of properties accommodate 6+ guests, serving the market segment for larger families or group travel in Lansing.
- On average, properties in Lansing are equipped to host 3.8 guests.
Lansing Airbnb Booking Patterns (2026): Available vs. Booked Days
Available Days Distribution
Booked Days Distribution
Booking Pattern Insights for Lansing
- The most common availability pattern in Lansing falls within the 181-270 days range, representing 42.6% of listings. This suggests many properties have significant open periods on their calendars.
- Approximately 72.3% of listings show high availability (181+ days open annually), indicating potential for increased bookings or specific owner usage patterns.
- For booked days, the 91-180 days range is most frequent in Lansing (43.3%), reflecting common guest stay durations or potential owner blocking patterns.
- A notable 28.2% of properties secure long booking periods (181+ days booked per year), highlighting successful long-term rental strategies or significant owner usage.
Lansing Airbnb Minimum Stay Requirements Analysis
Distribution of Listings by Minimum Night Requirement
1 Night
58 listings
22.1% of total
2 Nights
52 listings
19.8% of total
3 Nights
10 listings
3.8% of total
4-6 Nights
28 listings
10.6% of total
7-29 Nights
35 listings
13.3% of total
30+ Nights
80 listings
30.4% of total
Key Insights
- The most prevalent minimum stay requirement in Lansing is 30+ Nights, adopted by 30.4% of listings. This highlights the market's preference for longer commitments.
- A significant segment (30.4%) caters to monthly stays (30+ nights) in Lansing, pointing to opportunities in the extended-stay market.
Recommendations
- Align with the market by considering a 30+ Nights minimum stay, as 30.4% of Lansing hosts use this setting.
- If feasible, allowing 1-night stays, especially midweek or during low season, could capture last-minute bookings, as only 22.1% currently do.
- Explore offering discounts for stays of 30+ nights to attract the 30.4% of the market seeking extended stays.
- Adjust minimum nights based on seasonality – potentially shorter during low season and longer during peak demand periods in Lansing.
Lansing Airbnb Cancellation Policy Trends Analysis (2026)
Limited
4 listings
1.5% of total
Super Strict 30 Days
8 listings
3% of total
Flexible
66 listings
25.1% of total
Moderate
39 listings
14.8% of total
Firm
131 listings
49.8% of total
Strict
15 listings
5.7% of total
Cancellation Policy Insights for Lansing
- The prevailing Airbnb cancellation policy trend in Lansing is Firm, used by 49.8% of listings.
- A majority (55.5%) of hosts in Lansing utilize Firm or Strict policies, indicating a market where hosts prioritize booking security.
- Strict cancellation policies are quite rare (5.7%), potentially making listings with this policy less competitive unless justified by high demand or property type.
Recommendations for Hosts
- Consider adopting a Firm policy to align with the 49.8% market standard in Lansing.
- Using a Strict policy might deter some guests, as only 5.7% of listings use it. Evaluate if potential revenue protection outweighs possible lower booking rates.
- Regularly review your cancellation policy against competitors and market demand shifts in Lansing.
Lansing STR Booking Lead Time Analysis (2026)
Average Booking Lead Time by Month
Booking Lead Time Insights for Lansing
- The overall average booking lead time for vacation rentals in Lansing is 28 days.
- Guests book furthest in advance for stays during May (average 47 days), likely coinciding with peak travel demand or local events.
- The shortest booking windows occur for stays in February (average 17 days), indicating more last-minute travel plans during this time.
- Seasonally, Fall (35 days avg.) sees the longest lead times, while Winter (20 days avg.) has the shortest, reflecting typical travel planning cycles.
Recommendations for Hosts
- Use the overall average lead time (28 days) as a baseline for your pricing and availability strategy in Lansing.
- For May stays, consider implementing length-of-stay discounts or slightly higher rates for bookings made less than 47 days out to capitalize on advance planning.
- Target marketing efforts for the Fall season well in advance (at least 35 days) to capture early planners.
- Monitor your own booking lead times against these Lansing averages to identify opportunities for dynamic pricing adjustments.
Popular & Essential Airbnb Amenities in Lansing (2026)
Amenity Prevalence
Amenity Insights for Lansing
- Essential amenities in Lansing that guests expect include: Smoke alarm, Wifi, Kitchen, TV, Air conditioning. Lacking these (any) could significantly impact bookings.
- Popular amenities like Free parking on premises, Heating, Hot water are common but not universal. Offering these can provide a competitive edge.
Recommendations for Hosts
- Ensure your listing includes all essential amenities for Lansing: Smoke alarm, Wifi, Kitchen, TV, Air conditioning.
- Prioritize adding missing essentials: Smoke alarm, Wifi, Kitchen, TV, Air conditioning.
- Consider adding popular differentiators like Free parking on premises or Heating to increase appeal.
- Highlight unique or less common amenities you offer (e.g., hot tub, dedicated workspace, EV charger) in your listing description and photos.
- Regularly check competitor amenities in Lansing to stay competitive.
Lansing Airbnb Guest Demographics & Profile Analysis (2026)
Guest Profile Summary for Lansing
- The typical guest profile for Airbnb in Lansing consists of primarily domestic travelers (95%), often arriving from nearby Lansing, typically belonging to the Post-2000s (Gen Z/Alpha) group (50%), primarily speaking English or Spanish.
- Domestic travelers account for 94.5% of guests.
- Key international markets include United States (94.5%) and Canada (1.8%).
- Top languages spoken are English (73.7%) followed by Spanish (11.4%).
- A significant demographic segment is the Post-2000s (Gen Z/Alpha) group, representing 50% of guests.
Recommendations for Hosts
- Target domestic marketing efforts towards travelers from Lansing and Chicago.
- Tailor amenities and listing descriptions to appeal to the dominant Post-2000s (Gen Z/Alpha) demographic (e.g., highlight fast WiFi, smart home features, local guides).
- Highlight unique local experiences or amenities relevant to the primary guest profile.
- Consider seasonal promotions aligned with peak travel times for key origin markets.
Nearby Short-Term Rental Market Comparison
How does the Lansing Airbnb market stack up against its neighbors? Compare key performance metrics like average monthly revenue, ADR, and occupancy rates in surrounding areas to understand the broader regional STR landscape.
| Market | Active Properties | Monthly Revenue | Daily Rate | Avg. Occupancy |
|---|---|---|---|---|
| Paw Paw Township | 10 | $5,458 | $418.85 | 49% |
| Scio Township | 18 | $5,101 | $764.17 | 43% |
| Fremont | 16 | $4,898 | $436.31 | 42% |
| Grattan Township | 16 | $4,890 | $353.91 | 56% |
| City of Frankenmuth | 31 | $4,860 | $320.28 | 51% |
| Alto | 19 | $4,489 | $499.41 | 35% |
| Grass Lake Charter Township | 14 | $4,410 | $365.88 | 45% |
| White Pigeon Township | 10 | $4,264 | $312.31 | 50% |
| Clyde Township | 15 | $4,244 | $453.67 | 43% |
| Lee Township | 34 | $4,223 | $415.05 | 37% |