Kalamazoo Airbnb Market Analysis 2026: Short Term Rental Data & Vacation Rental Statistics in Michigan, United States
Is Airbnb profitable in Kalamazoo in 2026? Explore comprehensive Airbnb analytics for Kalamazoo, Michigan, United States to uncover income potential. This 2026 STR market report for Kalamazoo, based on AirROI data from February 2025 to January 2026, reveals key trends in the niche market of 137 active listings.
Whether you're considering an Airbnb investment in Kalamazoo, optimizing your existing vacation rental, or exploring rental arbitrage opportunities, understanding the Kalamazoo Airbnb data is crucial. Leveraging the low regulation environment is key to maximizing your short term rental income potential. Let's dive into the specifics.
Key Kalamazoo Airbnb Performance Metrics Overview
Monthly Airbnb Revenue Variations & Income Potential in Kalamazoo (2026)
Understanding the monthly revenue variations for Airbnb listings in Kalamazoo is key to maximizing your short term rental income potential. Seasonality significantly impacts earnings. Our analysis, based on data from the past 12 months, shows that the peak revenue month for STRs in Kalamazoo is typically July, while January often presents the lowest earnings, highlighting opportunities for strategic pricing adjustments during shoulder and low seasons. Explore the typical Airbnb income in Kalamazoo across different performance tiers:
- Best-in-class properties (Top 10%) achieve $4,287+ monthly, often utilizing dynamic pricing and superior guest experiences.
- Strong performing properties (Top 25%) earn $2,902 or more, indicating effective management and desirable locations/amenities.
- Typical properties (Median) generate around $1,792 per month, representing the average market performance.
- Entry-level properties (Bottom 25%) see earnings around $928, often with potential for optimization.
Average Monthly Airbnb Earnings Trend in Kalamazoo
Kalamazoo Airbnb Occupancy Rate Trends (2026)
Maximize your bookings by understanding the Kalamazoo STR occupancy trends. Seasonal demand shifts significantly influence how often properties are booked. Typically, Julysees the highest demand (peak season occupancy), while January experiences the lowest (low season). Effective strategies, like adjusting minimum stays or offering promotions, can boost occupancy during slower periods. Here's how different property tiers perform in Kalamazoo:
- Best-in-class properties (Top 10%) achieve 82%+ occupancy, indicating high desirability and potentially optimized availability.
- Strong performing properties (Top 25%) maintain 64% or higher occupancy, suggesting good market fit and guest satisfaction.
- Typical properties (Median) have an occupancy rate around 44%.
- Entry-level properties (Bottom 25%) average 25% occupancy, potentially facing higher vacancy.
Average Monthly Occupancy Rate Trend in Kalamazoo
Average Daily Rate (ADR) Airbnb Trends in Kalamazoo (2026)
Effective short term rental pricing strategy in Kalamazoo involves understanding monthly ADR fluctuations. The Average Daily Rate (ADR) for Airbnb in Kalamazoo typically peaks in October and dips lowest during March. Leveraging Airbnb dynamic pricing tools or strategies based on this seasonality can significantly boost revenue. Here's a look at the typical nightly rates achieved:
- Best-in-class properties (Top 10%) command rates of $250+ per night, often due to premium features or locations.
- Strong performing properties (Top 25%) achieve nightly rates of $177 or more.
- Typical properties (Median) charge around $125 per night.
- Entry-level properties (Bottom 25%) earn around $85 per night.
Average Daily Rate (ADR) Trend by Month in Kalamazoo
Get Live Kalamazoo Market Intelligence 👇

Explore Real-time Analytics
Airbnb Seasonality Analysis & Trends in Kalamazoo (2026)
Peak Season (July, August, June)
- Revenue averages $2,859 per month
- Occupancy rates average 53.9%
- Daily rates average $151
Shoulder Season
- Revenue averages $2,060 per month
- Occupancy maintains around 45.8%
- Daily rates hold near $144
Low Season (January, March, December)
- Revenue drops to average $1,671 per month
- Occupancy decreases to average 36.8%
- Daily rates adjust to average $143
Seasonality Insights for Kalamazoo
- The Airbnb seasonality in Kalamazoo shows highly seasonal trends requiring careful strategy. While the sections above show seasonal averages, it's also insightful to look at the extremes:
- During the high season, the absolute peak month showcases Kalamazoo's highest earning potential, with monthly revenues capable of climbing to $3,069, occupancy reaching a high of 56.9%, and ADRs peaking at $153.
- Conversely, the slowest single month of the year, typically falling within the low season, marks the market's lowest point. In this month, revenue might dip to $1,508, occupancy could drop to 30.1%, and ADRs may adjust down to $133.
- Understanding both the seasonal averages and these monthly peaks and troughs in revenue, occupancy, and ADR is crucial for maximizing your Airbnb profit potential in Kalamazoo.
Seasonal Strategies for Maximizing Profit
- Peak Season: Maximize revenue through premium pricing and potentially longer minimum stays. Ensure high availability.
- Low Season: Offer competitive pricing, special promotions (e.g., extended stay discounts), and flexible cancellation policies. Target off-season travelers like remote workers or budget-conscious guests.
- Shoulder Seasons: Implement dynamic pricing that balances peak and low rates. Target weekend travelers or specific events. Offer slightly more flexible terms than peak season.
- Regularly analyze your own performance against these Kalamazoo seasonality benchmarks and adjust your pricing and availability strategy accordingly.
Best Areas for Airbnb Investment in Kalamazoo (2026)
Exploring the top neighborhoods for short-term rentals in Kalamazoo? This section highlights key areas, outlining why they are attractive for hosts and guests, along with notable local attractions. Consider these locations based on your target guest profile and investment strategy.
| Neighborhood / Area | Why Host Here? (Target Guests & Appeal) | Key Attractions & Landmarks |
|---|---|---|
| Westnedge Hill | A beautiful residential area close to parks and the Kalamazoo River, ideal for families and nature lovers. Offers a suburban feel while still being near downtown Kalamazoo. | Kalamazoo Nature Center, Bluetree Greenway, Kalamazoo River, Southwest Michigan's wine country, Westnedge Park |
| Downtown Kalamazoo | The city's vibrant heart with a mix of dining, nightlife, and arts. Attracts both tourists and business travelers looking for a lively urban experience. | Kalamazoo State Theatre, Barn Theatre, Kalamazoo Mall, Kalamazoo Institute of Arts, Local breweries and cafes |
| Kalamazoo College area | A historic and charming neighborhood surrounding Kalamazoo College. Appeals to students, parents, and visitors, with cultural events and activities. | Kalamazoo College, Bell's Brewery, Kalamazoo Farmers Market, Kalamazoo Valley Museum, Milham Park |
| Texas Township | A family-friendly area with good schools and parks. Ideal for longer stays, attracting families and those looking for a quiet retreat with easy access to city amenities. | Texas Township Park, Portage Creek Bicentennial Park, Shopping centers, Nearby golf courses |
| Portage | Just south of Kalamazoo, Portage offers great suburban living with proximity to parks and lakes. A good choice for those looking for a peaceful environment but still want to be close to Kalamazoo. | Lakeview Park, Lakeside Park, Portage District Library, Local shopping and dining |
| Oshtemo | A suburban neighborhood known for its large parks and family-friendly atmosphere. Strong appeal to outdoor enthusiasts and families. | Oshtemo Township Park, Texas Corners area, Nearby hiking trails, Shopping areas |
| Eastside | A diverse neighborhood experiencing revitalization. Attracts a mix of residents and visitors interested in a more urban experience with local culture. | Eastside Park, Local shops and cafes, Community events, Kalamazoo Art Hop |
| Kalamazoo's Historic Northside | A historic neighborhood that offers a unique glimpse into the city's past. Ideal for people interested in the culture and history of Kalamazoo. | Northside Park, African American Cultural and Heritage Facility, Historic homes and architecture, Kalamazoo Air Zoo |
Understanding Airbnb License Requirements & STR Laws in Kalamazoo (2026)
While Kalamazoo, Michigan, United States currently shows low STR regulations, specific Airbnb license requirements might still exist or change. Always verify the latest short term rental regulations and Airbnb license requirements directly with local government authorities for Kalamazoo to ensure full compliance before hosting.
(Source: AirROI data, 2026, finding no licensed listings among those analyzed)
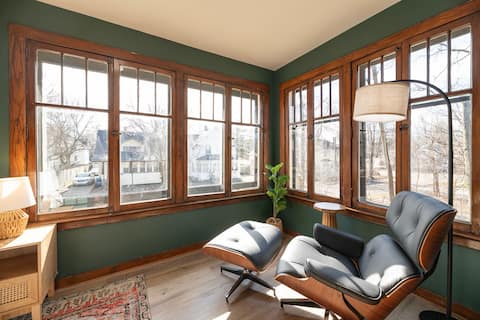
Top Performing Airbnb Properties in Kalamazoo (2026)
Benchmark your potential! Explore examples of top-performing Airbnb properties in Kalamazoobased on Trailing Twelve Month (TTM) revenue. Analyze their characteristics, revenue, occupancy rate, and ADR to understand what drives success in this market.

*NEW* Entire Gorgeous Victorian Home Downtown KZOO
Entire Place • 5 bedrooms

The Eddy on Parkview
Entire Place • 3 bedrooms
Craftsman 8 min downtown hot tub & gameroom
Entire Place • 3 bedrooms

Private Luxury 3BD Penthouse in Downtown Kalamazoo
Entire Place • 3 bedrooms

Downtown, Themed Rooms w/Luxury Design
Entire Place • 4 bedrooms

!Luxury Designed Listing! - Downtown - Soaker Tub
Entire Place • 4 bedrooms
Note: Performance varies based on location, size, amenities, seasonality, and management quality. Data reflects the past 12 months.
Top Performing Airbnb Hosts in Kalamazoo (2026)
Learn from the best! This table showcases top-performing Airbnb hosts in Kalamazoo based on the number of properties managed and estimated total revenue over the past year. Analyze their scale and performance metrics.
| Host Name | Properties | Grossing Revenue | Stay Reviews | Avg Rating |
|---|---|---|---|---|
| Paul | 9 | $158,364 | 473 | 4.77/5.0 |
| Madeleine | 9 | $153,071 | 694 | 4.83/5.0 |
| Jackie And Zach | 4 | $150,740 | 313 | 5.00/5.0 |
| Melissa | 3 | $126,312 | 22 | 4.85/5.0 |
| Kara | 6 | $116,564 | 1592 | 4.84/5.0 |
| Your Hosts, Jeremy And Katie | 2 | $113,323 | 292 | 4.93/5.0 |
| Adam | 5 | $108,076 | 500 | 4.67/5.0 |
| Lori | 2 | $104,912 | 9 | 4.92/5.0 |
| Christopher | 2 | $85,557 | 97 | 4.89/5.0 |
| Kevin | 2 | $70,815 | 361 | 4.89/5.0 |
Analyzing the strategies of top hosts, such as their property selection, pricing, and guest communication, can offer valuable lessons for optimizing your own Airbnb operations in Kalamazoo.
Dive Deeper: Advanced Kalamazoo STR Market Data (2026)
Ready to unlock more insights? AirROI provides access to advanced metrics and comprehensive Airbnb data for Kalamazoo. Explore detailed analytics beyond this report to refine your investment strategy, optimize pricing, and maximize your vacation rental profits.
Explore Advanced MetricsKalamazoo Short-Term Rental Market Composition (2026): Property & Room Types
Room Type Distribution
Property Type Distribution
Market Composition Insights for Kalamazoo
- The Kalamazoo Airbnb market composition is heavily skewed towards Entire Home/Apt listings, which make up 88.3% of the 137 active rentals. This indicates strong guest preference for privacy and space.
- Looking at the property type distribution in Kalamazoo, Apartment/Condo properties are the most common (56.9%), reflecting the local real estate landscape.
- Houses represent a significant 40.9% portion, catering likely to families or larger groups.
- Smaller segments like others, outdoor/unique (combined 2.2%) offer potential for unique stay experiences.
Kalamazoo Airbnb Room Capacity Analysis (2026): Bedroom Distribution
Distribution of Listings by Number of Bedrooms
Room Capacity Insights for Kalamazoo
- The dominant room capacity in Kalamazoo is 1 bedroom listings, making up 35% of the market. This suggests a strong demand for properties suitable for couples or solo travelers.
- Together, 1 bedroom and 2 bedrooms properties represent 64.9% of the active Airbnb listings in Kalamazoo, indicating a high concentration in these sizes.
Kalamazoo Vacation Rental Guest Capacity Trends (2026)
Distribution of Listings by Guest Capacity
Guest Capacity Insights for Kalamazoo
- The most common guest capacity trend in Kalamazoo vacation rentals is listings accommodating 2 guests (22.6%). This suggests the primary traveler segment is likely couples or solo travelers.
- Properties designed for 2 guests and 4 guests dominate the Kalamazoo STR market, accounting for 40.8% of listings.
- 27.7% of properties accommodate 6+ guests, serving the market segment for larger families or group travel in Kalamazoo.
- On average, properties in Kalamazoo are equipped to host 3.7 guests.
Kalamazoo Airbnb Booking Patterns (2026): Available vs. Booked Days
Available Days Distribution
Booked Days Distribution
Booking Pattern Insights for Kalamazoo
- The most common availability pattern in Kalamazoo falls within the 181-270 days range, representing 38.7% of listings. This suggests many properties have significant open periods on their calendars.
- Approximately 70.8% of listings show high availability (181+ days open annually), indicating potential for increased bookings or specific owner usage patterns.
- For booked days, the 91-180 days range is most frequent in Kalamazoo (38%), reflecting common guest stay durations or potential owner blocking patterns.
- A notable 31.3% of properties secure long booking periods (181+ days booked per year), highlighting successful long-term rental strategies or significant owner usage.
Kalamazoo Airbnb Minimum Stay Requirements Analysis
Distribution of Listings by Minimum Night Requirement
1 Night
42 listings
30.7% of total
2 Nights
38 listings
27.7% of total
3 Nights
5 listings
3.6% of total
4-6 Nights
5 listings
3.6% of total
7-29 Nights
13 listings
9.5% of total
30+ Nights
34 listings
24.8% of total
Key Insights
- The most prevalent minimum stay requirement in Kalamazoo is 1 Night, adopted by 30.7% of listings. This highlights the market's preference for shorter, flexible bookings.
- A significant segment (24.8%) caters to monthly stays (30+ nights) in Kalamazoo, pointing to opportunities in the extended-stay market.
Recommendations
- Align with the market by considering a 1 Night minimum stay, as 30.7% of Kalamazoo hosts use this setting.
- Explore offering discounts for stays of 30+ nights to attract the 24.8% of the market seeking extended stays.
- Adjust minimum nights based on seasonality – potentially shorter during low season and longer during peak demand periods in Kalamazoo.
Kalamazoo Airbnb Cancellation Policy Trends Analysis (2026)
Flexible
39 listings
28.5% of total
Moderate
39 listings
28.5% of total
Firm
49 listings
35.8% of total
Strict
10 listings
7.3% of total
Cancellation Policy Insights for Kalamazoo
- The prevailing Airbnb cancellation policy trend in Kalamazoo is Firm, used by 35.8% of listings.
- There's a relatively balanced mix between guest-friendly (57.0%) and stricter (43.1%) policies, offering choices for different guest needs.
- Strict cancellation policies are quite rare (7.3%), potentially making listings with this policy less competitive unless justified by high demand or property type.
Recommendations for Hosts
- Consider adopting a Firm policy to align with the 35.8% market standard in Kalamazoo.
- Using a Strict policy might deter some guests, as only 7.3% of listings use it. Evaluate if potential revenue protection outweighs possible lower booking rates.
- Regularly review your cancellation policy against competitors and market demand shifts in Kalamazoo.
Kalamazoo STR Booking Lead Time Analysis (2026)
Average Booking Lead Time by Month
Booking Lead Time Insights for Kalamazoo
- The overall average booking lead time for vacation rentals in Kalamazoo is 30 days.
- Guests book furthest in advance for stays during June (average 53 days), likely coinciding with peak travel demand or local events.
- The shortest booking windows occur for stays in February (average 17 days), indicating more last-minute travel plans during this time.
- Seasonally, Summer (42 days avg.) sees the longest lead times, while Winter (22 days avg.) has the shortest, reflecting typical travel planning cycles.
Recommendations for Hosts
- Use the overall average lead time (30 days) as a baseline for your pricing and availability strategy in Kalamazoo.
- For June stays, consider implementing length-of-stay discounts or slightly higher rates for bookings made less than 53 days out to capitalize on advance planning.
- Target marketing efforts for the Summer season well in advance (at least 42 days) to capture early planners.
- Monitor your own booking lead times against these Kalamazoo averages to identify opportunities for dynamic pricing adjustments.
Popular & Essential Airbnb Amenities in Kalamazoo (2026)
Amenity Prevalence
Amenity Insights for Kalamazoo
- Essential amenities in Kalamazoo that guests expect include: Wifi, Free parking on premises, Smoke alarm, Air conditioning, Heating. Lacking these (any) could significantly impact bookings.
- Popular amenities like Carbon monoxide alarm, TV, Hot water are common but not universal. Offering these can provide a competitive edge.
Recommendations for Hosts
- Ensure your listing includes all essential amenities for Kalamazoo: Wifi, Free parking on premises, Smoke alarm, Air conditioning, Heating.
- Prioritize adding missing essentials: Free parking on premises, Smoke alarm, Air conditioning, Heating.
- Consider adding popular differentiators like Carbon monoxide alarm or TV to increase appeal.
- Highlight unique or less common amenities you offer (e.g., hot tub, dedicated workspace, EV charger) in your listing description and photos.
- Regularly check competitor amenities in Kalamazoo to stay competitive.
Kalamazoo Airbnb Guest Demographics & Profile Analysis (2026)
Guest Profile Summary for Kalamazoo
- The typical guest profile for Airbnb in Kalamazoo consists of primarily domestic travelers (96%), often arriving from nearby Chicago, typically belonging to the Post-2000s (Gen Z/Alpha) group (50%), primarily speaking English or Spanish.
- Domestic travelers account for 95.8% of guests.
- Key international markets include United States (95.8%) and Canada (1.1%).
- Top languages spoken are English (72.8%) followed by Spanish (9.6%).
- A significant demographic segment is the Post-2000s (Gen Z/Alpha) group, representing 50% of guests.
Recommendations for Hosts
- Target domestic marketing efforts towards travelers from Chicago and Kalamazoo.
- Tailor amenities and listing descriptions to appeal to the dominant Post-2000s (Gen Z/Alpha) demographic (e.g., highlight fast WiFi, smart home features, local guides).
- Highlight unique local experiences or amenities relevant to the primary guest profile.
- Consider seasonal promotions aligned with peak travel times for key origin markets.
Nearby Short-Term Rental Market Comparison
How does the Kalamazoo Airbnb market stack up against its neighbors? Compare key performance metrics like average monthly revenue, ADR, and occupancy rates in surrounding areas to understand the broader regional STR landscape.
| Market | Active Properties | Monthly Revenue | Daily Rate | Avg. Occupancy |
|---|---|---|---|---|
| Laketown Township | 59 | $6,112 | $529.59 | 44% |
| Port Sheldon Township | 26 | $6,015 | $566.98 | 47% |
| Ganges Township | 69 | $5,687 | $636.25 | 38% |
| Saugatuck Township | 141 | $5,627 | $508.58 | 43% |
| Paw Paw Township | 10 | $5,458 | $418.85 | 49% |
| New Buffalo Township | 260 | $5,145 | $633.18 | 36% |
| Bertrand Township | 22 | $5,011 | $365.69 | 40% |
| Union Pier | 16 | $4,998 | $659.10 | 36% |
| Fremont | 16 | $4,898 | $436.31 | 42% |
| Grattan Township | 16 | $4,890 | $353.91 | 56% |