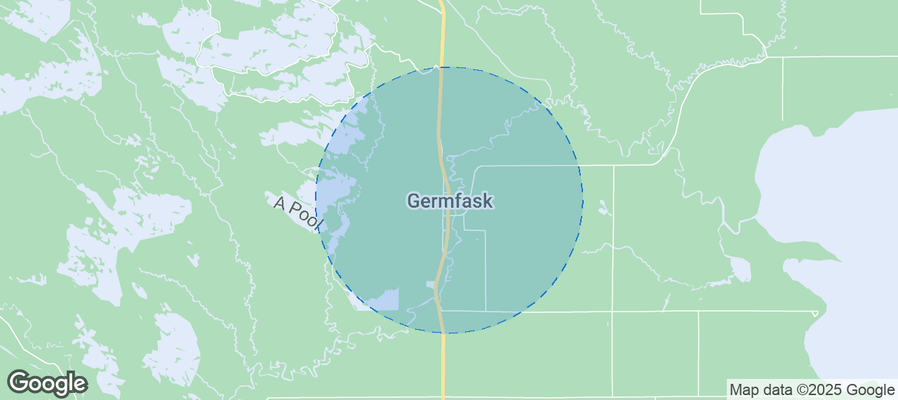
Germfask Airbnb Market Analysis 2026: Short Term Rental Data & Vacation Rental Statistics in Michigan, United States
Is Airbnb profitable in Germfask in 2026? Explore comprehensive Airbnb analytics for Germfask, Michigan, United States to uncover income potential. This 2026 STR market report for Germfask, based on AirROI data from February 2025 to January 2026, reveals key trends in the niche market of 19 active listings.
Whether you're considering an Airbnb investment in Germfask, optimizing your existing vacation rental, or exploring rental arbitrage opportunities, understanding the Germfask Airbnb data is crucial. Leveraging the low regulation environment is key to maximizing your short term rental income potential. Let's dive into the specifics.
Key Germfask Airbnb Performance Metrics Overview
Monthly Airbnb Revenue Variations & Income Potential in Germfask (2026)
Understanding the monthly revenue variations for Airbnb listings in Germfask is key to maximizing your short term rental income potential. Seasonality significantly impacts earnings. Our analysis, based on data from the past 12 months, shows that the peak revenue month for STRs in Germfask is typically July, while November often presents the lowest earnings, highlighting opportunities for strategic pricing adjustments during shoulder and low seasons. Explore the typical Airbnb income in Germfask across different performance tiers:
- Best-in-class properties (Top 10%) achieve $4,407+ monthly, often utilizing dynamic pricing and superior guest experiences.
- Strong performing properties (Top 25%) earn $3,148 or more, indicating effective management and desirable locations/amenities.
- Typical properties (Median) generate around $2,048 per month, representing the average market performance.
- Entry-level properties (Bottom 25%) see earnings around $1,273, often with potential for optimization.
Average Monthly Airbnb Earnings Trend in Germfask
Germfask Airbnb Occupancy Rate Trends (2026)
Maximize your bookings by understanding the Germfask STR occupancy trends. Seasonal demand shifts significantly influence how often properties are booked. Typically, Julysees the highest demand (peak season occupancy), while December experiences the lowest (low season). Effective strategies, like adjusting minimum stays or offering promotions, can boost occupancy during slower periods. Here's how different property tiers perform in Germfask:
- Best-in-class properties (Top 10%) achieve 78%+ occupancy, indicating high desirability and potentially optimized availability.
- Strong performing properties (Top 25%) maintain 67% or higher occupancy, suggesting good market fit and guest satisfaction.
- Typical properties (Median) have an occupancy rate around 52%.
- Entry-level properties (Bottom 25%) average 31% occupancy, potentially facing higher vacancy.
Average Monthly Occupancy Rate Trend in Germfask
Average Daily Rate (ADR) Airbnb Trends in Germfask (2026)
Effective short term rental pricing strategy in Germfask involves understanding monthly ADR fluctuations. The Average Daily Rate (ADR) for Airbnb in Germfask typically peaks in September and dips lowest during April. Leveraging Airbnb dynamic pricing tools or strategies based on this seasonality can significantly boost revenue. Here's a look at the typical nightly rates achieved:
- Best-in-class properties (Top 10%) command rates of $221+ per night, often due to premium features or locations.
- Strong performing properties (Top 25%) achieve nightly rates of $137 or more.
- Typical properties (Median) charge around $115 per night.
- Entry-level properties (Bottom 25%) earn around $65 per night.
Average Daily Rate (ADR) Trend by Month in Germfask
Get Live Germfask Market Intelligence 👇
Explore Real-time Analytics
Airbnb Seasonality Analysis & Trends in Germfask (2026)
Peak Season (July, February, August)
- Revenue averages $3,575 per month
- Occupancy rates average 71.0%
- Daily rates average $116
Shoulder Season
- Revenue averages $2,203 per month
- Occupancy maintains around 47.3%
- Daily rates hold near $118
Low Season (March, June, November)
- Revenue drops to average $1,687 per month
- Occupancy decreases to average 36.4%
- Daily rates adjust to average $116
Seasonality Insights for Germfask
- The Airbnb seasonality in Germfask shows highly seasonal trends requiring careful strategy. While the sections above show seasonal averages, it's also insightful to look at the extremes:
- During the high season, the absolute peak month showcases Germfask's highest earning potential, with monthly revenues capable of climbing to $3,907, occupancy reaching a high of 81.7%, and ADRs peaking at $124.
- Conversely, the slowest single month of the year, typically falling within the low season, marks the market's lowest point. In this month, revenue might dip to $1,561, occupancy could drop to 30.6%, and ADRs may adjust down to $110.
- Understanding both the seasonal averages and these monthly peaks and troughs in revenue, occupancy, and ADR is crucial for maximizing your Airbnb profit potential in Germfask.
Seasonal Strategies for Maximizing Profit
- Peak Season: Maximize revenue through premium pricing and potentially longer minimum stays. Ensure high availability.
- Low Season: Offer competitive pricing, special promotions (e.g., extended stay discounts), and flexible cancellation policies. Target off-season travelers like remote workers or budget-conscious guests.
- Shoulder Seasons: Implement dynamic pricing that balances peak and low rates. Target weekend travelers or specific events. Offer slightly more flexible terms than peak season.
- Regularly analyze your own performance against these Germfask seasonality benchmarks and adjust your pricing and availability strategy accordingly.
Best Areas for Airbnb Investment in Germfask (2026)
Exploring the top neighborhoods for short-term rentals in Germfask? This section highlights key areas, outlining why they are attractive for hosts and guests, along with notable local attractions. Consider these locations based on your target guest profile and investment strategy.
| Neighborhood / Area | Why Host Here? (Target Guests & Appeal) | Key Attractions & Landmarks |
|---|---|---|
| Manistique Lakes | Scenic lakes offering beautiful views and outdoor activities. A great location for tourists seeking nature and tranquility with opportunities for fishing, boating, and wildlife watching. | Manistique Lake, Kalkaska Trout Festival, Hiawatha National Forest, Cedar Lake, Fishing and boating activities |
| Lake Michigan Shoreline | Picturesque shoreline famous for its sandy beaches and charming small towns. This area attracts summer tourists for beach activities, and family vacations, making it ideal for vacation rentals. | Lake Michigan beaches, Ludington State Park, Silver Lake Sand Dunes, Saugatuck Dunes State Park, Charming beach towns |
| Tahquamenon Falls State Park | A natural wonder featuring beautiful waterfalls and hiking trails. It draws nature lovers and outdoor enthusiasts, great for eco-tourism Airbnb experiences. | Tahquamenon Falls, Hiking trails, Wildlife sighting, Picnicking areas, Scenic views |
| Pictured Rocks National Lakeshore | Stunning natural beauty with dramatic cliffs and clear waters. A unique location that brings in outdoor adventurers and photographers. | Pictured Rocks cliffs, Hiking trails, Kayaking tours, Scenic boat tours, Wildlife viewing |
| Soo Locks | Historic locks that connect Lake Superior and Lake Huron. Attracts visitors interested in maritime history and Great Lakes shipping activities. | Soo Locks, Great Lakes ships, Point Iroquois Lighthouse, History of the locks, Local museums |
| St. Ignace | Gateway to Mackinac Island and a hub for tourists exploring the northern Michigan wilderness. Offers charming sites and easy access to outdoor adventures. | Mackinac Island ferry, Fort de Buade Museum, Historic buildings, Local dining, Great outdoors access |
| Kalamazoo River Valley | Known for its beautiful riverside parks and recreational activities. Popular with locals and tourists for outdoor fun including hiking and cycling. | Kalamazoo Nature Center, Hiking and biking trails, Riverside parks, Fishing spots, Food and beverage festivals |
| Charlevoix | Charming small town known for its beautiful lakefront and various cultural events. A popular summer destination for family gatherings and vacationers. | Lake Charlevoix, Downtown Charlevoix, Local shops and markets, Annual craft fairs, Biking and walking paths |
Understanding Airbnb License Requirements & STR Laws in Germfask (2026)
While Germfask, Michigan, United States currently shows low STR regulations, specific Airbnb license requirements might still exist or change. Always verify the latest short term rental regulations and Airbnb license requirements directly with local government authorities for Germfask to ensure full compliance before hosting.
(Source: AirROI data, 2026, finding no licensed listings among those analyzed)
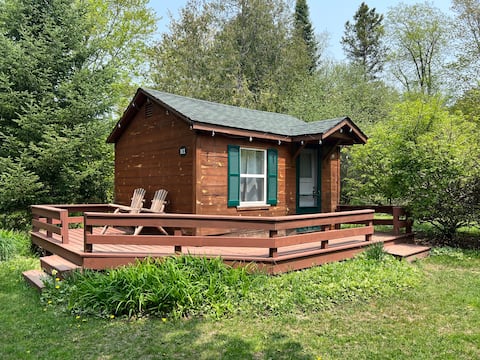
Top Performing Airbnb Properties in Germfask (2026)
Benchmark your potential! Explore examples of top-performing Airbnb properties in Germfaskbased on Trailing Twelve Month (TTM) revenue. Analyze their characteristics, revenue, occupancy rate, and ADR to understand what drives success in this market.

Seney Cabin with hot tub
Entire Place • 2 bedrooms

The Norwegian Woods River Cabin
Entire Place • 3 bedrooms

Yooper Outdoor Cabin
Entire Place • 3 bedrooms

Riverfront Cabin #2
Entire Place • 1 bedroom
Riverfront Cabin #1
Entire Place • 1 bedroom
Deluxe Cabin-Manistique River
Entire Place • 1 bedroom
Note: Performance varies based on location, size, amenities, seasonality, and management quality. Data reflects the past 12 months.
Top Performing Airbnb Hosts in Germfask (2026)
Learn from the best! This table showcases top-performing Airbnb hosts in Germfask based on the number of properties managed and estimated total revenue over the past year. Analyze their scale and performance metrics.
| Host Name | Properties | Grossing Revenue | Stay Reviews | Avg Rating |
|---|---|---|---|---|
| John And Melissa | 6 | $130,875 | 453 | 4.93/5.0 |
| Durea | 10 | $129,492 | 339 | 4.95/5.0 |
| Kimberly | 1 | $60,050 | 76 | 5.00/5.0 |
| John | 1 | $39,346 | 88 | 4.94/5.0 |
| Kate | 1 | $12,299 | 19 | 4.84/5.0 |
Analyzing the strategies of top hosts, such as their property selection, pricing, and guest communication, can offer valuable lessons for optimizing your own Airbnb operations in Germfask.
Dive Deeper: Advanced Germfask STR Market Data (2026)
Ready to unlock more insights? AirROI provides access to advanced metrics and comprehensive Airbnb data for Germfask. Explore detailed analytics beyond this report to refine your investment strategy, optimize pricing, and maximize your vacation rental profits.
Explore Advanced MetricsGermfask Short-Term Rental Market Composition (2026): Property & Room Types
Room Type Distribution
Property Type Distribution
Market Composition Insights for Germfask
- The Germfask Airbnb market composition is heavily skewed towards Entire Home/Apt listings, which make up 100% of the 19 active rentals. This indicates strong guest preference for privacy and space.
- Looking at the property type distribution in Germfask, Outdoor/Unique properties are the most common (100%), reflecting the local real estate landscape.
Germfask Airbnb Room Capacity Analysis (2026): Bedroom Distribution
Distribution of Listings by Number of Bedrooms
Room Capacity Insights for Germfask
- The dominant room capacity in Germfask is 1 bedroom listings, making up 42.1% of the market. This suggests a strong demand for properties suitable for couples or solo travelers.
- Together, 1 bedroom and 2 bedrooms properties represent 57.9% of the active Airbnb listings in Germfask, indicating a high concentration in these sizes.
Germfask Vacation Rental Guest Capacity Trends (2026)
Distribution of Listings by Guest Capacity
Guest Capacity Insights for Germfask
- The most common guest capacity trend in Germfask vacation rentals is listings accommodating 3 guests (31.6%). This suggests the primary traveler segment is likely small families or groups.
- Properties designed for 3 guests and 4 guests dominate the Germfask STR market, accounting for 57.9% of listings.
- 36.9% of properties accommodate 6+ guests, serving the market segment for larger families or group travel in Germfask.
- On average, properties in Germfask are equipped to host 4.9 guests.
Germfask Airbnb Booking Patterns (2026): Available vs. Booked Days
Available Days Distribution
Booked Days Distribution
Booking Pattern Insights for Germfask
- The most common availability pattern in Germfask falls within the 181-270 days range, representing 57.9% of listings. This suggests many properties have significant open periods on their calendars.
- Approximately 79.0% of listings show high availability (181+ days open annually), indicating potential for increased bookings or specific owner usage patterns.
- For booked days, the 91-180 days range is most frequent in Germfask (57.9%), reflecting common guest stay durations or potential owner blocking patterns.
- A notable 21.1% of properties secure long booking periods (181+ days booked per year), highlighting successful long-term rental strategies or significant owner usage.
Germfask Airbnb Minimum Stay Requirements Analysis
Distribution of Listings by Minimum Night Requirement
1 Night
7 listings
36.8% of total
2 Nights
1 listings
5.3% of total
30+ Nights
11 listings
57.9% of total
Key Insights
- The most prevalent minimum stay requirement in Germfask is 30+ Nights, adopted by 57.9% of listings. This highlights the market's preference for longer commitments.
- A significant segment (57.9%) caters to monthly stays (30+ nights) in Germfask, pointing to opportunities in the extended-stay market.
Recommendations
- Align with the market by considering a 30+ Nights minimum stay, as 57.9% of Germfask hosts use this setting.
- Explore offering discounts for stays of 30+ nights to attract the 57.9% of the market seeking extended stays.
- Adjust minimum nights based on seasonality – potentially shorter during low season and longer during peak demand periods in Germfask.
Germfask Airbnb Cancellation Policy Trends Analysis (2026)
Moderate
4 listings
21.1% of total
Firm
15 listings
78.9% of total
Cancellation Policy Insights for Germfask
- The prevailing Airbnb cancellation policy trend in Germfask is Firm, used by 78.9% of listings.
- A majority (78.9%) of hosts in Germfask utilize Firm or Strict policies, indicating a market where hosts prioritize booking security.
Recommendations for Hosts
- Consider adopting a Firm policy to align with the 78.9% market standard in Germfask.
- Regularly review your cancellation policy against competitors and market demand shifts in Germfask.
Germfask STR Booking Lead Time Analysis (2026)
Average Booking Lead Time by Month
Booking Lead Time Insights for Germfask
- The overall average booking lead time for vacation rentals in Germfask is 75 days.
- Guests book furthest in advance for stays during March (average 146 days), likely coinciding with peak travel demand or local events.
- The shortest booking windows occur for stays in May (average 38 days), indicating more last-minute travel plans during this time.
- Seasonally, Spring (100 days avg.) sees the longest lead times, while Winter (63 days avg.) has the shortest, reflecting typical travel planning cycles.
Recommendations for Hosts
- Use the overall average lead time (75 days) as a baseline for your pricing and availability strategy in Germfask.
- For March stays, consider implementing length-of-stay discounts or slightly higher rates for bookings made less than 146 days out to capitalize on advance planning.
- Target marketing efforts for the Spring season well in advance (at least 100 days) to capture early planners.
- Monitor your own booking lead times against these Germfask averages to identify opportunities for dynamic pricing adjustments.
Popular & Essential Airbnb Amenities in Germfask (2026)
Amenity Prevalence
Amenity Insights for Germfask
- Essential amenities in Germfask that guests expect include: Fire pit. Lacking these (this) could significantly impact bookings.
- Popular amenities like BBQ grill, Wifi, Heating are common but not universal. Offering these can provide a competitive edge.
- Warning: Wifi is not universally provided but is considered essential globally. Ensure reliable Wifi is offered.
Recommendations for Hosts
- Ensure your listing includes all essential amenities for Germfask: Fire pit.
- Consider adding popular differentiators like BBQ grill or Wifi to increase appeal.
- Highlight unique or less common amenities you offer (e.g., hot tub, dedicated workspace, EV charger) in your listing description and photos.
- Regularly check competitor amenities in Germfask to stay competitive.
Germfask Airbnb Guest Demographics & Profile Analysis (2026)
Guest Profile Summary for Germfask
- The typical guest profile for Airbnb in Germfask consists of primarily domestic travelers (97%), often arriving from nearby Grand Rapids, typically belonging to the Post-2000s (Gen Z/Alpha) group (50%), primarily speaking English or Spanish.
- Domestic travelers account for 96.8% of guests.
- Key international markets include United States (96.8%) and DC (1.3%).
- Top languages spoken are English (79.7%) followed by Spanish (6.8%).
- A significant demographic segment is the Post-2000s (Gen Z/Alpha) group, representing 50% of guests.
Recommendations for Hosts
- Target domestic marketing efforts towards travelers from Grand Rapids and Ann Arbor.
- Tailor amenities and listing descriptions to appeal to the dominant Post-2000s (Gen Z/Alpha) demographic (e.g., highlight fast WiFi, smart home features, local guides).
- Highlight unique local experiences or amenities relevant to the primary guest profile.
- Consider seasonal promotions aligned with peak travel times for key origin markets.
Nearby Short-Term Rental Market Comparison
How does the Germfask Airbnb market stack up against its neighbors? Compare key performance metrics like average monthly revenue, ADR, and occupancy rates in surrounding areas to understand the broader regional STR landscape.
| Market | Active Properties | Monthly Revenue | Daily Rate | Avg. Occupancy |
|---|---|---|---|---|
| Friendship Township | 13 | $6,163 | $463.78 | 51% |
| West Traverse Township | 33 | $4,561 | $529.20 | 39% |
| Leelanau Township | 47 | $4,555 | $413.00 | 51% |
| Wilson Township | 14 | $4,526 | $467.32 | 33% |
| Walloon Lake | 27 | $4,518 | $481.15 | 41% |
| Livingston Township | 11 | $4,487 | $338.56 | 51% |
| Marquette Township | 17 | $4,413 | $325.95 | 49% |
| Beaugrand Township | 20 | $4,399 | $352.59 | 53% |
| Maple River Township | 11 | $4,284 | $362.75 | 43% |
| Marion Township | 16 | $4,121 | $382.52 | 38% |