City of Frankenmuth Airbnb Market Analysis 2026: Short Term Rental Data & Vacation Rental Statistics in Michigan, United States
Is Airbnb profitable in City of Frankenmuth in 2026? Explore comprehensive Airbnb analytics for City of Frankenmuth, Michigan, United States to uncover income potential. This 2026 STR market report for City of Frankenmuth, based on AirROI data from February 2025 to January 2026, reveals key trends in the niche market of 31 active listings.
Whether you're considering an Airbnb investment in City of Frankenmuth, optimizing your existing vacation rental, or exploring rental arbitrage opportunities, understanding the City of Frankenmuth Airbnb data is crucial. Leveraging the low regulation environment is key to maximizing your short term rental income potential. Let's dive into the specifics.
Key City of Frankenmuth Airbnb Performance Metrics Overview
Monthly Airbnb Revenue Variations & Income Potential in City of Frankenmuth (2026)
Understanding the monthly revenue variations for Airbnb listings in City of Frankenmuth is key to maximizing your short term rental income potential. Seasonality significantly impacts earnings. Our analysis, based on data from the past 12 months, shows that the peak revenue month for STRs in City of Frankenmuth is typically December, while February often presents the lowest earnings, highlighting opportunities for strategic pricing adjustments during shoulder and low seasons. Explore the typical Airbnb income in City of Frankenmuth across different performance tiers:
- Best-in-class properties (Top 10%) achieve $7,733+ monthly, often utilizing dynamic pricing and superior guest experiences.
- Strong performing properties (Top 25%) earn $6,415 or more, indicating effective management and desirable locations/amenities.
- Typical properties (Median) generate around $4,713 per month, representing the average market performance.
- Entry-level properties (Bottom 25%) see earnings around $3,537, often with potential for optimization.
Average Monthly Airbnb Earnings Trend in City of Frankenmuth
City of Frankenmuth Airbnb Occupancy Rate Trends (2026)
Maximize your bookings by understanding the City of Frankenmuth STR occupancy trends. Seasonal demand shifts significantly influence how often properties are booked. Typically, Decembersees the highest demand (peak season occupancy), while February experiences the lowest (low season). Effective strategies, like adjusting minimum stays or offering promotions, can boost occupancy during slower periods. Here's how different property tiers perform in City of Frankenmuth:
- Best-in-class properties (Top 10%) achieve 75%+ occupancy, indicating high desirability and potentially optimized availability.
- Strong performing properties (Top 25%) maintain 64% or higher occupancy, suggesting good market fit and guest satisfaction.
- Typical properties (Median) have an occupancy rate around 51%.
- Entry-level properties (Bottom 25%) average 39% occupancy, potentially facing higher vacancy.
Average Monthly Occupancy Rate Trend in City of Frankenmuth
Average Daily Rate (ADR) Airbnb Trends in City of Frankenmuth (2026)
Effective short term rental pricing strategy in City of Frankenmuth involves understanding monthly ADR fluctuations. The Average Daily Rate (ADR) for Airbnb in City of Frankenmuth typically peaks in June and dips lowest during February. Leveraging Airbnb dynamic pricing tools or strategies based on this seasonality can significantly boost revenue. Here's a look at the typical nightly rates achieved:
- Best-in-class properties (Top 10%) command rates of $461+ per night, often due to premium features or locations.
- Strong performing properties (Top 25%) achieve nightly rates of $404 or more.
- Typical properties (Median) charge around $317 per night.
- Entry-level properties (Bottom 25%) earn around $199 per night.
Average Daily Rate (ADR) Trend by Month in City of Frankenmuth
Get Live City of Frankenmuth Market Intelligence 👇

Explore Real-time Analytics
Airbnb Seasonality Analysis & Trends in City of Frankenmuth (2026)
Peak Season (December, July, August)
- Revenue averages $6,944 per month
- Occupancy rates average 67.3%
- Daily rates average $329
Shoulder Season
- Revenue averages $5,239 per month
- Occupancy maintains around 52.8%
- Daily rates hold near $325
Low Season (February, March, April)
- Revenue drops to average $2,910 per month
- Occupancy decreases to average 33.7%
- Daily rates adjust to average $301
Seasonality Insights for City of Frankenmuth
- The Airbnb seasonality in City of Frankenmuth shows highly seasonal trends requiring careful strategy. While the sections above show seasonal averages, it's also insightful to look at the extremes:
- During the high season, the absolute peak month showcases City of Frankenmuth's highest earning potential, with monthly revenues capable of climbing to $7,250, occupancy reaching a high of 70.9%, and ADRs peaking at $348.
- Conversely, the slowest single month of the year, typically falling within the low season, marks the market's lowest point. In this month, revenue might dip to $2,401, occupancy could drop to 31.4%, and ADRs may adjust down to $297.
- Understanding both the seasonal averages and these monthly peaks and troughs in revenue, occupancy, and ADR is crucial for maximizing your Airbnb profit potential in City of Frankenmuth.
Seasonal Strategies for Maximizing Profit
- Peak Season: Maximize revenue through premium pricing and potentially longer minimum stays. Ensure high availability.
- Low Season: Offer competitive pricing, special promotions (e.g., extended stay discounts), and flexible cancellation policies. Target off-season travelers like remote workers or budget-conscious guests.
- Shoulder Seasons: Implement dynamic pricing that balances peak and low rates. Target weekend travelers or specific events. Offer slightly more flexible terms than peak season.
- Regularly analyze your own performance against these City of Frankenmuth seasonality benchmarks and adjust your pricing and availability strategy accordingly.
Best Areas for Airbnb Investment in City of Frankenmuth (2026)
Exploring the top neighborhoods for short-term rentals in City of Frankenmuth? This section highlights key areas, outlining why they are attractive for hosts and guests, along with notable local attractions. Consider these locations based on your target guest profile and investment strategy.
| Neighborhood / Area | Why Host Here? (Target Guests & Appeal) | Key Attractions & Landmarks |
|---|---|---|
| Downtown Frankenmuth | The heart of Frankenmuth, known for its charming Bavarian-style buildings and vibrant shopping. A prime location for tourists enjoying local attractions and events. | Bavarian Inn Restaurant, Zeilinger's Cheese Shoppe, Frankenmuth River Place Shops, Bronner's Christmas Wonderland, Frankenmuth Historical Museum, Frankenmuth Brewery |
| The Bavarian Inn Lodge | A family-friendly resort offering a variety of amenities and easy access to Frankenmuth's attractions. It’s a popular spot for those seeking a resort experience in a charming setting. | Bavarian Inn Lodge, Waterpark, Miniature Golf, Spa services, Indoor pool, Entertainment options |
| Heritage Park | A scenic park area featuring Michigan's biggest Christmas store and charming landscapes. Great for nature lovers and families visiting in the holiday season. | Bronner's Christmas Wonderland, Walking trails, Picnic areas, Playgrounds |
| Frankenmuth Riverwalk | A picturesque walkway along the Cass River that showcases the beauty of Frankenmuth. Ideal for tourists looking to explore the scenic landscapes and local wildlife. | Riverwalk trail, Fishing areas, Scenic views, Seating areas, Wildlife observation |
| Main Street | The main thoroughfare with unique shops, eateries, and cafes that showcase the local culture and community spirit. A vibrant place for tourists and locals alike. | Zehnder's Restaurant, Frankenmuth Cheese Haus, Local boutiques, Ice cream shops, Gift stores |
| Frankenmuth Historical Museum | An educational and cultural resource showing the rich history of Frankenmuth. Perfect for history buffs and families. | Exhibits on local history, Interactive displays, Guided tours |
| The Silent Night Chapel | A peaceful chapel representing tranquility and a popular spot for weddings and quiet reflection. Visitors enjoy the serene atmosphere. | Beautiful architecture, Landscaped gardens, Peaceful environment |
| Frankenmuth Festivals | Home to iconic festivals throughout the year, attracting visitors from all over. Great for travelers looking to experience local culture and fun events. | World's Largest Christmas Store, Frankenmuth Beer Fest, Zeigler's Heritage Festival, Bier Fest, Summer Music Series |
Understanding Airbnb License Requirements & STR Laws in City of Frankenmuth (2026)
While City of Frankenmuth, Michigan, United States currently shows low STR regulations, specific Airbnb license requirements might still exist or change. Always verify the latest short term rental regulations and Airbnb license requirements directly with local government authorities for City of Frankenmuth to ensure full compliance before hosting.
(Source: AirROI data, 2026, finding no licensed listings among those analyzed)
Top Performing Airbnb Properties in City of Frankenmuth (2026)
Benchmark your potential! Explore examples of top-performing Airbnb properties in City of Frankenmuthbased on Trailing Twelve Month (TTM) revenue. Analyze their characteristics, revenue, occupancy rate, and ADR to understand what drives success in this market.
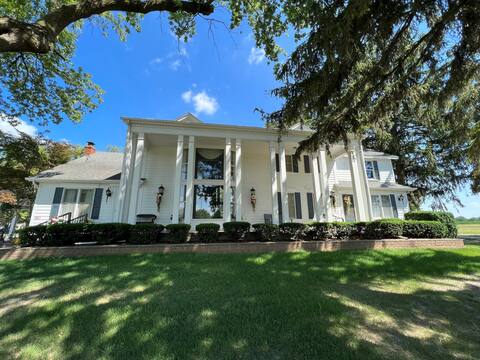
Historic Estate located in downtown Frankenmuth
Entire Place • 5 bedrooms
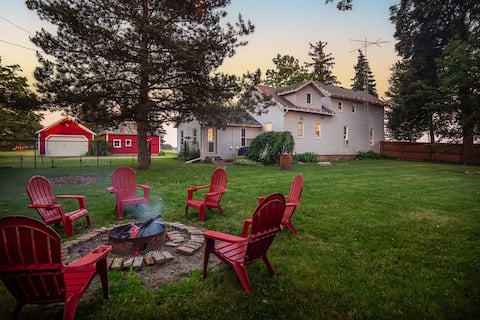
Frankenmuth Christmas Farmhouse | HugeLot | PetsOK
Entire Place • 5 bedrooms
The Odd Dog Retreat w/HotTub, Kayaks, Bikes, Games
Entire Place • 4 bedrooms

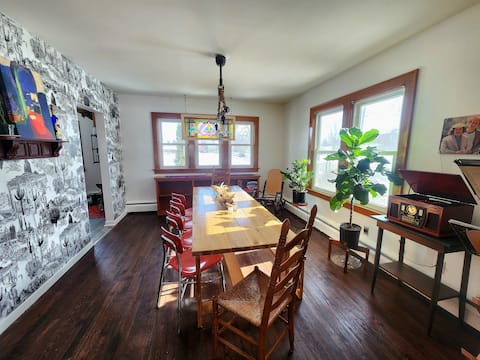
Frankenmuth Harmony House
Entire Place • 5 bedrooms
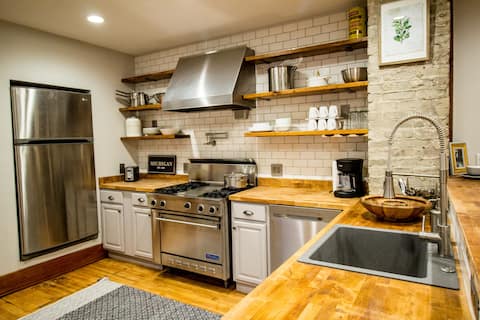
Entire House with a hot tub.
Entire Place • 5 bedrooms
Dwntwn Chocolate Haus Apt&Balc.10%off 3n/20%off 4n
Entire Place • 2 bedrooms
Note: Performance varies based on location, size, amenities, seasonality, and management quality. Data reflects the past 12 months.
Top Performing Airbnb Hosts in City of Frankenmuth (2026)
Learn from the best! This table showcases top-performing Airbnb hosts in City of Frankenmuth based on the number of properties managed and estimated total revenue over the past year. Analyze their scale and performance metrics.
| Host Name | Properties | Grossing Revenue | Stay Reviews | Avg Rating |
|---|---|---|---|---|
| Elliot | 4 | $249,791 | 167 | 4.89/5.0 |
| Carol | 3 | $212,727 | 503 | 4.96/5.0 |
| Kaeley | 2 | $142,885 | 921 | 4.87/5.0 |
| Bavarian | 1 | $128,567 | 43 | 4.91/5.0 |
| Andrew | 2 | $118,198 | 360 | 4.89/5.0 |
| Chris | 2 | $107,971 | 410 | 4.95/5.0 |
| Krista | 3 | $105,430 | 185 | 4.93/5.0 |
| StayDogRentals - Jason | 1 | $96,576 | 74 | 4.80/5.0 |
| Mackenzie | 1 | $94,196 | 135 | 4.99/5.0 |
| Tabitha | 1 | $69,683 | 85 | 4.95/5.0 |
Analyzing the strategies of top hosts, such as their property selection, pricing, and guest communication, can offer valuable lessons for optimizing your own Airbnb operations in City of Frankenmuth.
Dive Deeper: Advanced City of Frankenmuth STR Market Data (2026)
Ready to unlock more insights? AirROI provides access to advanced metrics and comprehensive Airbnb data for City of Frankenmuth. Explore detailed analytics beyond this report to refine your investment strategy, optimize pricing, and maximize your vacation rental profits.
Explore Advanced MetricsCity of Frankenmuth Short-Term Rental Market Composition (2026): Property & Room Types
Room Type Distribution
Property Type Distribution
Market Composition Insights for City of Frankenmuth
- The City of Frankenmuth Airbnb market composition is heavily skewed towards Entire Home/Apt listings, which make up 87.1% of the 31 active rentals. This indicates strong guest preference for privacy and space.
- Looking at the property type distribution in City of Frankenmuth, House properties are the most common (74.2%), reflecting the local real estate landscape.
- Houses represent a significant 74.2% portion, catering likely to families or larger groups.
- Smaller segments like others (combined 3.2%) offer potential for unique stay experiences.
City of Frankenmuth Airbnb Room Capacity Analysis (2026): Bedroom Distribution
Distribution of Listings by Number of Bedrooms
Room Capacity Insights for City of Frankenmuth
- The dominant room capacity in City of Frankenmuth is 2 bedrooms listings, making up 32.3% of the market. This suggests a strong demand for properties suitable for couples or solo travelers.
- Together, 2 bedrooms and 4 bedrooms properties represent 58.1% of the active Airbnb listings in City of Frankenmuth, indicating a high concentration in these sizes.
- A significant 54.9% of listings offer 3+ bedrooms, catering to larger groups and families seeking more space in City of Frankenmuth.
City of Frankenmuth Vacation Rental Guest Capacity Trends (2026)
Distribution of Listings by Guest Capacity
Guest Capacity Insights for City of Frankenmuth
- The most common guest capacity trend in City of Frankenmuth vacation rentals is listings accommodating 8+ guests (51.6%). This suggests the primary traveler segment is likely larger groups.
- Properties designed for 8+ guests and 6 guests dominate the City of Frankenmuth STR market, accounting for 67.7% of listings.
- 74.2% of properties accommodate 6+ guests, serving the market segment for larger families or group travel in City of Frankenmuth.
- On average, properties in City of Frankenmuth are equipped to host 6.3 guests.
City of Frankenmuth Airbnb Booking Patterns (2026): Available vs. Booked Days
Available Days Distribution
Booked Days Distribution
Booking Pattern Insights for City of Frankenmuth
- The most common availability pattern in City of Frankenmuth falls within the 91-180 days range, representing 51.6% of listings. This suggests many properties have significant open periods on their calendars.
- Approximately 45.1% of listings show high availability (181+ days open annually), indicating potential for increased bookings or specific owner usage patterns.
- For booked days, the 181-270 days range is most frequent in City of Frankenmuth (51.6%), reflecting common guest stay durations or potential owner blocking patterns.
- A notable 54.8% of properties secure long booking periods (181+ days booked per year), highlighting successful long-term rental strategies or significant owner usage.
City of Frankenmuth Airbnb Minimum Stay Requirements Analysis
Distribution of Listings by Minimum Night Requirement
1 Night
9 listings
29% of total
2 Nights
15 listings
48.4% of total
30+ Nights
7 listings
22.6% of total
Key Insights
- The most prevalent minimum stay requirement in City of Frankenmuth is 2 Nights, adopted by 48.4% of listings. This highlights the market's preference for shorter, flexible bookings.
- A strong majority (77.4%) of the City of Frankenmuth Airbnb data shows acceptance of very short stays (1-2 nights), indicating a dynamic, high-turnover market.
- A significant segment (22.6%) caters to monthly stays (30+ nights) in City of Frankenmuth, pointing to opportunities in the extended-stay market.
Recommendations
- Align with the market by considering a 2 Nights minimum stay, as 48.4% of City of Frankenmuth hosts use this setting.
- If feasible, allowing 1-night stays, especially midweek or during low season, could capture last-minute bookings, as only 29% currently do.
- Explore offering discounts for stays of 30+ nights to attract the 22.6% of the market seeking extended stays.
- Adjust minimum nights based on seasonality – potentially shorter during low season and longer during peak demand periods in City of Frankenmuth.
City of Frankenmuth Airbnb Cancellation Policy Trends Analysis (2026)
Limited
1 listings
3.2% of total
Super Strict 60 Days
1 listings
3.2% of total
Flexible
2 listings
6.5% of total
Moderate
6 listings
19.4% of total
Firm
14 listings
45.2% of total
Strict
7 listings
22.6% of total
Cancellation Policy Insights for City of Frankenmuth
- The prevailing Airbnb cancellation policy trend in City of Frankenmuth is Firm, used by 45.2% of listings.
- A majority (67.8%) of hosts in City of Frankenmuth utilize Firm or Strict policies, indicating a market where hosts prioritize booking security.
Recommendations for Hosts
- Consider adopting a Firm policy to align with the 45.2% market standard in City of Frankenmuth.
- Regularly review your cancellation policy against competitors and market demand shifts in City of Frankenmuth.
City of Frankenmuth STR Booking Lead Time Analysis (2026)
Average Booking Lead Time by Month
Booking Lead Time Insights for City of Frankenmuth
- The overall average booking lead time for vacation rentals in City of Frankenmuth is 94 days.
- Guests book furthest in advance for stays during September (average 145 days), likely coinciding with peak travel demand or local events.
- The shortest booking windows occur for stays in March (average 40 days), indicating more last-minute travel plans during this time.
- Seasonally, Fall (127 days avg.) sees the longest lead times, while Spring (75 days avg.) has the shortest, reflecting typical travel planning cycles.
Recommendations for Hosts
- Use the overall average lead time (94 days) as a baseline for your pricing and availability strategy in City of Frankenmuth.
- For September stays, consider implementing length-of-stay discounts or slightly higher rates for bookings made less than 145 days out to capitalize on advance planning.
- Target marketing efforts for the Fall season well in advance (at least 127 days) to capture early planners.
- Monitor your own booking lead times against these City of Frankenmuth averages to identify opportunities for dynamic pricing adjustments.
Popular & Essential Airbnb Amenities in City of Frankenmuth (2026)
Amenity Prevalence
Amenity Insights for City of Frankenmuth
- Essential amenities in City of Frankenmuth that guests expect include: Fire extinguisher, Coffee maker, Free parking on premises, TV, Air conditioning, Smoke alarm, Hot water, Heating, Wifi, Carbon monoxide alarm. Lacking these (any) could significantly impact bookings.
Recommendations for Hosts
- Ensure your listing includes all essential amenities for City of Frankenmuth: Fire extinguisher, Coffee maker, Free parking on premises, TV, Air conditioning, Smoke alarm, Hot water, Heating, Wifi, Carbon monoxide alarm.
- Prioritize adding missing essentials: Carbon monoxide alarm.
- Highlight unique or less common amenities you offer (e.g., hot tub, dedicated workspace, EV charger) in your listing description and photos.
- Regularly check competitor amenities in City of Frankenmuth to stay competitive.
City of Frankenmuth Airbnb Guest Demographics & Profile Analysis (2026)
Guest Profile Summary for City of Frankenmuth
- The typical guest profile for Airbnb in City of Frankenmuth consists of primarily domestic travelers (97%), often arriving from nearby Michigan, typically belonging to the Post-2000s (Gen Z/Alpha) group (50%), primarily speaking English or Spanish.
- Domestic travelers account for 96.7% of guests.
- Key international markets include United States (96.7%) and Canada (1.9%).
- Top languages spoken are English (85.3%) followed by Spanish (3.7%).
- A significant demographic segment is the Post-2000s (Gen Z/Alpha) group, representing 50% of guests.
Recommendations for Hosts
- Target domestic marketing efforts towards travelers from Michigan and Grand Rapids.
- Tailor amenities and listing descriptions to appeal to the dominant Post-2000s (Gen Z/Alpha) demographic (e.g., highlight fast WiFi, smart home features, local guides).
- Highlight unique local experiences or amenities relevant to the primary guest profile.
- Consider seasonal promotions aligned with peak travel times for key origin markets.
Nearby Short-Term Rental Market Comparison
How does the City of Frankenmuth Airbnb market stack up against its neighbors? Compare key performance metrics like average monthly revenue, ADR, and occupancy rates in surrounding areas to understand the broader regional STR landscape.
| Market | Active Properties | Monthly Revenue | Daily Rate | Avg. Occupancy |
|---|---|---|---|---|
| Scio Township | 18 | $5,101 | $764.17 | 43% |
| Forester | 12 | $4,952 | $407.81 | 39% |
| Port Sanilac | 32 | $4,603 | $470.83 | 37% |
| Grass Lake Charter Township | 14 | $4,410 | $365.88 | 45% |
| Ann Arbor | 487 | $4,080 | $443.76 | 43% |
| Norvell Township | 12 | $3,830 | $321.76 | 49% |
| Chester Township | 14 | $3,724 | $344.92 | 41% |
| Leoni Township | 13 | $3,682 | $275.71 | 52% |
| Otsego Lake Township | 26 | $3,680 | $308.57 | 39% |
| Harrison Township | 28 | $3,639 | $303.29 | 45% |