Charlevoix Airbnb Market Analysis 2026: Short Term Rental Data & Vacation Rental Statistics in Michigan, United States
Is Airbnb profitable in Charlevoix in 2026? Explore comprehensive Airbnb analytics for Charlevoix, Michigan, United States to uncover income potential. This 2026 STR market report for Charlevoix, based on AirROI data from February 2025 to January 2026, reveals key trends in the market of 203 active listings.
Whether you're considering an Airbnb investment in Charlevoix, optimizing your existing vacation rental, or exploring rental arbitrage opportunities, understanding the Charlevoix Airbnb data is crucial. Leveraging the low regulation environment is key to maximizing your short term rental income potential. Let's dive into the specifics.
Key Charlevoix Airbnb Performance Metrics Overview
Monthly Airbnb Revenue Variations & Income Potential in Charlevoix (2026)
Understanding the monthly revenue variations for Airbnb listings in Charlevoix is key to maximizing your short term rental income potential. Seasonality significantly impacts earnings. Our analysis, based on data from the past 12 months, shows that the peak revenue month for STRs in Charlevoix is typically July, while March often presents the lowest earnings, highlighting opportunities for strategic pricing adjustments during shoulder and low seasons. Explore the typical Airbnb income in Charlevoix across different performance tiers:
- Best-in-class properties (Top 10%) achieve $7,832+ monthly, often utilizing dynamic pricing and superior guest experiences.
- Strong performing properties (Top 25%) earn $4,801 or more, indicating effective management and desirable locations/amenities.
- Typical properties (Median) generate around $2,958 per month, representing the average market performance.
- Entry-level properties (Bottom 25%) see earnings around $1,498, often with potential for optimization.
Average Monthly Airbnb Earnings Trend in Charlevoix
Charlevoix Airbnb Occupancy Rate Trends (2026)
Maximize your bookings by understanding the Charlevoix STR occupancy trends. Seasonal demand shifts significantly influence how often properties are booked. Typically, Julysees the highest demand (peak season occupancy), while January experiences the lowest (low season). Effective strategies, like adjusting minimum stays or offering promotions, can boost occupancy during slower periods. Here's how different property tiers perform in Charlevoix:
- Best-in-class properties (Top 10%) achieve 66%+ occupancy, indicating high desirability and potentially optimized availability.
- Strong performing properties (Top 25%) maintain 50% or higher occupancy, suggesting good market fit and guest satisfaction.
- Typical properties (Median) have an occupancy rate around 31%.
- Entry-level properties (Bottom 25%) average 16% occupancy, potentially facing higher vacancy.
Average Monthly Occupancy Rate Trend in Charlevoix
Average Daily Rate (ADR) Airbnb Trends in Charlevoix (2026)
Effective short term rental pricing strategy in Charlevoix involves understanding monthly ADR fluctuations. The Average Daily Rate (ADR) for Airbnb in Charlevoix typically peaks in July and dips lowest during March. Leveraging Airbnb dynamic pricing tools or strategies based on this seasonality can significantly boost revenue. Here's a look at the typical nightly rates achieved:
- Best-in-class properties (Top 10%) command rates of $628+ per night, often due to premium features or locations.
- Strong performing properties (Top 25%) achieve nightly rates of $428 or more.
- Typical properties (Median) charge around $298 per night.
- Entry-level properties (Bottom 25%) earn around $219 per night.
Average Daily Rate (ADR) Trend by Month in Charlevoix
Get Live Charlevoix Market Intelligence 👇

Explore Real-time Analytics
Airbnb Seasonality Analysis & Trends in Charlevoix (2026)
Peak Season (July, August, June)
- Revenue averages $7,706 per month
- Occupancy rates average 52.4%
- Daily rates average $437
Shoulder Season
- Revenue averages $2,960 per month
- Occupancy maintains around 31.4%
- Daily rates hold near $346
Low Season (January, February, March)
- Revenue drops to average $1,633 per month
- Occupancy decreases to average 22.5%
- Daily rates adjust to average $319
Seasonality Insights for Charlevoix
- The Airbnb seasonality in Charlevoix shows highly seasonal trends requiring careful strategy. While the sections above show seasonal averages, it's also insightful to look at the extremes:
- During the high season, the absolute peak month showcases Charlevoix's highest earning potential, with monthly revenues capable of climbing to $10,250, occupancy reaching a high of 64.7%, and ADRs peaking at $451.
- Conversely, the slowest single month of the year, typically falling within the low season, marks the market's lowest point. In this month, revenue might dip to $1,335, occupancy could drop to 19.7%, and ADRs may adjust down to $317.
- Understanding both the seasonal averages and these monthly peaks and troughs in revenue, occupancy, and ADR is crucial for maximizing your Airbnb profit potential in Charlevoix.
Seasonal Strategies for Maximizing Profit
- Peak Season: Maximize revenue through premium pricing and potentially longer minimum stays. Ensure high availability.
- Low Season: Offer competitive pricing, special promotions (e.g., extended stay discounts), and flexible cancellation policies. Target off-season travelers like remote workers or budget-conscious guests.
- Shoulder Seasons: Implement dynamic pricing that balances peak and low rates. Target weekend travelers or specific events. Offer slightly more flexible terms than peak season.
- Regularly analyze your own performance against these Charlevoix seasonality benchmarks and adjust your pricing and availability strategy accordingly.
Best Areas for Airbnb Investment in Charlevoix (2026)
Exploring the top neighborhoods for short-term rentals in Charlevoix? This section highlights key areas, outlining why they are attractive for hosts and guests, along with notable local attractions. Consider these locations based on your target guest profile and investment strategy.
| Neighborhood / Area | Why Host Here? (Target Guests & Appeal) | Key Attractions & Landmarks |
|---|---|---|
| Petoskey | A picturesque lakeside town known for its charming downtown area and outdoor activities. Perfect for travelers seeking relaxation and nature, as well as local dining and shops. | Petoskey State Park, Downtown Petoskey, Lake Michigan, Tunnel of Trees, Petoskey Stone Shopping |
| Harbor Springs | A quaint resort town with stunning views of Little Traverse Bay, attracting visitors for its upscale dining and boutique shopping. Ideal for tourists looking for a peaceful retreat in nature. | Harbor Springs Waterfront, Boyne Highlands Resort, North Country Trail, Dockside Park, Mackinaw Island Ferries |
| Boyne City | A vibrant small town on Lake Charlevoix known for its marina and outdoor recreation opportunities. Popular for those interested in fishing, boating, and local festivals. | Lake Charlevoix, Boyne City Park, Farmers Market, Avalanche Mountain, Boyne River |
| Charlevoix | Known for its unique Mushroom Houses and beautiful waterfront, Charlevoix is a popular tourist destination. Visitors enjoy its scenic landscape and friendly atmosphere. | Charlevoix Harbor, Mushroom Houses, Lake Michigan, Ferry to Beaver Island, Charlevoix Circle of Arts |
| Lake Charlevoix | A stunning lake that offers various water activities and scenic cottage rentals. It attracts families and watersport enthusiasts looking for summer fun. | Sunset Beach, Irontone Springs, Lake Charlevoix State Park, Beaver Island Boat Company, Various Sailing Regattas |
| East Jordan | A small town with a charming atmosphere and close access to Lake Charlevoix, it appeals to those looking for a quiet getaway with nearby hiking and boating opportunities. | East Jordan River, Lake Charlevoix, Jordan Valley District Library, Sierra Club Trails |
| Boyer's Pond | A hidden gem for nature lovers, Boyer's Pond is a serene location for those seeking peace and tranquility near water and forest. | Boyer's Pond Park, Bird Watching, Fishing, Nature Trails |
| Alanson | A small village on the Crooked River, Alanson serves as a gateway to the inland lakes and offers a quiet atmosphere for visitors looking to escape the hustle. | Crooked River, Alanson Village Park, Bike Trails, Nearby Lakes |
Understanding Airbnb License Requirements & STR Laws in Charlevoix (2026)
While Charlevoix, Michigan, United States currently shows low STR regulations, specific Airbnb license requirements might still exist or change. Always verify the latest short term rental regulations and Airbnb license requirements directly with local government authorities for Charlevoix to ensure full compliance before hosting.
(Source: AirROI data, 2026, finding no licensed listings among those analyzed)
Top Performing Airbnb Properties in Charlevoix (2026)
Benchmark your potential! Explore examples of top-performing Airbnb properties in Charlevoixbased on Trailing Twelve Month (TTM) revenue. Analyze their characteristics, revenue, occupancy rate, and ADR to understand what drives success in this market.

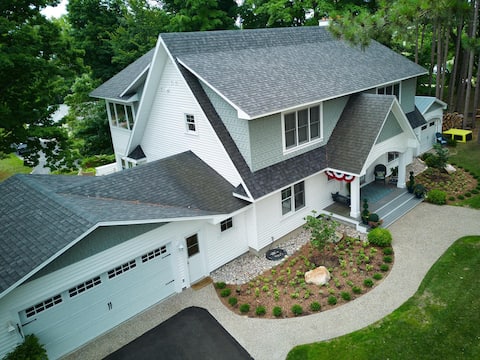
Charlevoix Lakeview Home - Sleeps 25!
Entire Place • 11 bedrooms
View of Lake Charlevoix/Walk to Downtown/Hot Tub
Entire Place • 4 bedrooms
Huge Classic Cottage Dwtn CVX! Walk everywhere!
Entire Place • 6 bedrooms
Beautiful Lakeview Home w/ 5 Bedrooms & 6k SqFt
Entire Place • 5 bedrooms

Luxury Mushroom House- Earl Young’s Personal home!
Entire Place • 3 bedrooms
Hot Tub, 2 Fireplaces, Huge, Across from Lake MI!
Entire Place • 4 bedrooms
Note: Performance varies based on location, size, amenities, seasonality, and management quality. Data reflects the past 12 months.
Top Performing Airbnb Hosts in Charlevoix (2026)
Learn from the best! This table showcases top-performing Airbnb hosts in Charlevoix based on the number of properties managed and estimated total revenue over the past year. Analyze their scale and performance metrics.
| Host Name | Properties | Grossing Revenue | Stay Reviews | Avg Rating |
|---|---|---|---|---|
| Northern Michigan Escapes | 59 | $1,084,268 | 305 | 4.51/5.0 |
| Shawn | 10 | $841,698 | 1503 | 4.96/5.0 |
| Alison | 2 | $238,854 | 35 | 4.97/5.0 |
| NoMi Vacations | 8 | $225,723 | 421 | 4.60/5.0 |
| Laura | 1 | $169,288 | 25 | 5.00/5.0 |
| Meghan | 3 | $167,465 | 141 | 4.92/5.0 |
| Jamie | 1 | $154,299 | 51 | 5.00/5.0 |
| Joseph | 2 | $150,757 | 91 | 4.95/5.0 |
| Andrew | 2 | $141,081 | 60 | 4.96/5.0 |
| Evolve | 4 | $106,200 | 201 | 4.89/5.0 |
Analyzing the strategies of top hosts, such as their property selection, pricing, and guest communication, can offer valuable lessons for optimizing your own Airbnb operations in Charlevoix.
Dive Deeper: Advanced Charlevoix STR Market Data (2026)
Ready to unlock more insights? AirROI provides access to advanced metrics and comprehensive Airbnb data for Charlevoix. Explore detailed analytics beyond this report to refine your investment strategy, optimize pricing, and maximize your vacation rental profits.
Explore Advanced MetricsCharlevoix Short-Term Rental Market Composition (2026): Property & Room Types
Room Type Distribution
Property Type Distribution
Market Composition Insights for Charlevoix
- The Charlevoix Airbnb market composition is heavily skewed towards Entire Home/Apt listings, which make up 92.1% of the 203 active rentals. This indicates strong guest preference for privacy and space.
- Looking at the property type distribution in Charlevoix, House properties are the most common (51.2%), reflecting the local real estate landscape.
- Houses represent a significant 51.2% portion, catering likely to families or larger groups.
- The presence of 7.4% Hotel/Boutique listings indicates integration with traditional hospitality.
- Smaller segments like others (combined 0.5%) offer potential for unique stay experiences.
Charlevoix Airbnb Room Capacity Analysis (2026): Bedroom Distribution
Distribution of Listings by Number of Bedrooms
Room Capacity Insights for Charlevoix
- The dominant room capacity in Charlevoix is 1 bedroom listings, making up 30.5% of the market. This suggests a strong demand for properties suitable for couples or solo travelers.
- Together, 1 bedroom and 2 bedrooms properties represent 58.6% of the active Airbnb listings in Charlevoix, indicating a high concentration in these sizes.
- A significant 36.0% of listings offer 3+ bedrooms, catering to larger groups and families seeking more space in Charlevoix.
Charlevoix Vacation Rental Guest Capacity Trends (2026)
Distribution of Listings by Guest Capacity
Guest Capacity Insights for Charlevoix
- The most common guest capacity trend in Charlevoix vacation rentals is listings accommodating 4 guests (31%). This suggests the primary traveler segment is likely small families or groups.
- Properties designed for 4 guests and 6 guests dominate the Charlevoix STR market, accounting for 58.1% of listings.
- 53.3% of properties accommodate 6+ guests, serving the market segment for larger families or group travel in Charlevoix.
- On average, properties in Charlevoix are equipped to host 5.3 guests.
Charlevoix Airbnb Booking Patterns (2026): Available vs. Booked Days
Available Days Distribution
Booked Days Distribution
Booking Pattern Insights for Charlevoix
- The most common availability pattern in Charlevoix falls within the 271-366 days range, representing 62.1% of listings. This suggests many properties have significant open periods on their calendars.
- Approximately 90.7% of listings show high availability (181+ days open annually), indicating potential for increased bookings or specific owner usage patterns.
- For booked days, the 31-90 days range is most frequent in Charlevoix (37.4%), reflecting common guest stay durations or potential owner blocking patterns.
- A notable 11.3% of properties secure long booking periods (181+ days booked per year), highlighting successful long-term rental strategies or significant owner usage.
Charlevoix Airbnb Minimum Stay Requirements Analysis
Distribution of Listings by Minimum Night Requirement
1 Night
83 listings
40.9% of total
2 Nights
22 listings
10.8% of total
3 Nights
10 listings
4.9% of total
4-6 Nights
9 listings
4.4% of total
7-29 Nights
3 listings
1.5% of total
30+ Nights
76 listings
37.4% of total
Key Insights
- The most prevalent minimum stay requirement in Charlevoix is 1 Night, adopted by 40.9% of listings. This highlights the market's preference for shorter, flexible bookings.
- A significant segment (37.4%) caters to monthly stays (30+ nights) in Charlevoix, pointing to opportunities in the extended-stay market.
Recommendations
- Align with the market by considering a 1 Night minimum stay, as 40.9% of Charlevoix hosts use this setting.
- Explore offering discounts for stays of 30+ nights to attract the 37.4% of the market seeking extended stays.
- Adjust minimum nights based on seasonality – potentially shorter during low season and longer during peak demand periods in Charlevoix.
Charlevoix Airbnb Cancellation Policy Trends Analysis (2026)
Super Strict 30 Days
13 listings
6.4% of total
Super Strict 60 Days
70 listings
34.7% of total
Flexible
8 listings
4% of total
Moderate
24 listings
11.9% of total
Firm
71 listings
35.1% of total
Strict
16 listings
7.9% of total
Cancellation Policy Insights for Charlevoix
- The prevailing Airbnb cancellation policy trend in Charlevoix is Firm, used by 35.1% of listings.
- There's a relatively balanced mix between guest-friendly (15.9%) and stricter (43.0%) policies, offering choices for different guest needs.
- Strict cancellation policies are quite rare (7.9%), potentially making listings with this policy less competitive unless justified by high demand or property type.
Recommendations for Hosts
- Consider adopting a Firm policy to align with the 35.1% market standard in Charlevoix.
- Using a Strict policy might deter some guests, as only 7.9% of listings use it. Evaluate if potential revenue protection outweighs possible lower booking rates.
- Regularly review your cancellation policy against competitors and market demand shifts in Charlevoix.
Charlevoix STR Booking Lead Time Analysis (2026)
Average Booking Lead Time by Month
Booking Lead Time Insights for Charlevoix
- The overall average booking lead time for vacation rentals in Charlevoix is 79 days.
- Guests book furthest in advance for stays during July (average 126 days), likely coinciding with peak travel demand or local events.
- The shortest booking windows occur for stays in January (average 28 days), indicating more last-minute travel plans during this time.
- Seasonally, Summer (109 days avg.) sees the longest lead times, while Winter (32 days avg.) has the shortest, reflecting typical travel planning cycles.
Recommendations for Hosts
- Use the overall average lead time (79 days) as a baseline for your pricing and availability strategy in Charlevoix.
- For July stays, consider implementing length-of-stay discounts or slightly higher rates for bookings made less than 126 days out to capitalize on advance planning.
- Target marketing efforts for the Summer season well in advance (at least 109 days) to capture early planners.
- Monitor your own booking lead times against these Charlevoix averages to identify opportunities for dynamic pricing adjustments.
Popular & Essential Airbnb Amenities in Charlevoix (2026)
Amenity Prevalence
Amenity Insights for Charlevoix
- Essential amenities in Charlevoix that guests expect include: Heating, Free parking on premises, Wifi. Lacking these (any) could significantly impact bookings.
- Popular amenities like Air conditioning, TV, Essentials are common but not universal. Offering these can provide a competitive edge.
Recommendations for Hosts
- Ensure your listing includes all essential amenities for Charlevoix: Heating, Free parking on premises, Wifi.
- Prioritize adding missing essentials: Heating, Free parking on premises, Wifi.
- Consider adding popular differentiators like Air conditioning or TV to increase appeal.
- Highlight unique or less common amenities you offer (e.g., hot tub, dedicated workspace, EV charger) in your listing description and photos.
- Regularly check competitor amenities in Charlevoix to stay competitive.
Charlevoix Airbnb Guest Demographics & Profile Analysis (2026)
Guest Profile Summary for Charlevoix
- The typical guest profile for Airbnb in Charlevoix consists of primarily domestic travelers (98%), often arriving from nearby Ann Arbor, typically belonging to the Post-2000s (Gen Z/Alpha) group (50%), primarily speaking English or Spanish.
- Domestic travelers account for 97.8% of guests.
- Key international markets include United States (97.8%) and DC (0.7%).
- Top languages spoken are English (79.9%) followed by Spanish (9%).
- A significant demographic segment is the Post-2000s (Gen Z/Alpha) group, representing 50% of guests.
Recommendations for Hosts
- Target domestic marketing efforts towards travelers from Ann Arbor and Grand Rapids.
- Tailor amenities and listing descriptions to appeal to the dominant Post-2000s (Gen Z/Alpha) demographic (e.g., highlight fast WiFi, smart home features, local guides).
- Highlight unique local experiences or amenities relevant to the primary guest profile.
- Consider seasonal promotions aligned with peak travel times for key origin markets.
Nearby Short-Term Rental Market Comparison
How does the Charlevoix Airbnb market stack up against its neighbors? Compare key performance metrics like average monthly revenue, ADR, and occupancy rates in surrounding areas to understand the broader regional STR landscape.
| Market | Active Properties | Monthly Revenue | Daily Rate | Avg. Occupancy |
|---|---|---|---|---|
| Friendship Township | 13 | $6,163 | $463.78 | 51% |
| Greilickville | 38 | $6,059 | $490.35 | 51% |
| Blair Township | 52 | $5,055 | $475.54 | 45% |
| Bingham Township | 27 | $4,697 | $479.07 | 46% |
| West Traverse Township | 33 | $4,561 | $529.20 | 39% |
| Leelanau Township | 47 | $4,555 | $413.00 | 51% |
| Wilson Township | 14 | $4,526 | $467.32 | 33% |
| Elmwood Charter Township | 72 | $4,526 | $404.88 | 46% |
| Walloon Lake | 27 | $4,518 | $481.15 | 41% |
| Livingston Township | 11 | $4,487 | $338.56 | 51% |