Canton Township Airbnb Market Analysis 2026: Short Term Rental Data & Vacation Rental Statistics in Michigan, United States
Is Airbnb profitable in Canton Township in 2026? Explore comprehensive Airbnb analytics for Canton Township, Michigan, United States to uncover income potential. This 2026 STR market report for Canton Township, based on AirROI data from February 2025 to January 2026, reveals key trends in the niche market of 27 active listings.
Whether you're considering an Airbnb investment in Canton Township, optimizing your existing vacation rental, or exploring rental arbitrage opportunities, understanding the Canton Township Airbnb data is crucial. Leveraging the low regulation environment is key to maximizing your short term rental income potential. Let's dive into the specifics.
Key Canton Township Airbnb Performance Metrics Overview
Monthly Airbnb Revenue Variations & Income Potential in Canton Township (2026)
Understanding the monthly revenue variations for Airbnb listings in Canton Township is key to maximizing your short term rental income potential. Seasonality significantly impacts earnings. Our analysis, based on data from the past 12 months, shows that the peak revenue month for STRs in Canton Township is typically August, while January often presents the lowest earnings, highlighting opportunities for strategic pricing adjustments during shoulder and low seasons. Explore the typical Airbnb income in Canton Township across different performance tiers:
- Best-in-class properties (Top 10%) achieve $4,621+ monthly, often utilizing dynamic pricing and superior guest experiences.
- Strong performing properties (Top 25%) earn $2,851 or more, indicating effective management and desirable locations/amenities.
- Typical properties (Median) generate around $1,450 per month, representing the average market performance.
- Entry-level properties (Bottom 25%) see earnings around $728, often with potential for optimization.
Average Monthly Airbnb Earnings Trend in Canton Township
Canton Township Airbnb Occupancy Rate Trends (2026)
Maximize your bookings by understanding the Canton Township STR occupancy trends. Seasonal demand shifts significantly influence how often properties are booked. Typically, Augustsees the highest demand (peak season occupancy), while January experiences the lowest (low season). Effective strategies, like adjusting minimum stays or offering promotions, can boost occupancy during slower periods. Here's how different property tiers perform in Canton Township:
- Best-in-class properties (Top 10%) achieve 83%+ occupancy, indicating high desirability and potentially optimized availability.
- Strong performing properties (Top 25%) maintain 64% or higher occupancy, suggesting good market fit and guest satisfaction.
- Typical properties (Median) have an occupancy rate around 43%.
- Entry-level properties (Bottom 25%) average 21% occupancy, potentially facing higher vacancy.
Average Monthly Occupancy Rate Trend in Canton Township
Average Daily Rate (ADR) Airbnb Trends in Canton Township (2026)
Effective short term rental pricing strategy in Canton Township involves understanding monthly ADR fluctuations. The Average Daily Rate (ADR) for Airbnb in Canton Township typically peaks in October and dips lowest during February. Leveraging Airbnb dynamic pricing tools or strategies based on this seasonality can significantly boost revenue. Here's a look at the typical nightly rates achieved:
- Best-in-class properties (Top 10%) command rates of $292+ per night, often due to premium features or locations.
- Strong performing properties (Top 25%) achieve nightly rates of $209 or more.
- Typical properties (Median) charge around $122 per night.
- Entry-level properties (Bottom 25%) earn around $64 per night.
Average Daily Rate (ADR) Trend by Month in Canton Township
Get Live Canton Township Market Intelligence 👇

Explore Real-time Analytics
Airbnb Seasonality Analysis & Trends in Canton Township (2026)
Peak Season (August, July, December)
- Revenue averages $2,648 per month
- Occupancy rates average 56.7%
- Daily rates average $155
Shoulder Season
- Revenue averages $1,947 per month
- Occupancy maintains around 43.8%
- Daily rates hold near $156
Low Season (January, March, April)
- Revenue drops to average $1,422 per month
- Occupancy decreases to average 35.1%
- Daily rates adjust to average $146
Seasonality Insights for Canton Township
- The Airbnb seasonality in Canton Township shows highly seasonal trends requiring careful strategy. While the sections above show seasonal averages, it's also insightful to look at the extremes:
- During the high season, the absolute peak month showcases Canton Township's highest earning potential, with monthly revenues capable of climbing to $2,871, occupancy reaching a high of 67.0%, and ADRs peaking at $175.
- Conversely, the slowest single month of the year, typically falling within the low season, marks the market's lowest point. In this month, revenue might dip to $1,279, occupancy could drop to 29.0%, and ADRs may adjust down to $131.
- Understanding both the seasonal averages and these monthly peaks and troughs in revenue, occupancy, and ADR is crucial for maximizing your Airbnb profit potential in Canton Township.
Seasonal Strategies for Maximizing Profit
- Peak Season: Maximize revenue through premium pricing and potentially longer minimum stays. Ensure high availability.
- Low Season: Offer competitive pricing, special promotions (e.g., extended stay discounts), and flexible cancellation policies. Target off-season travelers like remote workers or budget-conscious guests.
- Shoulder Seasons: Implement dynamic pricing that balances peak and low rates. Target weekend travelers or specific events. Offer slightly more flexible terms than peak season.
- Regularly analyze your own performance against these Canton Township seasonality benchmarks and adjust your pricing and availability strategy accordingly.
Best Areas for Airbnb Investment in Canton Township (2026)
Exploring the top neighborhoods for short-term rentals in Canton Township? This section highlights key areas, outlining why they are attractive for hosts and guests, along with notable local attractions. Consider these locations based on your target guest profile and investment strategy.
| Neighborhood / Area | Why Host Here? (Target Guests & Appeal) | Key Attractions & Landmarks |
|---|---|---|
| Canton Center | The central hub of Canton Township with easy access to shopping, dining, and local parks. It's a prime location for families and business travelers. | Canton Center Sports Complex, The Village Theater at Cherry Hill, Canton Public Library, Heritage Park, Partridge Creek |
| Cherry Hill | A growing area known for its residential communities, parks, and proximity to major freeways. Ideal for visitors looking for a quiet suburban feel yet with amenities nearby. | Cherry Hill Village, Canton Historic District, Lakeside Park, Canton Leisure Services, Plymouth Township Park |
| Plymouth-Canton Community Schools | Renowned for its excellent school system and family-friendly atmosphere, making it attractive for families visiting with children and traveling professionals. | Canton High School, Plymouth-Canton Educational Park, Canton Discovery Center, Canton Sports Center, Canton Farmer's Market |
| Canton’s Historic District | A charming area that showcases the history of Canton with beautiful architecture and local events, appealing to those interested in culture and history. | Canton Historical Museum, Canton's annual Liberty Fest, Heritage Park, Canton's Arts Commission events, Local historic sites |
| Walled Lake | Just a short drive from Canton, offering beautiful lake views and outdoor activities. It's popular with those looking for leisure and nature close to Canton. | Walled Lake, Walled Lake State Park, Local fishing spots, Parks and recreational areas, Summer festivals |
| Americana Park | A vibrant area with family-friendly parks and recreational facilities, making it appealing to those seeking outdoor activities. | Americana Park, Canton Splash Pad, Basketball and tennis courts, Walking trails, Picnic areas |
| Canton Township Parks | Home to several parks and recreational options, suitable for families and outdoor enthusiasts visiting the area. | Independence Park, Kellogg Park, Riverview Park, Parks' sports fields, Nature trails |
| Shopping Districts | Canton has numerous shopping centers and plazas, making it ideal for visitors who enjoy shopping and dining experiences. | Canton's Promenade, Heritage Park’s Farmers Market, Local boutiques, Canton Shopping Center, Major retail outlets |
Understanding Airbnb License Requirements & STR Laws in Canton Township (2026)
While Canton Township, Michigan, United States currently shows low STR regulations, specific Airbnb license requirements might still exist or change. Always verify the latest short term rental regulations and Airbnb license requirements directly with local government authorities for Canton Township to ensure full compliance before hosting.
(Source: AirROI data, 2026, finding no licensed listings among those analyzed)
Top Performing Airbnb Properties in Canton Township (2026)
Benchmark your potential! Explore examples of top-performing Airbnb properties in Canton Townshipbased on Trailing Twelve Month (TTM) revenue. Analyze their characteristics, revenue, occupancy rate, and ADR to understand what drives success in this market.

Fall Special! Canton Spacious 4BR • Sleeps 8
Entire Place • 4 bedrooms
Spacious Charming Oasis Family Friendly in Canton
Entire Place • 4 bedrooms
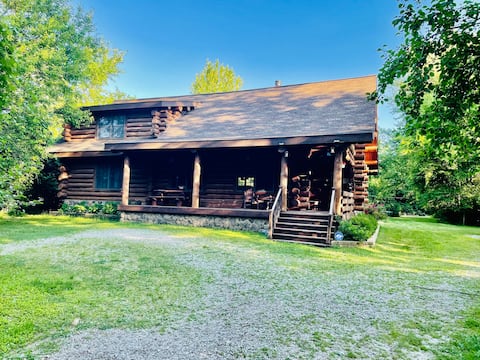
Bud's Paradise- A beautiful cabin in the woods!!!
Entire Place • 4 bedrooms

NEW! Charming LUXE Canton Home!
Entire Place • 3 bedrooms

Bright & Cozy 1 Bdr Apt
Entire Place • 1 bedroom

Ranch S - Complete House
Entire Place • 3 bedrooms
Note: Performance varies based on location, size, amenities, seasonality, and management quality. Data reflects the past 12 months.
Top Performing Airbnb Hosts in Canton Township (2026)
Learn from the best! This table showcases top-performing Airbnb hosts in Canton Township based on the number of properties managed and estimated total revenue over the past year. Analyze their scale and performance metrics.
| Host Name | Properties | Grossing Revenue | Stay Reviews | Avg Rating |
|---|---|---|---|---|
| Nicole | 1 | $57,748 | 34 | 4.94/5.0 |
| Staci | 1 | $48,115 | 71 | 4.97/5.0 |
| Dinesh Reddy | 4 | $43,167 | 119 | 4.92/5.0 |
| Sam | 1 | $40,545 | 98 | 4.66/5.0 |
| Christina | 3 | $40,289 | 11 | 5.00/5.0 |
| Michael | 1 | $36,751 | 13 | 4.69/5.0 |
| Praveen | 2 | $32,027 | 110 | 4.87/5.0 |
| Peter | 1 | $31,598 | 137 | 4.98/5.0 |
| Lynda & Darian | 1 | $21,428 | 145 | 4.86/5.0 |
| Kathy | 1 | $20,640 | 663 | 4.95/5.0 |
Analyzing the strategies of top hosts, such as their property selection, pricing, and guest communication, can offer valuable lessons for optimizing your own Airbnb operations in Canton Township.
Dive Deeper: Advanced Canton Township STR Market Data (2026)
Ready to unlock more insights? AirROI provides access to advanced metrics and comprehensive Airbnb data for Canton Township. Explore detailed analytics beyond this report to refine your investment strategy, optimize pricing, and maximize your vacation rental profits.
Explore Advanced MetricsCanton Township Short-Term Rental Market Composition (2026): Property & Room Types
Room Type Distribution
Property Type Distribution
Market Composition Insights for Canton Township
- The Canton Township Airbnb market composition is heavily skewed towards Entire Home/Apt listings, which make up 66.7% of the 27 active rentals. This indicates strong guest preference for privacy and space.
- However, a notable 33.3% share for Private Rooms suggests opportunities for budget-conscious travelers or hosts renting out spare rooms.
- Looking at the property type distribution in Canton Township, House properties are the most common (44.4%), reflecting the local real estate landscape.
- Houses represent a significant 44.4% portion, catering likely to families or larger groups.
- Smaller segments like unique stays, hotel/boutique (combined 7.4%) offer potential for unique stay experiences.
Canton Township Airbnb Room Capacity Analysis (2026): Bedroom Distribution
Distribution of Listings by Number of Bedrooms
Room Capacity Insights for Canton Township
- The dominant room capacity in Canton Township is 3 bedrooms listings, making up 18.5% of the market. This suggests a strong demand for properties suitable for families or small groups.
- Together, 3 bedrooms and 4 bedrooms properties represent 37.0% of the active Airbnb listings in Canton Township, indicating a high concentration in these sizes.
- A significant 37.0% of listings offer 3+ bedrooms, catering to larger groups and families seeking more space in Canton Township.
Canton Township Vacation Rental Guest Capacity Trends (2026)
Distribution of Listings by Guest Capacity
Guest Capacity Insights for Canton Township
- The most common guest capacity trend in Canton Township vacation rentals is listings accommodating 4 guests (25.9%). This suggests the primary traveler segment is likely small families or groups.
- Properties designed for 4 guests and 8+ guests dominate the Canton Township STR market, accounting for 51.8% of listings.
- 33.3% of properties accommodate 6+ guests, serving the market segment for larger families or group travel in Canton Township.
- On average, properties in Canton Township are equipped to host 3.9 guests.
Canton Township Airbnb Booking Patterns (2026): Available vs. Booked Days
Available Days Distribution
Booked Days Distribution
Booking Pattern Insights for Canton Township
- The most common availability pattern in Canton Township falls within the 271-366 days range, representing 40.7% of listings. This suggests many properties have significant open periods on their calendars.
- Approximately 77.7% of listings show high availability (181+ days open annually), indicating potential for increased bookings or specific owner usage patterns.
- For booked days, the 91-180 days range is most frequent in Canton Township (37%), reflecting common guest stay durations or potential owner blocking patterns.
- A notable 22.2% of properties secure long booking periods (181+ days booked per year), highlighting successful long-term rental strategies or significant owner usage.
Canton Township Airbnb Minimum Stay Requirements Analysis
Distribution of Listings by Minimum Night Requirement
1 Night
5 listings
18.5% of total
2 Nights
6 listings
22.2% of total
7-29 Nights
5 listings
18.5% of total
30+ Nights
11 listings
40.7% of total
Key Insights
- The most prevalent minimum stay requirement in Canton Township is 30+ Nights, adopted by 40.7% of listings. This highlights the market's preference for longer commitments.
- A significant segment (40.7%) caters to monthly stays (30+ nights) in Canton Township, pointing to opportunities in the extended-stay market.
Recommendations
- Align with the market by considering a 30+ Nights minimum stay, as 40.7% of Canton Township hosts use this setting.
- If feasible, allowing 1-night stays, especially midweek or during low season, could capture last-minute bookings, as only 18.5% currently do.
- Explore offering discounts for stays of 30+ nights to attract the 40.7% of the market seeking extended stays.
- Adjust minimum nights based on seasonality – potentially shorter during low season and longer during peak demand periods in Canton Township.
Canton Township Airbnb Cancellation Policy Trends Analysis (2026)
Flexible
6 listings
22.2% of total
Moderate
9 listings
33.3% of total
Firm
6 listings
22.2% of total
Strict
6 listings
22.2% of total
Cancellation Policy Insights for Canton Township
- The prevailing Airbnb cancellation policy trend in Canton Township is Moderate, used by 33.3% of listings.
- There's a relatively balanced mix between guest-friendly (55.5%) and stricter (44.4%) policies, offering choices for different guest needs.
Recommendations for Hosts
- Consider adopting a Moderate policy to align with the 33.3% market standard in Canton Township.
- Regularly review your cancellation policy against competitors and market demand shifts in Canton Township.
Canton Township STR Booking Lead Time Analysis (2026)
Average Booking Lead Time by Month
Booking Lead Time Insights for Canton Township
- The overall average booking lead time for vacation rentals in Canton Township is 46 days.
- Guests book furthest in advance for stays during May (average 84 days), likely coinciding with peak travel demand or local events.
- The shortest booking windows occur for stays in February (average 12 days), indicating more last-minute travel plans during this time.
- Seasonally, Fall (59 days avg.) sees the longest lead times, while Winter (26 days avg.) has the shortest, reflecting typical travel planning cycles.
Recommendations for Hosts
- Use the overall average lead time (46 days) as a baseline for your pricing and availability strategy in Canton Township.
- For May stays, consider implementing length-of-stay discounts or slightly higher rates for bookings made less than 84 days out to capitalize on advance planning.
- During February, focus on last-minute booking availability and promotions, as guests book with very short notice (12 days avg.).
- Target marketing efforts for the Fall season well in advance (at least 59 days) to capture early planners.
- Monitor your own booking lead times against these Canton Township averages to identify opportunities for dynamic pricing adjustments.
Popular & Essential Airbnb Amenities in Canton Township (2026)
Amenity Prevalence
Amenity Insights for Canton Township
- Essential amenities in Canton Township that guests expect include: Smoke alarm, Heating, Free parking on premises, Wifi, Carbon monoxide alarm, Hangers, Hot water, Air conditioning. Lacking these (any) could significantly impact bookings.
- Popular amenities like Microwave, Hair dryer are common but not universal. Offering these can provide a competitive edge.
Recommendations for Hosts
- Ensure your listing includes all essential amenities for Canton Township: Smoke alarm, Heating, Free parking on premises, Wifi, Carbon monoxide alarm, Hangers, Hot water, Air conditioning.
- Prioritize adding missing essentials: Heating, Free parking on premises, Wifi, Carbon monoxide alarm, Hangers, Hot water, Air conditioning.
- Consider adding popular differentiators like Microwave or Hair dryer to increase appeal.
- Highlight unique or less common amenities you offer (e.g., hot tub, dedicated workspace, EV charger) in your listing description and photos.
- Regularly check competitor amenities in Canton Township to stay competitive.
Canton Township Airbnb Guest Demographics & Profile Analysis (2026)
Guest Profile Summary for Canton Township
- The typical guest profile for Airbnb in Canton Township consists of primarily domestic travelers (90%), often arriving from nearby New York, typically belonging to the Post-2000s (Gen Z/Alpha) group (50%), primarily speaking English or Spanish.
- Domestic travelers account for 90.4% of guests.
- Key international markets include United States (90.4%) and Canada (5.1%).
- Top languages spoken are English (71.7%) followed by Spanish (8.7%).
- A significant demographic segment is the Post-2000s (Gen Z/Alpha) group, representing 50% of guests.
Recommendations for Hosts
- Target domestic marketing efforts towards travelers from New York and Canton.
- Tailor amenities and listing descriptions to appeal to the dominant Post-2000s (Gen Z/Alpha) demographic (e.g., highlight fast WiFi, smart home features, local guides).
- Highlight unique local experiences or amenities relevant to the primary guest profile.
- Consider seasonal promotions aligned with peak travel times for key origin markets.
Nearby Short-Term Rental Market Comparison
How does the Canton Township Airbnb market stack up against its neighbors? Compare key performance metrics like average monthly revenue, ADR, and occupancy rates in surrounding areas to understand the broader regional STR landscape.
| Market | Active Properties | Monthly Revenue | Daily Rate | Avg. Occupancy |
|---|---|---|---|---|
| Scio Township | 18 | $5,101 | $764.17 | 43% |
| Huron Township | 17 | $5,053 | $484.21 | 40% |
| Forester | 12 | $4,952 | $407.81 | 39% |
| City of Frankenmuth | 31 | $4,860 | $320.28 | 51% |
| Port Sanilac | 32 | $4,603 | $470.83 | 37% |
| Marblehead | 12 | $4,522 | $595.67 | 39% |
| Grass Lake Charter Township | 14 | $4,410 | $365.88 | 45% |
| Ann Arbor | 487 | $4,080 | $443.76 | 43% |
| Erie Township | 10 | $3,857 | $246.01 | 51% |
| Huron | 127 | $3,854 | $378.44 | 41% |