Trenton Airbnb Market Analysis 2026: Short Term Rental Data & Vacation Rental Statistics in Maine, United States
Is Airbnb profitable in Trenton in 2026? Explore comprehensive Airbnb analytics for Trenton, Maine, United States to uncover income potential. This 2026 STR market report for Trenton, based on AirROI data from February 2025 to January 2026, reveals key trends in the niche market of 141 active listings.
Whether you're considering an Airbnb investment in Trenton, optimizing your existing vacation rental, or exploring rental arbitrage opportunities, understanding the Trenton Airbnb data is crucial. Leveraging the low regulation environment is key to maximizing your short term rental income potential. Let's dive into the specifics.
Key Trenton Airbnb Performance Metrics Overview
Monthly Airbnb Revenue Variations & Income Potential in Trenton (2026)
Understanding the monthly revenue variations for Airbnb listings in Trenton is key to maximizing your short term rental income potential. Seasonality significantly impacts earnings. Our analysis, based on data from the past 12 months, shows that the peak revenue month for STRs in Trenton is typically August, while February often presents the lowest earnings, highlighting opportunities for strategic pricing adjustments during shoulder and low seasons. Explore the typical Airbnb income in Trenton across different performance tiers:
- Best-in-class properties (Top 10%) achieve $11,580+ monthly, often utilizing dynamic pricing and superior guest experiences.
- Strong performing properties (Top 25%) earn $6,609 or more, indicating effective management and desirable locations/amenities.
- Typical properties (Median) generate around $4,285 per month, representing the average market performance.
- Entry-level properties (Bottom 25%) see earnings around $2,812, often with potential for optimization.
Average Monthly Airbnb Earnings Trend in Trenton
Trenton Airbnb Occupancy Rate Trends (2026)
Maximize your bookings by understanding the Trenton STR occupancy trends. Seasonal demand shifts significantly influence how often properties are booked. Typically, Augustsees the highest demand (peak season occupancy), while January experiences the lowest (low season). Effective strategies, like adjusting minimum stays or offering promotions, can boost occupancy during slower periods. Here's how different property tiers perform in Trenton:
- Best-in-class properties (Top 10%) achieve 86%+ occupancy, indicating high desirability and potentially optimized availability.
- Strong performing properties (Top 25%) maintain 74% or higher occupancy, suggesting good market fit and guest satisfaction.
- Typical properties (Median) have an occupancy rate around 54%.
- Entry-level properties (Bottom 25%) average 33% occupancy, potentially facing higher vacancy.
Average Monthly Occupancy Rate Trend in Trenton
Average Daily Rate (ADR) Airbnb Trends in Trenton (2026)
Effective short term rental pricing strategy in Trenton involves understanding monthly ADR fluctuations. The Average Daily Rate (ADR) for Airbnb in Trenton typically peaks in July and dips lowest during February. Leveraging Airbnb dynamic pricing tools or strategies based on this seasonality can significantly boost revenue. Here's a look at the typical nightly rates achieved:
- Best-in-class properties (Top 10%) command rates of $769+ per night, often due to premium features or locations.
- Strong performing properties (Top 25%) achieve nightly rates of $458 or more.
- Typical properties (Median) charge around $291 per night.
- Entry-level properties (Bottom 25%) earn around $197 per night.
Average Daily Rate (ADR) Trend by Month in Trenton
Get Live Trenton Market Intelligence 👇

Explore Real-time Analytics
Airbnb Seasonality Analysis & Trends in Trenton (2026)
Peak Season (August, July, June)
- Revenue averages $10,231 per month
- Occupancy rates average 72.8%
- Daily rates average $444
Shoulder Season
- Revenue averages $5,161 per month
- Occupancy maintains around 52.2%
- Daily rates hold near $381
Low Season (January, February, March)
- Revenue drops to average $1,808 per month
- Occupancy decreases to average 35.4%
- Daily rates adjust to average $340
Seasonality Insights for Trenton
- The Airbnb seasonality in Trenton shows highly seasonal trends requiring careful strategy. While the sections above show seasonal averages, it's also insightful to look at the extremes:
- During the high season, the absolute peak month showcases Trenton's highest earning potential, with monthly revenues capable of climbing to $11,417, occupancy reaching a high of 79.8%, and ADRs peaking at $449.
- Conversely, the slowest single month of the year, typically falling within the low season, marks the market's lowest point. In this month, revenue might dip to $1,176, occupancy could drop to 28.4%, and ADRs may adjust down to $330.
- Understanding both the seasonal averages and these monthly peaks and troughs in revenue, occupancy, and ADR is crucial for maximizing your Airbnb profit potential in Trenton.
Seasonal Strategies for Maximizing Profit
- Peak Season: Maximize revenue through premium pricing and potentially longer minimum stays. Ensure high availability.
- Low Season: Offer competitive pricing, special promotions (e.g., extended stay discounts), and flexible cancellation policies. Target off-season travelers like remote workers or budget-conscious guests.
- Shoulder Seasons: Implement dynamic pricing that balances peak and low rates. Target weekend travelers or specific events. Offer slightly more flexible terms than peak season.
- Regularly analyze your own performance against these Trenton seasonality benchmarks and adjust your pricing and availability strategy accordingly.
Best Areas for Airbnb Investment in Trenton (2026)
Exploring the top neighborhoods for short-term rentals in Trenton? This section highlights key areas, outlining why they are attractive for hosts and guests, along with notable local attractions. Consider these locations based on your target guest profile and investment strategy.
| Neighborhood / Area | Why Host Here? (Target Guests & Appeal) | Key Attractions & Landmarks |
|---|---|---|
| Downtown Trenton | The vibrant heart of Trenton with historic architecture and access to local dining and entertainment. Popular for visitors to the city and offers various attractions. | New Jersey State House, Trenton City Museum, Cadwalader Park, Isabella Stewart Gardner Museum, Mill Hill Park |
| Trenton Waterfront | Scenic area along the Delaware River offering beautiful views and recreational activities. Great for outdoor enthusiasts and those looking to explore the riverfront. | Riverfront Park, Trenton City Marina, The Delaware Canal, Ferry service to Pennsylvania, Biking paths along the river |
| Ewing Township | Adjacent to Trenton, this suburban area provides a quieter atmosphere and easy access to both Trenton and Philadelphia attractions. | The College of New Jersey, Ewing Park, Washington Crossing State Park, Quakerbridge Mall, Ewing rowing club |
| Hamilton Township | A family-friendly region just outside of Trenton, known for its parks and community events. Ideal for families visiting the area for a longer stay. | Pullen Park, Veterans Park, Hamilton Marketplace, Arm & Hammer Park, Kuser Farm Park |
| Mercer County | Broader area that encompasses Trenton with access to various attractions and amenities. Offers a mix of urban and suburban experiences. | Grounds For Sculpture, McCorristin School, Trenton Country Club, Mercer Lake, Hamilton Train Station |
| Pennington | A charming small town atmosphere with historic sites and local shops, perfect for those seeking a quaint getaway near Trenton. | Pennington School, Hobler Park, Baldpate Mountain, Thompson Park, local antique shops |
| Lawrence Township | Offers a suburban feel with proximity to Trenton and a range of outdoor activities. Good for visitors looking for a peaceful stay. | Lawrence Hopewell Trail, Bunker Hill Park, Shabakunk Creek, Mercer County Park, local dining options |
| West Trenton | A peaceful community with residential charm, providing easy access to Trenton's amenities while offering a quieter environment for visitors. | West Trenton train station, local parks, small cafes, proximity to major highways, regional attractions |
Understanding Airbnb License Requirements & STR Laws in Trenton (2026)
While Trenton, Maine, United States currently shows low STR regulations, specific Airbnb license requirements might still exist or change. Always verify the latest short term rental regulations and Airbnb license requirements directly with local government authorities for Trenton to ensure full compliance before hosting.
(Source: AirROI data, 2026, finding no licensed listings among those analyzed)
Top Performing Airbnb Properties in Trenton (2026)
Benchmark your potential! Explore examples of top-performing Airbnb properties in Trentonbased on Trailing Twelve Month (TTM) revenue. Analyze their characteristics, revenue, occupancy rate, and ADR to understand what drives success in this market.

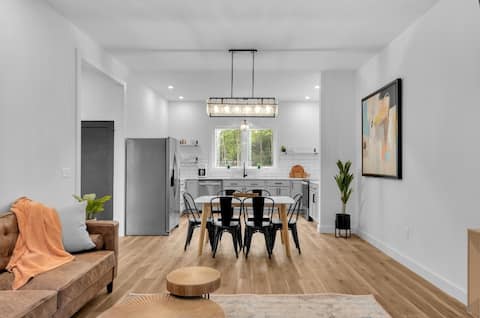
Oak Point Bluff! New! Oceanfront!
Entire Place • 5 bedrooms
Ace of Spade@Acadia National Park, Sleeps 24
Entire Place • 4 bedrooms
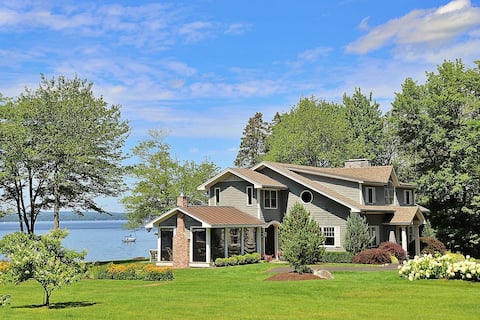
Bayside Manor: a Classic Maine Oceanfront Home
Entire Place • 4 bedrooms
Carroll's Cove
Entire Place • 8 bedrooms

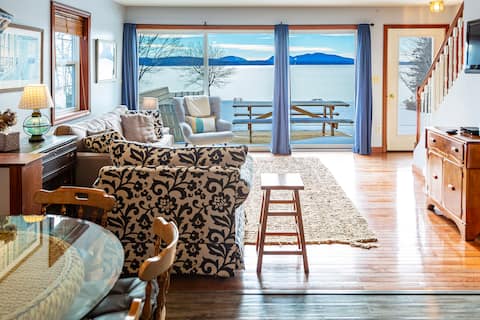
Acadia Beach House near Bar Harbor
Entire Place • 3 bedrooms

Designer Oceanfront, Acadia Views, Near Bar Harbor
Entire Place • 5 bedrooms
Note: Performance varies based on location, size, amenities, seasonality, and management quality. Data reflects the past 12 months.
Top Performing Airbnb Hosts in Trenton (2026)
Learn from the best! This table showcases top-performing Airbnb hosts in Trenton based on the number of properties managed and estimated total revenue over the past year. Analyze their scale and performance metrics.
| Host Name | Properties | Grossing Revenue | Stay Reviews | Avg Rating |
|---|---|---|---|---|
| Arthur William | 19 | $826,962 | 1733 | 4.86/5.0 |
| Derek | 17 | $816,334 | 726 | 4.88/5.0 |
| Salt Air | 7 | $732,052 | 112 | 4.84/5.0 |
| Isleview Motel And Cottages | 16 | $561,000 | 624 | 4.77/5.0 |
| Dwayne | 5 | $426,461 | 225 | 4.64/5.0 |
| Lura Brianna | 3 | $374,867 | 299 | 4.96/5.0 |
| Robard | 2 | $284,638 | 119 | 4.99/5.0 |
| Nazrin | 7 | $266,813 | 251 | 4.87/5.0 |
| Justin | 3 | $226,600 | 91 | 4.88/5.0 |
| Patrick | 1 | $174,122 | 46 | 5.00/5.0 |
Analyzing the strategies of top hosts, such as their property selection, pricing, and guest communication, can offer valuable lessons for optimizing your own Airbnb operations in Trenton.
Dive Deeper: Advanced Trenton STR Market Data (2026)
Ready to unlock more insights? AirROI provides access to advanced metrics and comprehensive Airbnb data for Trenton. Explore detailed analytics beyond this report to refine your investment strategy, optimize pricing, and maximize your vacation rental profits.
Explore Advanced MetricsTrenton Short-Term Rental Market Composition (2026): Property & Room Types
Room Type Distribution
Property Type Distribution
Market Composition Insights for Trenton
- The Trenton Airbnb market composition is heavily skewed towards Entire Home/Apt listings, which make up 85.8% of the 141 active rentals. This indicates strong guest preference for privacy and space.
- Looking at the property type distribution in Trenton, House properties are the most common (54.6%), reflecting the local real estate landscape.
- Houses represent a significant 54.6% portion, catering likely to families or larger groups.
- The presence of 6.4% Hotel/Boutique listings indicates integration with traditional hospitality.
Trenton Airbnb Room Capacity Analysis (2026): Bedroom Distribution
Distribution of Listings by Number of Bedrooms
Room Capacity Insights for Trenton
- The dominant room capacity in Trenton is 1 bedroom listings, making up 26.2% of the market. This suggests a strong demand for properties suitable for couples or solo travelers.
- Together, 1 bedroom and 3 bedrooms properties represent 51.0% of the active Airbnb listings in Trenton, indicating a high concentration in these sizes.
- A significant 39.7% of listings offer 3+ bedrooms, catering to larger groups and families seeking more space in Trenton.
Trenton Vacation Rental Guest Capacity Trends (2026)
Distribution of Listings by Guest Capacity
Guest Capacity Insights for Trenton
- The most common guest capacity trend in Trenton vacation rentals is listings accommodating 6 guests (27.7%). This suggests the primary traveler segment is likely larger groups.
- Properties designed for 6 guests and 4 guests dominate the Trenton STR market, accounting for 50.4% of listings.
- 51.8% of properties accommodate 6+ guests, serving the market segment for larger families or group travel in Trenton.
- On average, properties in Trenton are equipped to host 5.1 guests.
Trenton Airbnb Booking Patterns (2026): Available vs. Booked Days
Available Days Distribution
Booked Days Distribution
Booking Pattern Insights for Trenton
- The most common availability pattern in Trenton falls within the 181-270 days range, representing 49.6% of listings. This suggests many properties have significant open periods on their calendars.
- Approximately 70.9% of listings show high availability (181+ days open annually), indicating potential for increased bookings or specific owner usage patterns.
- For booked days, the 91-180 days range is most frequent in Trenton (53.9%), reflecting common guest stay durations or potential owner blocking patterns.
- A notable 29.8% of properties secure long booking periods (181+ days booked per year), highlighting successful long-term rental strategies or significant owner usage.
Trenton Airbnb Minimum Stay Requirements Analysis
Distribution of Listings by Minimum Night Requirement
1 Night
15 listings
10.6% of total
2 Nights
8 listings
5.7% of total
3 Nights
8 listings
5.7% of total
4-6 Nights
20 listings
14.2% of total
7-29 Nights
6 listings
4.3% of total
30+ Nights
84 listings
59.6% of total
Key Insights
- The most prevalent minimum stay requirement in Trenton is 30+ Nights, adopted by 59.6% of listings. This highlights the market's preference for longer commitments.
- Very short stays (1-2 nights) are less common (16.3%), suggesting hosts prefer slightly longer bookings to optimize turnover.
- A significant segment (59.6%) caters to monthly stays (30+ nights) in Trenton, pointing to opportunities in the extended-stay market.
Recommendations
- Align with the market by considering a 30+ Nights minimum stay, as 59.6% of Trenton hosts use this setting.
- If feasible, allowing 1-night stays, especially midweek or during low season, could capture last-minute bookings, as only 10.6% currently do.
- Explore offering discounts for stays of 30+ nights to attract the 59.6% of the market seeking extended stays.
- Adjust minimum nights based on seasonality – potentially shorter during low season and longer during peak demand periods in Trenton.
Trenton Airbnb Cancellation Policy Trends Analysis (2026)
Super Strict 60 Days
3 listings
2.1% of total
Super Strict 30 Days
4 listings
2.8% of total
Flexible
37 listings
26.2% of total
Moderate
9 listings
6.4% of total
Firm
68 listings
48.2% of total
Strict
20 listings
14.2% of total
Cancellation Policy Insights for Trenton
- The prevailing Airbnb cancellation policy trend in Trenton is Firm, used by 48.2% of listings.
- A majority (62.4%) of hosts in Trenton utilize Firm or Strict policies, indicating a market where hosts prioritize booking security.
Recommendations for Hosts
- Consider adopting a Firm policy to align with the 48.2% market standard in Trenton.
- Using a Strict policy might deter some guests, as only 14.2% of listings use it. Evaluate if potential revenue protection outweighs possible lower booking rates.
- Regularly review your cancellation policy against competitors and market demand shifts in Trenton.
Trenton STR Booking Lead Time Analysis (2026)
Average Booking Lead Time by Month
Booking Lead Time Insights for Trenton
- The overall average booking lead time for vacation rentals in Trenton is 59 days.
- Guests book furthest in advance for stays during July (average 80 days), likely coinciding with peak travel demand or local events.
- The shortest booking windows occur for stays in December (average 19 days), indicating more last-minute travel plans during this time.
- Seasonally, Summer (73 days avg.) sees the longest lead times, while Winter (25 days avg.) has the shortest, reflecting typical travel planning cycles.
Recommendations for Hosts
- Use the overall average lead time (59 days) as a baseline for your pricing and availability strategy in Trenton.
- For July stays, consider implementing length-of-stay discounts or slightly higher rates for bookings made less than 80 days out to capitalize on advance planning.
- Target marketing efforts for the Summer season well in advance (at least 73 days) to capture early planners.
- Monitor your own booking lead times against these Trenton averages to identify opportunities for dynamic pricing adjustments.
Popular & Essential Airbnb Amenities in Trenton (2026)
Amenity Prevalence
Amenity Insights for Trenton
- Essential amenities in Trenton that guests expect include: Wifi, Hot water, Heating, TV, Free parking on premises. Lacking these (any) could significantly impact bookings.
- Popular amenities like Bed linens, Coffee maker, Smoke alarm are common but not universal. Offering these can provide a competitive edge.
Recommendations for Hosts
- Ensure your listing includes all essential amenities for Trenton: Wifi, Hot water, Heating, TV, Free parking on premises.
- Prioritize adding missing essentials: Hot water, Heating, TV, Free parking on premises.
- Consider adding popular differentiators like Bed linens or Coffee maker to increase appeal.
- Highlight unique or less common amenities you offer (e.g., hot tub, dedicated workspace, EV charger) in your listing description and photos.
- Regularly check competitor amenities in Trenton to stay competitive.
Trenton Airbnb Guest Demographics & Profile Analysis (2026)
Guest Profile Summary for Trenton
- The typical guest profile for Airbnb in Trenton consists of primarily domestic travelers (96%), often arriving from nearby New York, typically belonging to the Post-2000s (Gen Z/Alpha) group (50%), primarily speaking English or Spanish.
- Domestic travelers account for 96.0% of guests.
- Key international markets include United States (96%) and DC (0.6%).
- Top languages spoken are English (69.1%) followed by Spanish (9.6%).
- A significant demographic segment is the Post-2000s (Gen Z/Alpha) group, representing 50% of guests.
Recommendations for Hosts
- Target domestic marketing efforts towards travelers from New York and Boston.
- Tailor amenities and listing descriptions to appeal to the dominant Post-2000s (Gen Z/Alpha) demographic (e.g., highlight fast WiFi, smart home features, local guides).
- Highlight unique local experiences or amenities relevant to the primary guest profile.
- Consider seasonal promotions aligned with peak travel times for key origin markets.
Nearby Short-Term Rental Market Comparison
How does the Trenton Airbnb market stack up against its neighbors? Compare key performance metrics like average monthly revenue, ADR, and occupancy rates in surrounding areas to understand the broader regional STR landscape.
| Market | Active Properties | Monthly Revenue | Daily Rate | Avg. Occupancy |
|---|---|---|---|---|
| Bar Harbor | 510 | $5,047 | $413.86 | 58% |
| Mount Desert | 198 | $4,605 | $435.23 | 52% |
| Tremont | 158 | $4,450 | $380.52 | 55% |
| Manchester | 12 | $4,389 | $406.26 | 46% |
| Southwest Harbor | 260 | $4,311 | $406.14 | 54% |
| Lamoine | 97 | $3,923 | $327.88 | 55% |
| Georgetown | 45 | $3,816 | $379.01 | 50% |
| Otis | 38 | $3,656 | $334.83 | 51% |
| Gouldsboro | 127 | $3,459 | $365.85 | 48% |
| Taunton & Raynham Academy Grant | 11 | $3,401 | $299.08 | 50% |