Sedgwick Airbnb Market Analysis 2026: Short Term Rental Data & Vacation Rental Statistics in Maine, United States
Is Airbnb profitable in Sedgwick in 2026? Explore comprehensive Airbnb analytics for Sedgwick, Maine, United States to uncover income potential. This 2026 STR market report for Sedgwick, based on AirROI data from February 2025 to January 2026, reveals key trends in the niche market of 26 active listings.
Whether you're considering an Airbnb investment in Sedgwick, optimizing your existing vacation rental, or exploring rental arbitrage opportunities, understanding the Sedgwick Airbnb data is crucial. Leveraging the low regulation environment is key to maximizing your short term rental income potential. Let's dive into the specifics.
Key Sedgwick Airbnb Performance Metrics Overview
Monthly Airbnb Revenue Variations & Income Potential in Sedgwick (2026)
Understanding the monthly revenue variations for Airbnb listings in Sedgwick is key to maximizing your short term rental income potential. Seasonality significantly impacts earnings. Our analysis, based on data from the past 12 months, shows that the peak revenue month for STRs in Sedgwick is typically August, while January often presents the lowest earnings, highlighting opportunities for strategic pricing adjustments during shoulder and low seasons. Explore the typical Airbnb income in Sedgwick across different performance tiers:
- Best-in-class properties (Top 10%) achieve $7,465+ monthly, often utilizing dynamic pricing and superior guest experiences.
- Strong performing properties (Top 25%) earn $5,236 or more, indicating effective management and desirable locations/amenities.
- Typical properties (Median) generate around $3,278 per month, representing the average market performance.
- Entry-level properties (Bottom 25%) see earnings around $1,873, often with potential for optimization.
Average Monthly Airbnb Earnings Trend in Sedgwick
Sedgwick Airbnb Occupancy Rate Trends (2026)
Maximize your bookings by understanding the Sedgwick STR occupancy trends. Seasonal demand shifts significantly influence how often properties are booked. Typically, Augustsees the highest demand (peak season occupancy), while January experiences the lowest (low season). Effective strategies, like adjusting minimum stays or offering promotions, can boost occupancy during slower periods. Here's how different property tiers perform in Sedgwick:
- Best-in-class properties (Top 10%) achieve 74%+ occupancy, indicating high desirability and potentially optimized availability.
- Strong performing properties (Top 25%) maintain 59% or higher occupancy, suggesting good market fit and guest satisfaction.
- Typical properties (Median) have an occupancy rate around 40%.
- Entry-level properties (Bottom 25%) average 25% occupancy, potentially facing higher vacancy.
Average Monthly Occupancy Rate Trend in Sedgwick
Average Daily Rate (ADR) Airbnb Trends in Sedgwick (2026)
Effective short term rental pricing strategy in Sedgwick involves understanding monthly ADR fluctuations. The Average Daily Rate (ADR) for Airbnb in Sedgwick typically peaks in July and dips lowest during April. Leveraging Airbnb dynamic pricing tools or strategies based on this seasonality can significantly boost revenue. Here's a look at the typical nightly rates achieved:
- Best-in-class properties (Top 10%) command rates of $477+ per night, often due to premium features or locations.
- Strong performing properties (Top 25%) achieve nightly rates of $354 or more.
- Typical properties (Median) charge around $254 per night.
- Entry-level properties (Bottom 25%) earn around $167 per night.
Average Daily Rate (ADR) Trend by Month in Sedgwick
Get Live Sedgwick Market Intelligence 👇

Explore Real-time Analytics
Airbnb Seasonality Analysis & Trends in Sedgwick (2026)
Peak Season (August, July, June)
- Revenue averages $6,675 per month
- Occupancy rates average 65.0%
- Daily rates average $300
Shoulder Season
- Revenue averages $3,726 per month
- Occupancy maintains around 44.6%
- Daily rates hold near $289
Low Season (January, February, December)
- Revenue drops to average $1,586 per month
- Occupancy decreases to average 16.3%
- Daily rates adjust to average $288
Seasonality Insights for Sedgwick
- The Airbnb seasonality in Sedgwick shows highly seasonal trends requiring careful strategy. While the sections above show seasonal averages, it's also insightful to look at the extremes:
- During the high season, the absolute peak month showcases Sedgwick's highest earning potential, with monthly revenues capable of climbing to $7,189, occupancy reaching a high of 73.1%, and ADRs peaking at $304.
- Conversely, the slowest single month of the year, typically falling within the low season, marks the market's lowest point. In this month, revenue might dip to $1,293, occupancy could drop to 11.8%, and ADRs may adjust down to $272.
- Understanding both the seasonal averages and these monthly peaks and troughs in revenue, occupancy, and ADR is crucial for maximizing your Airbnb profit potential in Sedgwick.
Seasonal Strategies for Maximizing Profit
- Peak Season: Maximize revenue through premium pricing and potentially longer minimum stays. Ensure high availability.
- Low Season: Offer competitive pricing, special promotions (e.g., extended stay discounts), and flexible cancellation policies. Target off-season travelers like remote workers or budget-conscious guests.
- Shoulder Seasons: Implement dynamic pricing that balances peak and low rates. Target weekend travelers or specific events. Offer slightly more flexible terms than peak season.
- Regularly analyze your own performance against these Sedgwick seasonality benchmarks and adjust your pricing and availability strategy accordingly.
Best Areas for Airbnb Investment in Sedgwick (2026)
Exploring the top neighborhoods for short-term rentals in Sedgwick? This section highlights key areas, outlining why they are attractive for hosts and guests, along with notable local attractions. Consider these locations based on your target guest profile and investment strategy.
| Neighborhood / Area | Why Host Here? (Target Guests & Appeal) | Key Attractions & Landmarks |
|---|---|---|
| Bar Harbor | A popular gateway to Acadia National Park, with stunning coastal views and vibrant dining options. Ideal for tourists looking for outdoor adventures and scenic beauty. | Acadia National Park, Bar Harbor Whale Watch Company, Shore Path, Abbe Museum, Sand Beach, Jordan Pond |
| Acadia National Park | A magnificent national park with breathtaking landscapes, hiking trails, and outdoor activities. Excellent for nature lovers and those seeking tranquility. | Cadillac Mountain, Park Loop Road, Sand Beach, Jordan Pond, Wild Gardens of Acadia |
| Blue Hill | A charming coastal town known for its arts scene and natural beauty. Great for travelers interested in local culture and community events. | Blue Hill Mountain, Blue Hill Heritage Trust, Downeast Salmon Federation, Blue Hill Artisans |
| Castine | A historic town with well-preserved architecture and a maritime heritage. Attractive for those interested in history and coastal scenery. | Castine Historical Society, Fort George, Wadsworth-Longfellow House, Penobscot Bay |
| Stonington | A picturesque fishing village known for its lobster and artistic community. Popular among tourists seeking a quaint and authentic coastal experience. | Stonington Harbor, Island Maker, Sedgwick's Long Cove, Lighthouse Museum |
| Ellsworth | A growing town that serves as a hub for visitors to Bar Harbor and Acadia. Offers shopping, dining, and proximity to attractions. | Woodlawn Museum, Ellsworth City Park, Downeast Scenic Railroad, Ellsworth Farmers Market |
| Mount Desert Island | Home to charming villages and stunning natural landscapes, Mount Desert Island is fantastic for nature enthusiasts and vacationing families. | Southwest Harbor, Northwest Harbor, Seal Cove, Somes Sound |
| Deer Isle | An artist's haven with beautiful scenery and artistic communities. Suitable for travelers looking for creativity and coastal views. | Deer Isle Preserve, Eggemoggin Reach, Haystack Mountain School of Crafts, Deer Isle Stonington Historical Society |
Understanding Airbnb License Requirements & STR Laws in Sedgwick (2026)
While Sedgwick, Maine, United States currently shows low STR regulations, specific Airbnb license requirements might still exist or change. Always verify the latest short term rental regulations and Airbnb license requirements directly with local government authorities for Sedgwick to ensure full compliance before hosting.
(Source: AirROI data, 2026, finding no licensed listings among those analyzed)
Top Performing Airbnb Properties in Sedgwick (2026)
Benchmark your potential! Explore examples of top-performing Airbnb properties in Sedgwickbased on Trailing Twelve Month (TTM) revenue. Analyze their characteristics, revenue, occupancy rate, and ADR to understand what drives success in this market.
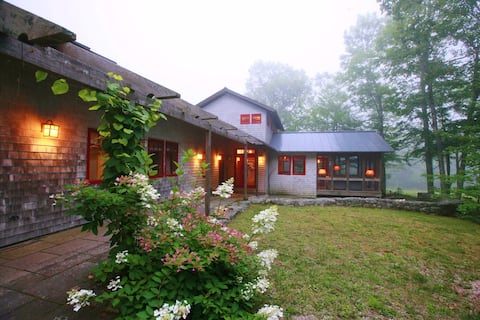
Stunning Hilltop Architectural Gem @Diagonair
Entire Place • 3 bedrooms

Rising Tide - Sanctuary on Walker Pond
Entire Place • 3 bedrooms
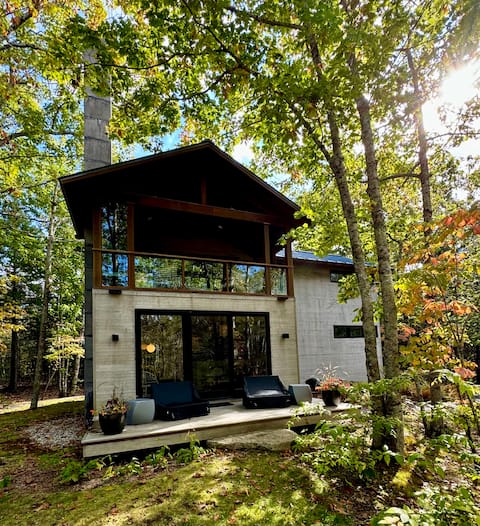
Exquisitely Modern Stargazing Cottage @Diagonair
Entire Place • 1 bedroom

The Cabins at Currier Landing Cabin 1: Fern
Entire Place • 1 bedroom

Magical Rustic Cabin Lake Gettaway
Entire Place • 2 bedrooms
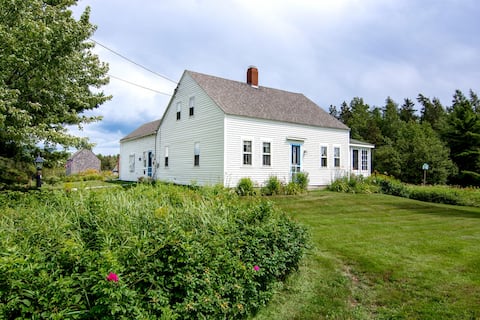
Salt Pond Farmhouse
Entire Place • 3 bedrooms
Note: Performance varies based on location, size, amenities, seasonality, and management quality. Data reflects the past 12 months.
Top Performing Airbnb Hosts in Sedgwick (2026)
Learn from the best! This table showcases top-performing Airbnb hosts in Sedgwick based on the number of properties managed and estimated total revenue over the past year. Analyze their scale and performance metrics.
| Host Name | Properties | Grossing Revenue | Stay Reviews | Avg Rating |
|---|---|---|---|---|
| Ann | 3 | $207,169 | 516 | 4.98/5.0 |
| David & Bill | 2 | $88,007 | 220 | 4.99/5.0 |
| Nadejda | 1 | $85,600 | 7 | 5.00/5.0 |
| Serena | 1 | $50,640 | 51 | 5.00/5.0 |
| Michael | 1 | $44,982 | 59 | 4.98/5.0 |
| Salt Air | 1 | $44,535 | 10 | 5.00/5.0 |
| Hui | 2 | $43,268 | 162 | 4.95/5.0 |
| Pi | 1 | $43,211 | 57 | 5.00/5.0 |
| Scott | 1 | $39,134 | 54 | 4.93/5.0 |
| Kristin | 1 | $37,722 | 8 | 5.00/5.0 |
Analyzing the strategies of top hosts, such as their property selection, pricing, and guest communication, can offer valuable lessons for optimizing your own Airbnb operations in Sedgwick.
Dive Deeper: Advanced Sedgwick STR Market Data (2026)
Ready to unlock more insights? AirROI provides access to advanced metrics and comprehensive Airbnb data for Sedgwick. Explore detailed analytics beyond this report to refine your investment strategy, optimize pricing, and maximize your vacation rental profits.
Explore Advanced MetricsSedgwick Short-Term Rental Market Composition (2026): Property & Room Types
Room Type Distribution
Property Type Distribution
Market Composition Insights for Sedgwick
- The Sedgwick Airbnb market composition is heavily skewed towards Entire Home/Apt listings, which make up 92.3% of the 26 active rentals. This indicates strong guest preference for privacy and space.
- Looking at the property type distribution in Sedgwick, House properties are the most common (65.4%), reflecting the local real estate landscape.
- Houses represent a significant 65.4% portion, catering likely to families or larger groups.
- Smaller segments like hotel/boutique (combined 3.8%) offer potential for unique stay experiences.
Sedgwick Airbnb Room Capacity Analysis (2026): Bedroom Distribution
Distribution of Listings by Number of Bedrooms
Room Capacity Insights for Sedgwick
- The dominant room capacity in Sedgwick is 1 bedroom listings, making up 34.6% of the market. This suggests a strong demand for properties suitable for couples or solo travelers.
- Together, 1 bedroom and 2 bedrooms properties represent 57.7% of the active Airbnb listings in Sedgwick, indicating a high concentration in these sizes.
- A significant 34.6% of listings offer 3+ bedrooms, catering to larger groups and families seeking more space in Sedgwick.
Sedgwick Vacation Rental Guest Capacity Trends (2026)
Distribution of Listings by Guest Capacity
Guest Capacity Insights for Sedgwick
- The most common guest capacity trend in Sedgwick vacation rentals is listings accommodating 2 guests (26.9%). This suggests the primary traveler segment is likely couples or solo travelers.
- Properties designed for 2 guests and 4 guests dominate the Sedgwick STR market, accounting for 50.0% of listings.
- 34.6% of properties accommodate 6+ guests, serving the market segment for larger families or group travel in Sedgwick.
- On average, properties in Sedgwick are equipped to host 4.3 guests.
Sedgwick Airbnb Booking Patterns (2026): Available vs. Booked Days
Available Days Distribution
Booked Days Distribution
Booking Pattern Insights for Sedgwick
- The most common availability pattern in Sedgwick falls within the 271-366 days range, representing 53.8% of listings. This suggests many properties have significant open periods on their calendars.
- Approximately 84.6% of listings show high availability (181+ days open annually), indicating potential for increased bookings or specific owner usage patterns.
- For booked days, the 31-90 days range is most frequent in Sedgwick (50%), reflecting common guest stay durations or potential owner blocking patterns.
- A notable 15.4% of properties secure long booking periods (181+ days booked per year), highlighting successful long-term rental strategies or significant owner usage.
Sedgwick Airbnb Minimum Stay Requirements Analysis
Distribution of Listings by Minimum Night Requirement
1 Night
4 listings
15.4% of total
2 Nights
5 listings
19.2% of total
3 Nights
3 listings
11.5% of total
4-6 Nights
2 listings
7.7% of total
7-29 Nights
1 listings
3.8% of total
30+ Nights
11 listings
42.3% of total
Key Insights
- The most prevalent minimum stay requirement in Sedgwick is 30+ Nights, adopted by 42.3% of listings. This highlights the market's preference for longer commitments.
- A significant segment (42.3%) caters to monthly stays (30+ nights) in Sedgwick, pointing to opportunities in the extended-stay market.
Recommendations
- Align with the market by considering a 30+ Nights minimum stay, as 42.3% of Sedgwick hosts use this setting.
- If feasible, allowing 1-night stays, especially midweek or during low season, could capture last-minute bookings, as only 15.4% currently do.
- Explore offering discounts for stays of 30+ nights to attract the 42.3% of the market seeking extended stays.
- Adjust minimum nights based on seasonality – potentially shorter during low season and longer during peak demand periods in Sedgwick.
Sedgwick Airbnb Cancellation Policy Trends Analysis (2026)
Flexible
2 listings
7.7% of total
Moderate
1 listings
3.8% of total
Firm
18 listings
69.2% of total
Strict
5 listings
19.2% of total
Cancellation Policy Insights for Sedgwick
- The prevailing Airbnb cancellation policy trend in Sedgwick is Firm, used by 69.2% of listings.
- A majority (88.4%) of hosts in Sedgwick utilize Firm or Strict policies, indicating a market where hosts prioritize booking security.
Recommendations for Hosts
- Consider adopting a Firm policy to align with the 69.2% market standard in Sedgwick.
- Regularly review your cancellation policy against competitors and market demand shifts in Sedgwick.
Sedgwick STR Booking Lead Time Analysis (2026)
Average Booking Lead Time by Month
Booking Lead Time Insights for Sedgwick
- The overall average booking lead time for vacation rentals in Sedgwick is 94 days.
- Guests book furthest in advance for stays during April (average 136 days), likely coinciding with peak travel demand or local events.
- The shortest booking windows occur for stays in February (average 13 days), indicating more last-minute travel plans during this time.
- Seasonally, Spring (103 days avg.) sees the longest lead times, while Winter (36 days avg.) has the shortest, reflecting typical travel planning cycles.
Recommendations for Hosts
- Use the overall average lead time (94 days) as a baseline for your pricing and availability strategy in Sedgwick.
- For April stays, consider implementing length-of-stay discounts or slightly higher rates for bookings made less than 136 days out to capitalize on advance planning.
- During February, focus on last-minute booking availability and promotions, as guests book with very short notice (13 days avg.).
- Target marketing efforts for the Spring season well in advance (at least 103 days) to capture early planners.
- Monitor your own booking lead times against these Sedgwick averages to identify opportunities for dynamic pricing adjustments.
Popular & Essential Airbnb Amenities in Sedgwick (2026)
Amenity Prevalence
Amenity Insights for Sedgwick
- Essential amenities in Sedgwick that guests expect include: Smoke alarm, Wifi, Free parking on premises. Lacking these (any) could significantly impact bookings.
- Popular amenities like Bed linens, Heating, Hot water are common but not universal. Offering these can provide a competitive edge.
Recommendations for Hosts
- Ensure your listing includes all essential amenities for Sedgwick: Smoke alarm, Wifi, Free parking on premises.
- Prioritize adding missing essentials: Free parking on premises.
- Consider adding popular differentiators like Bed linens or Heating to increase appeal.
- Highlight unique or less common amenities you offer (e.g., hot tub, dedicated workspace, EV charger) in your listing description and photos.
- Regularly check competitor amenities in Sedgwick to stay competitive.
Sedgwick Airbnb Guest Demographics & Profile Analysis (2026)
Guest Profile Summary for Sedgwick
- The typical guest profile for Airbnb in Sedgwick consists of primarily domestic travelers (95%), often arriving from nearby New York, typically belonging to the Post-2000s (Gen Z/Alpha) group (50%), primarily speaking English or Spanish.
- Domestic travelers account for 95.0% of guests.
- Key international markets include United States (95%) and United Kingdom (1.5%).
- Top languages spoken are English (74.7%) followed by Spanish (5.3%).
- A significant demographic segment is the Post-2000s (Gen Z/Alpha) group, representing 50% of guests.
Recommendations for Hosts
- Target domestic marketing efforts towards travelers from New York and Boston.
- Tailor amenities and listing descriptions to appeal to the dominant Post-2000s (Gen Z/Alpha) demographic (e.g., highlight fast WiFi, smart home features, local guides).
- Highlight unique local experiences or amenities relevant to the primary guest profile.
- Consider seasonal promotions aligned with peak travel times for key origin markets.
Nearby Short-Term Rental Market Comparison
How does the Sedgwick Airbnb market stack up against its neighbors? Compare key performance metrics like average monthly revenue, ADR, and occupancy rates in surrounding areas to understand the broader regional STR landscape.
| Market | Active Properties | Monthly Revenue | Daily Rate | Avg. Occupancy |
|---|---|---|---|---|
| Bar Harbor | 510 | $5,047 | $413.86 | 58% |
| Mount Desert | 198 | $4,605 | $435.23 | 52% |
| Trenton | 141 | $4,555 | $388.61 | 57% |
| Tremont | 158 | $4,450 | $380.52 | 55% |
| Manchester | 12 | $4,389 | $406.26 | 46% |
| Southwest Harbor | 260 | $4,311 | $406.14 | 54% |
| Lamoine | 97 | $3,923 | $327.88 | 55% |
| Georgetown | 45 | $3,816 | $379.01 | 50% |
| Otis | 38 | $3,656 | $334.83 | 51% |
| Gouldsboro | 127 | $3,459 | $365.85 | 48% |